Article

Population Differentiation in Acer platanoides L. at the Regional Scale—Laying the Basis for Effective Conservation of Its Genetic Resources in Austria

1
Department of Forest Biodiversity and Nature Conservation, Austrian Research and Training Centre for Forests (BFW), Seckendorff-Gudent-Weg 8, 1131 Vienna, Austria
2
Department of Genetics and Forest Tree Breeding, Georg-August University of Göttingen, Büsgenweg 2, 37077 Göttingen, Germany
3
Tartu Observatory, Faculty of Science and Technology, University of Tartu, Observatooriumi 1, 161602 Töravere, Estonia
4
Natural Resources Institute Finland (LUKE), Latokartanonkaari 9, 00790 Helsinki, Finland
5
Faculty of Forestry in Sarajevo, University of Sarajevo, Zagrebačka 20, 71000 Sarajevo, Bosnia and Herzegovina
6
Slovenian Forestry Institute, Večna Pot 2, 1000 Ljubljana, Slovenia
*
Author to whom correspondence should be addressed.
Forests 2022, 13(4), 552; https://doi.org/10.3390/f13040552
Submission received: 10 March 2022 / Revised: 25 March 2022 / Accepted: 29 March 2022 / Published: 31 March 2022
(This article belongs to the Special Issue Importance of Genetic Diversity for Forest and Landscape Restoration)

Abstract

:
Norway maple (Acer platanoides L.) is a widespread forest tree species in Central and Northern Europe but with a scattered distribution. In the debate on climate change driven changes in species selection in the forest, Norway maple has recently received raised interest because of its comparatively high drought resistance (higher than in sycamore maple). Therefore, it is an interesting species for sites high in carbonates and where other native tree species have become devastated by pathogens (e.g., elm, ash). In Austria, the demand on saplings is currently rising, while there is only very little domestic reproductive material available (on average more than 95% of saplings are imported from neighboring countries). This study was undertaken to identify genetic diversity and population structure of Norway maple in Austria to lay the foundation for the establishment of respective in situ and ex situ conservation measures. In addition, samples from planted stands and imported reproductive material from other countries were included to study the anthropogenic influence on the species in managed forests. We used 11 novel microsatellites to genotype 756 samples from 27 putatively natural Austrian populations, and 186 samples derived from two planted stands and five lots of forest reproductive material; in addition, 106 samples from other European populations were also genotyped. Cross species amplification of the new markers was tested in 19 Acer species from around the world. Population clustering by STRUCTURE analysis revealed a distinct pattern of population structure in Austria and Europe, but overall moderate differentiation. Sibship analysis identifies several populations with severe founding effects, highlighting the need for proper selection of seed sources of sufficient genetic diversity in the species.

1. Introduction

European forests are currently changing at a fast rate—the effects of climate change are becoming evident by large scale breakdown of forest stands which are not adapted to the future climate, through drought and pest incidence. At the same time, forest cover plays an important role in counteracting the effects of climate change through buffering CO2 emissions [1] and the additional planting of trees has been set as an important goal of the European Green Deal for fighting climate change (European Commission 2019). The choice of the forest reproductive material (FRM) to be used in future afforestation is crucial for the long-term stability and productivity of forests. To minimize the risk of failure of afforestation efforts the establishment of mixed stands is commonly recommended [2]; therefore, the number of species planted in European forests is increasing. Besides non-native tree species, native but scattered species have also received more interest for their use in afforestation. The sourcing of sufficient FRM of these species is often seen as a problem, as efforts for the establishment of seed stands and seed orchards have concentrated on the economically most important tree species, and seed collection in natural stands is often complicated by the scattered occurrence of these species [3,4].
Norway maple (Acer platanoides L.) is a widespread forest tree species in Central and Northern Europe but with a scattered natural occurrence. On the other hand, it is commonly planted as an ornamental tree due to its tolerance of urban conditions and colorful fall foliage; indeed, it is naturalizing in ruderal places in urban areas. In the forest, it is a fast-growing species in its youth and the wood can be used for furniture, marquetry, and even musical instruments. It thrives best in deep, fertile soils but often also occurs in groves and on dry rocky slopes, together with beech, lime, ash, elm and other valuable hardwoods [5]. In Central Europe it can be found up to an elevation of around 800 m. The species is monoecious and outcrossing with prevalent pollination by insects [6]. Seeds are winged samaras and effectively dispersed by light winds.
In the debate on climate-driven selection of species in the forest, Norway maple has recently received raised interest in Central Europe because of its higher drought resistance compared to sycamore maple [7,8] (the latter has been used for afforestation extensively). Therefore, it is an interesting species for highly productive sites where other native tree species have become devastated by pathogens (e.g., elm, ash). In Austria, despite the rising demand for Norway maple saplings, there is only very little domestic FRM available (on average, more than 95% of saplings are imported from neighboring countries; I. Strohschneider, Federal Forest Office, pers. comm.). Currently, there are only two registered seeds stands of Norway maple in Austria (only one was operational at the time of sampling for this study). The relatively high effort to collect seeds in the forest, coupled with the comparatively low retail value of the seeds, as well as the modest demand in the past has led to the predominant import of reproductive material from foreign sources by nurseries. However, import of material without knowledge of the population subdivision of the respective species may result in the use of maladapted sources and/or of material with low genetic diversity. This could have severe and long-term negative effects on the local populations of scattered tree species through gene flow (genetic pollution and “swamping” [9]). All these warrant efforts to use FRM from regional sources and conservation of the native genepool in situ (gene conservation units) and ex situ in seed orchards. The latter can in turn be used to produce sufficient amounts of reproductive material for afforestation. The conservation of the gene pool of scattered forest tree species is an important goal demanded by the European Union [10,11] and is fostered by the EUFORGEN network [4,11,12].
While there have been reports on a number of effects of artificial regeneration on the genetic makeup of the resulting stands, e.g., that the genetic structure is changing between years and the harvested area in seed stands [13,14,15,16,17,18], surprisingly few studies (but see, e.g., [19,20]) have scrutinized the genetic diversity of forest reproductive material actually used in afforestation, though this can have a large scale, direct and severe practical impact on the performance, sustainability, and future adaptability of forests to the future climate. In Austria, comparatively strict rules for the collection of seeds for the production of FRM are in place for the main tree species in accordance with EU Directive 1999/105/EC and based on the Austrian Act on Forest Reproductive Material (FoVG 2003; similar to the legislation existing in Germany and many other European countries). For the category “selected” in the main (economically most important species, e.g., Norway spruce, oaks, etc.) tree species seeds from at least 20 mother trees need to be collected from selected stands that hold at least 50 mature trees and are of a specified minimum size. In the secondary tree species (which includes maples, lime, ash, etc.) rules are relaxed and only 20 trees are needed in the respective stand and seeds from only 10 mother trees need to be harvested. In these stands, a governmental expert has to check the quality and vigor of the trees to issue a seed stand certificate; although, in the category “source identified” (basically developed for the secondary tree species), only 10 trees need to be harvested and an expert check of the stand is not required. In Austria, “source identified” is deemed sufficient in the case that no selected seeds stands are available for the respective species (i.e., as in A. platanoides in most regions of Austria). In rare tree species, which are not included in the respective law on FRM, no rules exist at all for seed collection (e.g., Sorbus, Taxus).
Mostly, this negligence of the importance for using seed sources of high quality and diversity in the secondary tree species stems from their relative unimportance in economic terms, but probably also from the fact that negative effects of inbreeding are less evident but also understudied in hardwood species (but see [21]). In comparison, there is a large body of evidence available which shows the negative effect of inbreeding in stand forming conifers both during embryo development as well as in reduced growth of the resulting offspring [22,23,24,25,26,27,28,29]. Indeed, the effects of using FRM of low genetic diversity are not as conspicuous in hardwoods as they are in conifers, probably due to milder levels of inbreeding depression in species adapted to scattered occurrence [30], although the long-term consequences are expected to be detrimental [31,32,33,34]. Low levels of genetic diversity and increased inbreeding within populations are recognized signatures of landscape fragmentation [35,36] and low genetic diversity via inbreeding and genetic drift ultimately will lead to species extinction [37]. Although longevity and large gene dispersal distances can buffer the effects of fragmentation in some tree species [38,39], empirical evidence shows that in many situations negative effects are evident [40,41]. Since tree species differ in their sensitivity to fragmentation, it is important to investigate the respective gene dispersal and reproductive system to choose the optimal management technique for long-term conservation of forest genetic resources. Currently, ex situ and in situ measures are proposed in the form of seed orchards or gene conservation units, respectively (e.g., [12]).
Comparatively little is known on the genetic differentiation and population history of A. platanoides in Europe despite its wide occurrence across Europe. Postglacial recolonization patterns have been hypothesized to be similar to A. pseudoplatanus [42,43] and many other species e.g., [44] with putative refugia in the Mediterranean and remigration routes west and east of the Alps [5,45], but detailed palynological evidence is scarce due to low durability of its pollen and because Acer pollen cannot be differentiated at the species level; large scale genetic studies so far have not been conducted in the species. Rusanen, Vakkari & Blom [46] showed that genetic diversity based on allozymes was comparatively low in the Finnish populations (HE = 0.128); when analyzing also populations from central Europe [47] HE was almost identical with 0.132; a low value compared to the average of other woody species (HE = 0.149) or the mean value for angiosperms in general (He = 0.183) [38] and other European forest tree species [47]. However, genetic diversity was similar to A. saccharum populations studied in North America [48,49]. Population differentiation within Finland (FST = 0.099) was almost three times higher than in the wind pollinated Betula pendula (FST = 0.032) [46,47]. Despite the high differentiation between populations, no geographical pattern of diversity was discernible; therefore, the Finnish populations seem to follow a metapopulation dynamic, with small, isolated populations that exchange migrants but also local extinction and re-migration events. Similarly, no clear population structuring was also discernible when a larger sample including populations from Central Europe was analyzed [47]. To our knowledge, no provenance trials have been set up to investigate functional trait differentiation in the species.
The primary aim of this study was to investigate the population structure of Norway maple in Austria to lay the basis for the establishment of respective ex situ seed orchards and clonal archives, but also for the identification of stands of the species suitable for seed collection and for the selection of in situ gene reserve forests [50,51]. To achieve this, population samples were collected from all areas of the species’ occurrence in Austria. In addition to the Austrian samples, populations from other countries (Bosnia and Herzegovina, Finland, Estonia) were included to shed further light on the population structure within Europe. Further, it was also our aim to investigate the genetic impact of current afforestation practices in the species, i.e., to scrutinize genetic diversity in established plantings, in the only seed stand available at the time of the study, and to exemplarily investigate the genetic diversity of the FRM traded within and imported to Austria, respectively. To achieve this, not only the genetic diversity but particularly the family structure within the studied populations and traded FRM were analyzed.

2. Materials and Methods

2.1. Populations Sampled

Cambium (approx. 2 cm circular disks taken at the stem base), or leaf samples were obtained in 2019 from 756 individuals originating from 27 (putatively) natural populations of A. platanoides covering a major part of its geographical range in Austria (Table 1). GPS coordinates, diameter at breast height (dbh), height and stem form for each sampled tree were recorded to facilitate selection of plus trees for the projected seed orchards. A minimum distance of 20 m between the trees was kept and only trees of dbh higher than 20 cm were collected. Most of the populations were sampled in sites registered in the Austrian forest reserve scheme (http://www.naturwaldreservate.at, accessed on 1 March 2022), thus had been naturally regenerated (planting of A. platanoides was very uncommon until ca. 30 years ago). Samples were also taken from the only registered seed stand at the time of sampling of the species in Austria (population 28), which was indeed planted ca. 50 years ago with material from an unknown origin (H.J. Damm, pers. comm.); another planted stand in Carinthia (pop. 25, 10 years old) was also sampled, again the origin was not traceable. Population 30 (mature trees) was also special as it was sampled in an isolated semi-urban location near an old castle. In addition, samples from five batches of seedlings obtained from commercial forest nurseries were added to the sample pool. These consisted of 25 saplings putatively derived from the only available seed stand in Austria (pop. 28), as well as two batches each of German and Hungarian plant lots (25 samples each), respectively. As an outgroup, and to obtain new insights into the large-scale population structure at the European level, two populations from Bosnia and Herzegovina and one population each from Estonia and Finland, respectively, were also included in the study (Table 1). Samples were dried and stored in silica gel until DNA extraction.

2.2. Marker Development and Genotyping

Since no specific markers were available for A. platanoides, novel nuclear microsatellite markers were developed within the study by a commercial provider (Ecogenics, Balgach, Switzerland). The pooled DNA from seven individuals collected near Vienna was used for marker development. The Illumina TruSeq nano library was analyzed on an Illumina MiSeq sequencing platform using a nano v2 500 cycles sequencing chip. The resulting paired-end reads, which passed Illumina’s chastity filter, were subject to de-multiplexing and trimming of Illumina adaptor residuals. Subsequently, the quality of the surviving reads was checked with the software FastQC v0.117 [52]. In a next step, the paired-end reads were merged with the software USEARCH v10.0.240 to in silico reform the sequenced molecule. The resulting merged reads were screened with the software Tandem Repeats Finder, v4.09. After this process, 7618 merged reads contained a microsatellite insert with a tetra- or a trinucleotide of at least 6 repeat units or a dinucleotide of at least 10 repeat units. Primer design was performed with primer 3. Suitable primer design was possible in 4590 microsatellite candidates. Eventually, 15 microsatellite markers were selected based on the number of alleles and reliability for genotyping.
For consecutive genotyping of all sampled individuals, DNA was extracted using the Qiagen DNeasy 96 Plant kit following the manufacturer’s protocol. The 15 microsatellite markers were split into three mixes (forward primers were labelled using ABI technology) and PCR was performed using the Solis Biodyne 5× Hot FIREPol Multiplex Mix. For PCR before the first cycle, a prolonged denaturation step (95 °C for 12 min) was included followed by 35 cycles of 95 °C for 20 s, 60 °C for 50 s, and 72 °C for 120 s. The last cycle was a 5 min extension at 72 °C. Fragment analysis was performed on an Applied Biosystems 3730XL DNA Analyzer, using a Size Standard GeneScan LIZ500 excluding 250 bp (Applied Biosystems). Allele scoring was performed automatically with visual inspection of allele calling. Cross species amplification of the 15 obtained microsatellite markers was tested in a sample of 19 Acer species. Genotypic disequilibrium, deviation from HWE, and occurrence of null alleles was estimated with GENEPOP 4.0 [53]. The power of the newly developed markers for paternity analysis was checked in CERVUS [54].

2.3. Data Analysis

Standard genetic diversity indices were calculated using GenAlEx 6.503 [55,56]. Allelic richness was calculated by rarefaction for a standardized population size of 11 individuals using ADZE v.1.0 [57] and F-statistics were computed in FSTAT [58]. Individual population assignment was performed in STRUCTURE v2.3.4 [59] to detect population clusters. Analysis was performed with all 1048 successfully genotyped individuals using the admixture model with 200,000 repetitions as burn-in followed by 800,000 for the full run. Runs were performed from K = 1 to 25 with 5 iterations per run. PHYLIP v3.6.8 (using the NEIGHBOR program; [60]) was used to construct a UPGMA tree of populations based on Nei’s Standard genetic distance calculated in GenAlEx.
The presence of recent changes in population size, based on estimates of multi-locus genotypes, was tested using the software BOTTLENECK v1.2.02 [61], implementing a Wilcoxon signed rank test and assuming the infinite alleles model. The mean relatedness within the population samples was estimated using the Queller & Goodnight [62] and Lynch & Ritland [63] estimators implemented in GenAlex 6.503 [56]. COLONY 2.0.6.6 [64] was used to infer sibship relationships within all sampled entities (sampled populations and sampled lots of reproductive material). The Full-Likelihood-Paired-Likelihood-Score method was used for estimations, with male and female polygamy, and using the inbreeding model. All individuals for each study entity were treated as a single offspring group and runs were performed separately. We used default settings for sibship priors with a medium run length and one thread. Runs were repeated three times using different seeds for random number generation. The best maximum likelihood cluster configuration was used to infer half- and full-sib dyads. COLONY was also used to estimate the current effective breeding size (effective population size) of each sampled population based on the sibship assignment method with the same settings described above. Confidence intervals were obtained by bootstrapping. CERVUS and COLONY were further used for paternity analysis of samples from population 28 and population 29, as the former population was the putative parent stand of population 29.
Isolation by distance was investigated for all natural populations from Austria with the Mantel test [65] and spatial genetic structure analysis (999 permutations each) using GENALEX. Spatial genetic structure was analyzed by plotting correlation graphs of geographic (x axis in kilometers) and genetic distances (y axis log Nei genetic distance). This analysis generates an autocorrelation coefficient r which lies between −1, 1 and is displayed as a correlogram; with the coefficient r related to Moran’s I [55,66,67]. The maximum geographic distance among the samples was divided into ten distance classes of equal size in kilometers. Significant geographic genetic substructures within a distance class were detected when the r value exceeded the upper/lower boundaries of the 95% confidence interval in the correlogram.

3. Results

3.1. Novel Microsatellite Markers

Details on the marker loci used are presented in Table 2. Cross species amplification of the newly developed microsatellite markers in 19 other species of Acer showed considerable amplification and indicated putative polymorphisms in these species also (Supplementary Table 1). There was no evidence for genotypic disequilibrium in the natural populations sampled. However, 4 of the 15 markers (Ap_20237, Ap_361727, Ap_488207, and Ap_658195) consistently showed elevated levels of null alleles in our sample set (Table 2). Although the impact on results was negligible, the analyses reported here were only performed with the remaining 11 microsatellite markers. The number of alleles detected ranged from 5 (Ap_374910) to 24 (Ap_44827). The non-exclusion probability for the combined marker set was very low (4.8 × 10⁻⁷ for the first parent). The typing error rate of the eleven markers used was estimated by running all samples in COLONY and averaged to 0.006.

3.2. Genetic Diversity

Sampling locations of populations used are shown in Figure 1. A total of 1048 individuals were successfully genotyped (samples that had missing data for more than 3 microsatellite loci were omitted). Further details on populations are given in Table 1. The results of the standard genetic diversity indices are shown in Table 3 and deviations from the Hardy-Weinberg equilibrium are depicted as a significant excess or lack of homozygotes (associated to the F-value). Significant deviation from HWE was detected in several populations, all associated with an excess of homozygotes with the exception of population 28, which showed a highly significant excess of heterozygotes. Genetic diversity (He) was 0.72 on average with lower levels in the populations from the western part of Austria; the lowest levels within Austria were the seed stand in population 28 and population 30 (Table 1)—both populations that were heavily affected by human intervention, i.e., they were planted or isolated, respectively. Likewise, these populations also showed below average values for allelic richness. In addition, the northern European populations showed relatively low levels of genetic diversity. A high level of genetic diversity was found in the majority of the Austrian populations, but also, populations from Bosnia and Herzegovina harbored similar levels of variation. A planted stand (pop. 25) and the samples of FRM retrieved from Germany (pops. 31 and 32) and Hungary (pops. 33 and 34) did not show any indication of lower diversity. However, the FRM lot population 29 (putatively derived from population 28) showed the lowest levels of diversity in the whole sample.

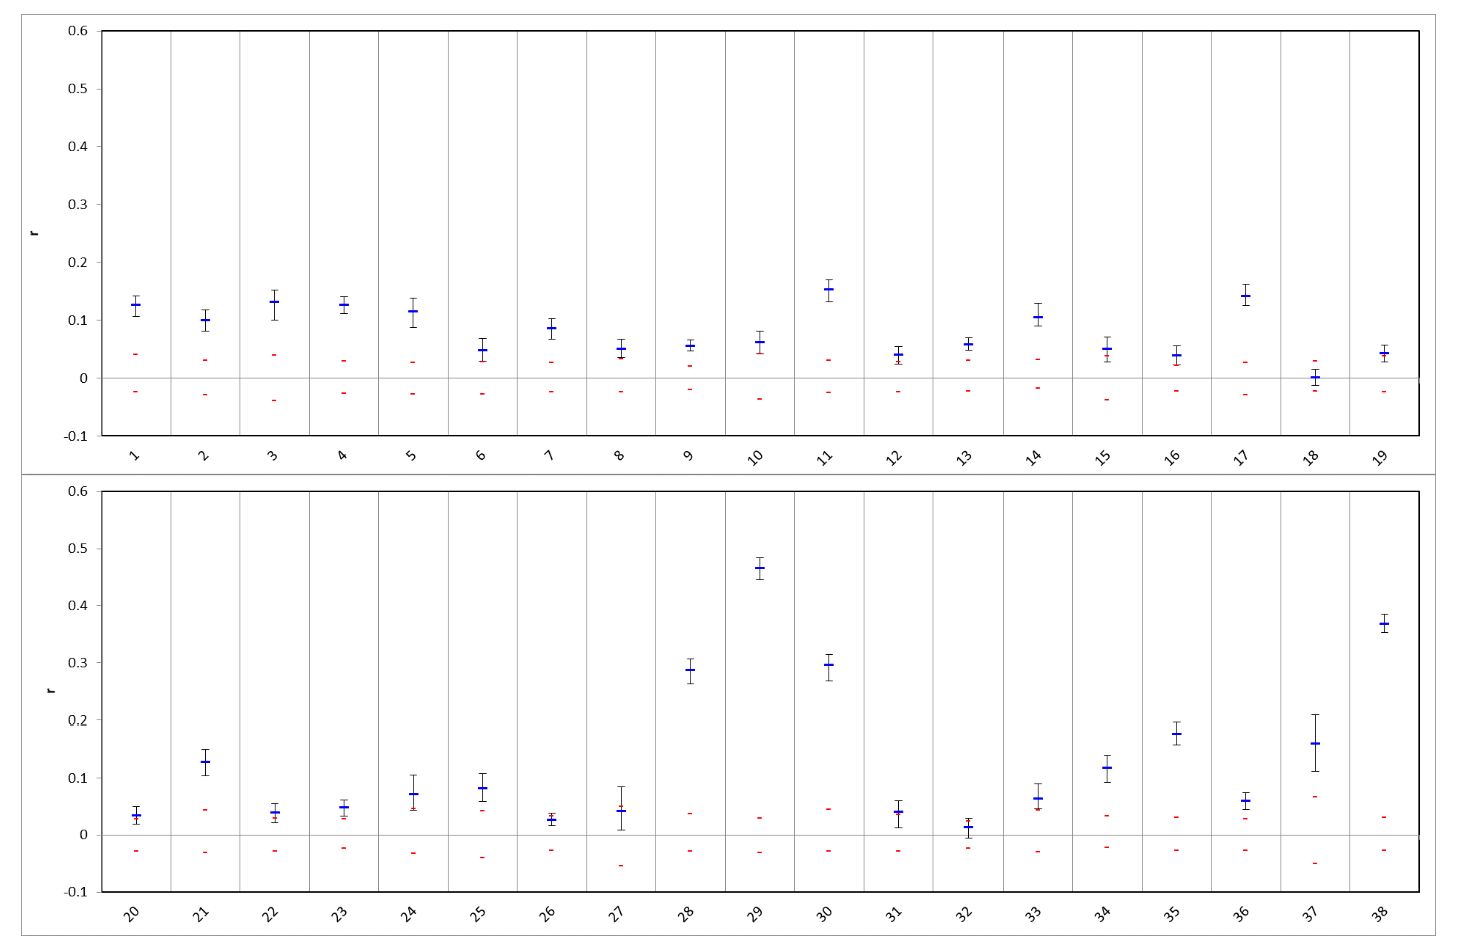
3.3. Population Structure

The overall population structure was relatively low (overall FST = 0.06, within Austria FST = 0.04). Relationships between populations based on Nei’s standard genetic distances are shown in the unrooted UPGMA tree in Figure 2. Most Austrian samples, together with samples from Germany and Hungary, formed an unresolved large branch, while the Austrian sample populations from the west of the country clustered together in a separate branch and populations showing low genetic diversity were clustering on a third main branch (population 28, the associated lot of FRM [pop. 29], the planted stand [pop. 25], population 30, as well as the two northern European populations). Most sampled populations seemed to have experienced a recent reduction in population numbers indicated by the results of the BOTTLENECK analysis (Table 3).
In the STRUCTURE analysis, the true number of K was difficult to resolve as most Austrian populations—probably due to the high number of alleles within the populations—showed an inhomogeneous cluster assignment pattern. For the consecutive interpretation of the data, we used the pattern obtained from K = 8, which gave the biologically most meaningful results. In Figure 3, STRUCTURE results for the individual population assignment are presented as pie charts at the respective sampling locations; individual cluster assignment is shown in Supplementary Figure 1. The STRUCTURE analysis revealed several population clusters within Austria corroborating the results of the UPGMA clustering: a relatively compact cluster of populations from Tyrol and Vorarlberg (the extreme west of Austria) and a less well-defined cluster for most other Austrian populations; the populations with low genetic diversity each formed a strong cluster on their own (pops. 28 and 30). Populations from Finland, and Bosnia and Herzegovina formed strong respective clusters as expected, while the population from Estonia showed a clustering pattern similar to central European populations. The four batches of FRM from Germany and Hungary were mostly not differentiated from the Austrian populations: while the German samples clustered with the Austrian samples, especially population 33 (a seed stand in the western part of Hungary) was forming a rather well-defined cluster. An analysis of IBD and spatial genetic structure was performed for all 756 Austrian samples from 27 natural populations. By plotting Nei’s standard genetic distance vs. geographical distances in the Mantel test a significant IBD pattern was observed (R2 = 0.1961; p < 0.01; Figure 4). A significant result for spatial genetic structure was also obtained in the analysis performed with GenAlex for a distance of up to 45 km (Supplementary Figure S2).

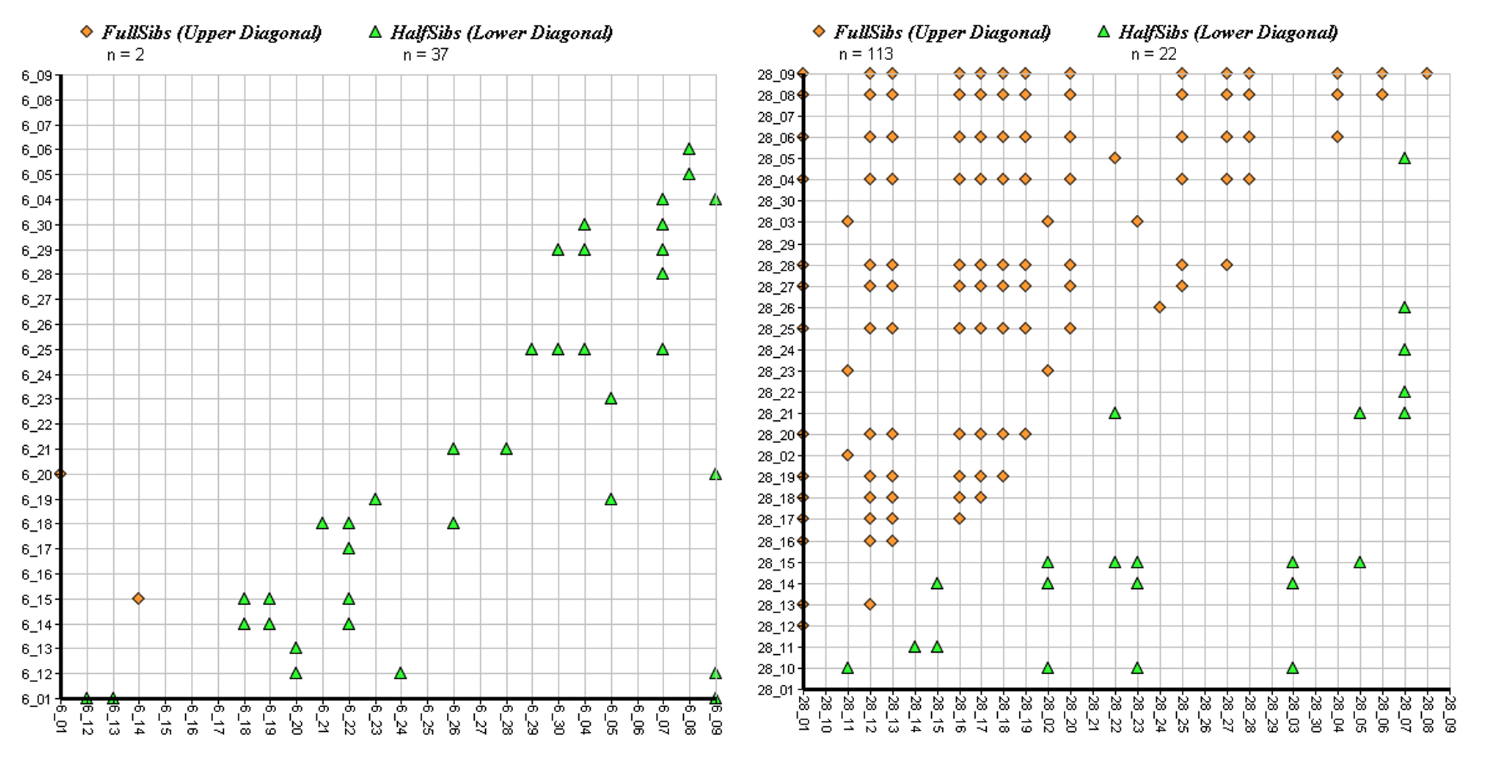
3.4. Sibship Analysis

Results of the sibship analysis are shown in Figure 5 and Figure 6. Although most populations showed some sibship structure with pairwise relatedness coefficients outside of the confidence interval (reflecting the cohort structure in the scattered stands), very high levels of relatedness were evident in population 28 (seed stand). In that planted population, the number of obtained full-sib pairs by far outnumbered the number of inferred half-sibs (Figure 5), giving evidence that genetically very depauperate FRM had been used for the plantation. The highest value of pairwise relatedness was found in the Austrian batch of FRM (pop. 29). Comparatively high levels of pairwise relatedness were also found in a putatively naturally regenerated stand from Carinthia (pop. 30) reflecting the fragmented occurrence of the species in that region. On the other hand, a planted stand in Carinthia (pop. 25) did not show any sign of elevated levels of sibship structure, as did the remaining batches of FRM (pops. 31, 32 and 33) with the exception of population 34. The Finnish population also showed high levels of sibship structure, which was not unexpected, as demonstrably it is derived from only 9 mother trees [46]. Estimated numbers of effective population size NE were lowest in the populations most affected by human intervention (Table 3). CERVUS as well as COLONY paternity analyses did not support the assumption that the sampled offspring batch from Austria was derived from the seed stand population 28 as indeed no parent from the sampled individuals was assigned, indicating a possible labelling error in the nursery (although the density of the trees in that seed stand is high and it is theoretically possible that none of the sampled trees were involved in the respective mating events). This was also in agreement with the results of STRUCTURE and the UPGMA clustering where, in both cases, the two populations/samples were strongly differentiated and showed similarity only in having low levels of genetic diversity.

4. Discussion

Genetic diversity in forest tree species has been recognized as the cornerstone of species adaptation to changing environments and the long-term survival of species [68]. The conservation and sustainable management of forest genetic resources, therefore, is an important task in modern forestry [4]. Although the conservation of genetic diversity in common stand forming species is relatively easily achieved in practical management (selection of a sufficient number of unrelated seed trees [69]), species with scattered distribution or fragmented occurrence can be seriously affected by anthropogenic influence on pollen and seed dispersal [34].
In this study, we used 15 newly developed microsatellites to genotype 756 samples from 27 putatively natural populations in Austria and 292 samples from two planted stands (one of them used also as a seed stand), other European populations and/or material traded by commercial nurseries (Table 1). Eleven of the newly developed markers proved to be highly reliable (average genotyping error 0.6%). These markers are available for further investigations into the population genetics and mating system of Norway maple. Cross species amplification of the new markers was tested in 19 Acer species from around the world (Supplementary Table 1). Several of the markers were amplified in different species and might also be helpful in studies of other Acer species.
Most natural populations studied here had a similar level of genetic diversity (average HE = 0.708), comparable to other tree species with scattered occurrence studied with similar markers (e.g., Prunus avium, 0.045–0.831 [70], Sorbus-domestica, 0.574 [71], Sorbus torminalis 0.796 [51]). Population differentiation within Austria was comparatively low (FST = 0.04) and the overall population differentiation between all populations studied (FST = 0.06) was in the lower range commonly observed in scattered tree species [72], but in good agreement with, e.g., values obtained for Sorbus torminalis in Southern Germany [51] at a similar geographical scale.
Our data are somewhat conflicting with the results of Rusanen, et al. [47] who sampled 12 populations of A. platanoides in Europe, including two populations from Western Germany and one from Poland, with the remainder of the samples coming from Northern Europe. In their study based on isozyme analysis, they detected an FST of 0.099 for the whole sample, but only an FST of 0.067 within Scandinavia and an FST of 0.124 for the populations from Germany and Poland; indeed, our data corroborate this finding in showing that proximal populations can also be highly differentiated, when the founding population was small (which was not studied by Rusanen, et al. [47]). Overall, however, we have found low population differentiation among most natural populations corroborating earlier findings by Rusanen, et al. [47]. Since we have sampled here in a smaller region in Central Europe, fragmentation seems, indeed, to be less important than in the northern countries, where populations represent the leading edge of the distribution, probably with a more developed metapopulation structure and lower population density. A very similar pattern at the eastern distribution margin of A. platanoides has also been recently detected by Akhmetov, et al. [73] analyzing Russian populations using ISSR markers. This pattern is congruent with Norway maple being a potent colonizer in many forest disturbance situations, capable of quickly establishing relatively large local populations.
In the STRUCTURE analysis (Figure 3, Supplementary Figure S1) populations from Bosnia and Herzegovina, and Finland were strongly differentiated from the samples collected in and around Austria, while the population from Estonia was closer to the Central European populations. One Bosnian population showed the highest value of allelic richness, but the second population also seemed to be affected from fragmentation and inbreeding to some extent (Table 3). Both samples from Germany were derived from Baden-Württemberg (ca. 500 km distance to Lower Austria, where the FRM was to be planted) and showed virtually no differentiation from the Austrian gene pool; likewise, both samples of FRM from Hungary were clustering very close with the Austrian samples. This might be taken as an indication that there is a single pre-Alpine region population for Norway maple in Central Europe and that migration and genetic exchange within this gene pool has been common in the not-too-distant past. Recolonization of maples into Central and Northern Europe putatively has happened early, as the species was among the first postglacial-colonizing species [74,75]. The pattern of population structure in Norway maple in the pre-Alpine area appears to be similar to the one detected, for example, in Norway spruce in Scandinavia [76], indicating an initial widespread occurrence with consecutive fragmentation. Of course, further sampling in Central Europe and other parts of the species’ range would be important to gain detailed insights into the population history and the postglacial re-immigration patterns of this species. The strong differentiation of the Bosnian sample from Central European populations does not support the hypothesis that refugia in the Balkan might have played a role in the recolonization in Central Europe, other than probably in A. pseudoplatanus (as discussed in Neophytou, et al. [43]).
A consistent and clear pattern of west–east differentiation of genetic diversity was observed within Austria. The observed differentiation between eastern and western Austrian populations seems to be less the result of recent founder effects as only milder levels of sibship structure were found in the latter population group. Here probably a long-lasting differentiation has taken place and/or a different mode of postglacial recolonization is underlying. A strong isolation by distance pattern (Figure 4, Supplementary Figure S2) was evident in the Austrian population, showing an impact of colonization over a metapopulation dynamic still. It remains to be tested in the future if the differentiation of the western cluster has also resulted in local adaptation of populations to higher elevation and/or a colder temperature regime. No information on local adaptation can be derived from neutral markers, thus, the transfer of FRM between areas cannot be recommended based on our results. It also needs to be taken into account that the samples from Germany and Hungary were all derived from commercial FRM and might not fully represent the gene pool of the respective areas. In addition, as said before, further sampling in natural populations would be needed to obtain a deeper insight into the populations’ relationship. Nevertheless, it is warranted to take the west–east differentiation detected within Austria into account for future gene conservation and afforestation efforts.
Most analyzed populations have indeed suffered from recent bottlenecks as evidenced by results from the respective analysis and the relatedness analyses within populations. Sibship analysis revealed that founder effects (small populations with high levels of sibship structure) are probably causing the extent and strong differentiation detected in a subsection of the populations. High levels of relatedness were also detected in populations from North-Eastern Europe (pops. 37 and 38), partially reflecting the natural processes at the leading edge of the species’ distribution. The population from Finland demonstrably is derived from only 9 mother trees and has increased to approx. 50 individuals [46], thus, the observed level of pairwise relatedness and small effective population size is not surprising. Because the species is rare in that region, the stand still serves as a gene conservation unit. For future management, it may be an option to plant additional trees from other regional sources (enrichment planting) to increase the long-term adaptability and the value of the stand as a gene reserve.
Our findings also provide evidence for the effect of human intervention on natural populations through fragmentation and/or the establishment of local populations by genetically depauperate plantations in Austria. This provides evidence for the endangered genetic diversity in the species, highlighting the need for careful selection of future seed sources of high genetic diversity. Although in most natural populations the level of relatedness within populations was already elevated, extraordinary levels of pairwise relatedness were detected in putatively natural but isolated populations (e.g., pop. 30), but especially in a planted population (28), and in a plant lot obtained from a nursery (pop. 29). On the other hand, samples from the remaining sources of reproductive material imported to Austria (pops. 31, 32 and 33) and the planted stand in Carinthia (pop. 25) showed a sibship structure similar to the natural populations.
Therefore, the use of (foreign) FRM cannot be regarded negatively per se since seed sources with similar genetic background as the local one had been used. The estimation of the effective population size was best at detecting anthropogenic effects on the genetic make-up of managed forests, as the lowest values were always found in planted stands and commercial plant lots. The impact of planting FRM from maladapted sources or of low genetic diversity must also not be over-regarded when only low numbers of plants are introduced, as not all planted trees will become mature enough for fructification; however, long-term effects could occur if the introduced material outnumbers the local population (“genetic swamping” [9]). Care should be taken in choosing stands for seed collection; planted stands with an unknown genetic background should be avoided as exemplified by the single seed harvest stand registered in Austria (at the time of sampling), which showed egregious levels of sibship structure. At the same time, our data strongly suggest that reproductive material (pop. 29) putatively derived from population 28 was, in fact, not sourced from this stand, also indicating that the implementation of a genetic certification scheme to track the identity of seed lots is needed to prevent mislabeling of FRM (already in place in Germany [12,16]).
In Austria, the tradition of artificially propagating and growing secondary or rare tree species in nurseries on a large scale is relatively recent and started only around 30 years ago. Different legal regulations are in place for scattered tree species: there are only a few registered seed stands and most harvesting (if domestic harvests are perfomed at all) is under the label “origin secured”, which has much fewer preconditions to fulfill compared to the harvest of “selected” seed sources (i.e., seed stands). In addition, the number of trees needed to be harvested is only half of the number needed for the main tree species (i.e., 10 vs. 20 mother trees, respectively). Blanc-Jolivet & Degen [69] have shown that 25 mother trees are indeed necessary to transfer 90% of the genetic diversity within the seed stand to the next generation, indicating that the current legislation is not sufficient to sustainably maintain the long-term genetic diversity of most tree species. Since the market with these species has been small, for cost reasons and to minimize growing risks, many nurseries have resumed buying their stock in neighboring countries. The results of this study on Norway maple have also had an impact on the practical conservation of forest genetic resources in other species, as the patterns of low genetic diversity in forest reproductive material found in this study, may be repeated in other scattered tree species, e.g., elm, lime, ash, alder, and cherry. Harvesting a sufficient number of mother trees (with proper spacing) is, therefore, strongly advised; alternatively, the installation of seed orchards is an excellent option to preserve diversity, and provide proper FRM with efficient effort in the scattered tree species when a sufficient number of clones are used [4]. A future application of the results of this study will be the establishment of seed orchards with a high number of clones, to facilitate the harvesting of seed material of local provenance and high genetic diversity.
Genetic monitoring has been suggested [17] to detect changes in the genetic diversity of forest tree species and to inform forest managers of negative changes to instigate adaptation of respective management plans, subsidies programs, and legislation. A genetic monitoring scheme should always include the analysis of sibship structures within the studied stands and respective offspring, as exemplified in this study. This approach could further be extended in a way to analyze a larger number of managed stands to detect population genetic effects of ‘common’ management to inform the development of future best practice guidelines. The analysis of genetic diversity, at least in seed stands of scattered tree species, to avoid seed collection in genetically depauperate populations should be a standard procedure, and is already done, e.g., in Bavaria [51].
Norway maple recently has become affected by the fungus Cryptostroma corticale, which particularly seems to affect trees on sub-optimal sites, e.g., sites with compacted soils and low humidity [77]. To select resistant genotypes, it will be necessary to take any precaution to keep the level of genetic diversity high in the species. The establishment of provenance trials to evaluate the performance of different regions in the field will provide evidence about non-neutral genetic variation and resistance to Cryptostroma infection. Further, it would be interesting to test the hypothesis that genetic diversity of stands is correlated to disease susceptibility.

5. Conclusions

In this study, we investigated the natural population structure and genetic diversity within populations, and specifically the relatedness of individuals within populations, of Norway maple in Austria. Our data support the scenario of relatively recent fragmentation of previously connected populations. Future investigations are needed to assess the impact of this fragmentation on the fitness of the offspring. In the long term, negative effects are probably unavoidable if no counteraction is performed [34].
The selection of genotypes based on the results of this paper will be used to set up a clonal archive for future ex situ conservation measures, an important first step to conserve the gene pool of Norway maple in Austria. The design and management of seed orchards to achieve high outcrossing rates is an important step towards conservation of FGR in Norway maple. In this study, we have provided important information on which trees to select for seed orchard establishment and which populations are apt for collection of FRM.
The results obtained in this study show that, in the future, the current regulations concerning the seed harvest need to be strictly implemented or extended, to maintain the high level of genetic diversity currently found in the natural populations of Norway maple. Most of the analyzed FRM had elevated levels of sibship structure compared to natural populations; this may not be highly detrimental per se and cannot be totally avoided. Legislation and implementation on the ground should ensure that the FRM provided to forest owners has a sufficient amount of genetic diversity. It is advisable to check any population to be used for seed collection via the use of genetic markers [51].

Supplementary Materials

The following supporting information can be downloaded at: https://www.mdpi.com/article/10.3390/f13040552/s1, Figure S1: STRUCTURE results for individual cluster assignment. Figure S2: Spatial genetic structure analysis; Table S1: Cross species amplification of the newly developed microsatellite markers in 19 other species of Acer.

Author Contributions

Conceptualization, H.K.; methodology, D.L. and H.K.; formal analysis, D.L. and H.K.; sampling, D.L. and S.P.; writing—original draft preparation, D.L., H.K., J.-P.G., M.R., D.B. and S.P.; writing—review and editing, D.L. and H.K.; supervision, H.K.; project administration, H.K.; funding acquisition, H.K. All authors have read and agreed to the published version of the manuscript.

Funding

The creation of the analyzed data was supported by the Austrian federal government, the federal provinces and the European Union (project: APPLAUS, grant number 8.5.2 III4 02/18).

Data Availability Statement

Raw genotyped data was submitted to Figshare and is available at the following link: https://doi.org/10.6084/m9.figshare.19322303.v1 (accessed on 1 March 2022).

Acknowledgments

We would like to acknowledge Thomas Geburek, Wilfried Nebenführ, Gerald Golesch, Thomas Thalmayr, Georg Frank, Herfried Steiner, Thomas Brandner, Laszlo Nagy, all forest owners, and Hans Jörg Damm for their support.

Conflicts of Interest

The authors declare no conflict of interest. The funders had no role in the design of the study; in the collection, analyses, or interpretation of data; in the writing of the manuscript, or in the decision to publish the results.

References

  1. Liang, J.; Crowther, T.W.; Picard, N.; Wiser, S.; Zhou, M.; Alberti, G.; Schulze, E.D.; McGuire, A.D.; Bozzato, F.; Pretzsch, H.; et al. Positive biodiversity-productivity relationship predominant in global forests. Science 2016, 354, aaf8957. [Google Scholar] [CrossRef] [PubMed] [Green Version]
  2. Hemery, G.E.; Clark, J.R.; Aldinger, E.; Claessens, H.; Malvolti, M.E.; O’connor, E.; Raftoyannis, Y.; Savill, P.S.; Brus, R. Growing scattered broadleaved tree species in Europe in a changing climate: A review of risks and opportunities. Forestry 2010, 83, 65–81. [Google Scholar] [CrossRef] [Green Version]
  3. Jalonen, R.; Valette, M.; Boshier, D.; Duminil, J.; Thomas, E. Forest and landscape restoration severely constrained by a lack of attention to the quantity and quality of tree seed: Insights from a global survey. Conserv. Lett. 2018, 11, e12424. [Google Scholar] [CrossRef]
  4. Gömöry, D.; Himanen, K.; Tollefsrud, M.M.; Uggla, C.; Kraigher, H.; Alizoti, P.; Frank, A.; Proschowsky, G.F.; Geburek, T.; Guibert, M.; et al. Genetic Aspects Linked to Production and Use of Forest Reproductive Material (FRM); European Forest Genetic Resources Programme (EUFORGEN); European Forest Institute: Barcelona, Spain, 2021; 216p. [Google Scholar]
  5. Roloff, A.; Pietzarka, U. Acer platanoides Linne 1753. In Enzyklopädie der Holzgewächse: Handbuch und Atlas der Dendrologie; Wiley-VCH Verlag GmbH & Co.: Weinheim, Germany, 1998; p. 16. [Google Scholar]
  6. Renner, S.S.; Beenken, L.; Grimm, G.W.; Kocyan, A.; Ricklefs, R.E. The evolution of dioecy, heterodichogamy, and labile sex expression in Acer. Evol. 2007, 61, 2701–2719. [Google Scholar] [CrossRef]
  7. Kunz, J.; Räder, A.; Bauhus, J. Effects of drought and rewetting on growth and gas exchange of minor European broadleaved tree species. Forests 2016, 7, 239. [Google Scholar] [CrossRef]
  8. Carón, M.M.; De Frenne, P.; Brunet, J.; Chabrerie, O.; Cousins, S.A.O.; De Backer, L.; Decocq, G.; Diekmann, M.; Heinken, T.; Kolb, A.; et al. Interacting effects of warming and drought on regeneration and early growth of Acer pseudoplatanus and A. platanoides. Plant Biol. 2015, 17, 52–62. [Google Scholar] [CrossRef]
  9. Lefèvre, F. Human impacts on forest genetic resources in the temperate zone: An updated review. For. Ecol. Manag. 2004, 197, 257–271. [Google Scholar] [CrossRef]
  10. Lefèvre, F.; Koskela, J.; Hubert, J.; Kraigher, H.; Longauer, R.; Olrik, D.C.; Schüler, S.; Bozzano, M.; Alizoti, P.; Bakys, R.; et al. Dynamic Conservation of Forest Genetic Resources in 33 European Countries. Conserv. Biol. 2013, 27, 373–384. [Google Scholar] [CrossRef]
  11. Palmberg-Lerche, C.; Turok, J.; Sigaud, P. Forest genetic resources in the international context: Processes, agreements and programmes. In Conservation and Management of Forest Genetic Resources in Europe; Geburek, T., Turok, J., Eds.; Arbora: Zvolen, Slovakia, 2005; pp. 45–73. [Google Scholar]
  12. Konnert, M.; Fady, B.; Gömöry, D.; A’Hara, S.; Wolter, F.; Ducci, F.; Koskela, J.; Bozzano, M.; Maaten, T.; Kowalczyk, J. Use and Transfer of Forest Reproductive Material: In Europe in the Context of Climate Change; Bioversity International, Ed.; Bioversity International: Rome, Italy, 2015; ISBN 9789292550318. [Google Scholar]
  13. Streiff, R.; Labbe, T.; Bacilieri, R.; Steinkellner, H.; Glössl, J.; Kremer, A. Within-population genetic structure in Quercus robur L. and Quercus petraea (Matt.) Liebl. assessed with isozymes and microsatellites. Mol. Ecol. 1998, 7, 317–328. [Google Scholar] [CrossRef]
  14. Hosius, B.; Leinemann, L.; Bergmann, F.; Maurer, W.D.; Tabel, U. Genetische Untersuchungen zu Famielienstrukturen und zur Zwieselbildung in Buchenbeständen. Forst Holz 2003, 58, 51–54. [Google Scholar]
  15. Leonardi, S.; Raddi, S.; Borghetti, M. Spatial autocorrelation of allozyme traits in a Norway spruce (Picea abies) population. Can. J. For. Res. 1996, 26, 63–71. [Google Scholar] [CrossRef]
  16. Hosius, B.; Leinemann, L.; Konnert, M.; Bergmann, F. Genetic aspects of forestry in the Central Europe. Eur. J. For. Res. 2006, 125, 407–417. [Google Scholar] [CrossRef]
  17. Kavaliauskas, D.; Fussi, B.; Westergren, M.; Aravanopoulos, F.; Finzgar, D.; Baier, R.; Alizoti, P.; Bozic, G.; Avramidou, E.; Konnert, M.; et al. The interplay between forest management practices, genetic monitoring, and other long-term monitoring systems. Forests 2018, 9, 133. [Google Scholar] [CrossRef] [Green Version]
  18. Ziehe, M.; Hattemer, H.H. Auswirkungen räumlicher Verteilungen genetischer Varianten in Buchenbeständen auf dort geerntetes Saatgut. In Mitteilungen aus der Forschungsanstalt für Waldökologie und Forstwirtschaft Rheinland-Pfalz; FAWF: Gwynedd, Wales, 2004; pp. 102–120. [Google Scholar]
  19. Wojacki, J.; Eusemann, P.; Ahnert, D.; Pakull, B.; Liesebach, H. Genetic diversity in seeds produced in artificial Douglas-fir (Pseudotsuga menziesii) stands of different size. For. Ecol. Manag. 2019, 438, 18–24. [Google Scholar] [CrossRef]
  20. Westergren, M.; Bozic, G.; Kraigher, H. Trends in forest seed and seedling production in Slovenia. Gozdarski Vestn. 2017, 75, 184–191. [Google Scholar]
  21. Nickolas, H.; Harrison, P.A.; Tilyard, P.; Vaillancourt, R.E.; Potts, B.M. Inbreeding depression and differential maladaptation shape the fitness trajectory of two co-occurring Eucalyptus species. Ann. For. Sci. 2019, 76, 10. [Google Scholar] [CrossRef] [Green Version]
  22. Woods, J.H.; Heaman, J.C. Effect of different inbreeding levels on filled seed production in Douglas-fir. Can. J. For. Res. 1989, 19, 54–59. [Google Scholar] [CrossRef]
  23. Griffin, A.R.; Lindgren, D. Effect of inbreeding on production of filled seed in Pinus radiata—Experimental results and a model of gene action. Theor. Appl. Genet. 1985, 71, 334–343. [Google Scholar] [CrossRef]
  24. Kormuták, A.; Lindgren, D. Mating system and empty seeds in silver fir (Abies alba mill.). Int. J. For. Genet. 1997, 3, 231–235. [Google Scholar]
  25. Kärkkäinen, K.; Savolainen, O. The degree of early inbreeding depression determines the selfing rate at the seed stage: Model and results from Pinus sylvestris (scots pine). Heredity 1993, 71, 160–166. [Google Scholar] [CrossRef]
  26. Mimura, M.; Aitken, S.N. Increased selfing and decreased effective pollen donor number in peripheral relative to central populations in Picea sitchensis (Pinaceae). Am. J. Bot. 2007, 94, 991–998. [Google Scholar] [CrossRef] [PubMed]
  27. Robledo-Arnuncio, J.J.; Alía, R.; Gil, L. Increased selfing and correlated paternity in a small population of a predominantly outcrossing conifer, Pinus sylvestris. Mol. Ecol. 2004, 13, 2567–2577. [Google Scholar] [CrossRef] [PubMed]
  28. Sorensen, F.C.; Miles, R.S. Inbreeding depression in height, height growth, and survival of Douglas-fir, ponderosa pine, and noble fir to 10 years of age. For. Sci. 1982, 28, 283–292. [Google Scholar] [CrossRef]
  29. Doerksen, T.K.; Bousquet, J.; Beaulieu, J. Inbreeding depression in intra-provenance crosses driven by founder relatedness in white spruce. Tree Genet. Genomes 2014, 10, 203–212. [Google Scholar] [CrossRef]
  30. Lobo, J.A.; Jimenez, D.; Solis-Hernandez, W.; Fuchs, E.J. Lack of early inbreeding depression and distribution of selfing rates in the neotropical emergent tree Ceiba pentandra: Assessment from several reproductive events. Am. J. Bot. 2015, 102, 983–991. [Google Scholar] [CrossRef] [Green Version]
  31. Crnokrak, P.; Barrett, S.C.H. Perspective: Purging the genetic load: A review of the experimental evidence. Evolution 2002, 56, 2347–2358. [Google Scholar] [CrossRef]
  32. Charlesworth, D.; Willis, J.H. The genetics of inbreeding depression. Nat. Rev. Genet. 2009, 10, 783–796. [Google Scholar] [CrossRef]
  33. Losdat, S.; Chang, S.M.; Reid, J.M. Inbreeding depression in male gametic performance. J. Evol. Biol. 2014, 27, 992–1011. [Google Scholar] [CrossRef]
  34. Aguilar, R.; Cristóbal-Pérez, E.J.; Balvino-Olvera, F.J.; de Jesús Aguilar-Aguilar, M.; Aguirre-Acosta, N.; Ashworth, L.; Lobo, J.A.; Martén-Rodríguez, S.; Fuchs, E.J.; Sanchez-Montoya, G.; et al. Habitat fragmentation reduces plant progeny quality: A global synthesis. Ecol. Lett. 2019, 22, 1163–1173. [Google Scholar] [CrossRef] [Green Version]
  35. Aguilar, R.; Ashworth, L.; Galetto, L.; Aizen, M.A. Plant reproductive susceptibility to habitat fragmentation: Review and synthesis through a meta-analysis. Ecol. Lett. 2006, 9, 968–980. [Google Scholar] [CrossRef]
  36. Aguilar, R.; Quesada, M.; Ashworth, L.; Herrerias-Diego, Y.; Lobo, J. Genetic consequences of habitat fragmentation in plant populations: Susceptible signals in plant traits and methodological approaches. Mol. Ecol. 2008, 17, 5177–5188. [Google Scholar] [CrossRef] [PubMed]
  37. Young, A.; Boyle, T.; Brown, T. The population genetic consequences of habitat fragmentation for plants. Trends Ecol. Evol. 1996, 11, 413–418. [Google Scholar] [CrossRef] [PubMed]
  38. Hamrick, J.L.; Godt, M.J.W.; Sherman-Broyles, S.L. Factors influencing levels of genetic diversity in woody plant species. New For. 1992, 6, 95–124. [Google Scholar] [CrossRef]
  39. Hamrick, J.L. Response of forest trees to global environmental changes. For. Ecol. Manag. 2004, 197, 323–335. [Google Scholar] [CrossRef]
  40. Vranckx, G.; Jacquemyn, H.; Muys, B.; Honnay, O. Meta-Analysis of Susceptibility of Woody Plants to Loss of Genetic Diversity through Habitat Fragmentation. Conserv. Biol. 2012, 26, 228–237. [Google Scholar] [CrossRef] [PubMed]
  41. Hipp, A.L.; Manos, P.S.; González-Rodríguez, A.; Hahn, M.; Kaproth, M.; McVay, J.D.; Avalos, S.V.; Cavender-Bares, J. Sympatric parallel diversification of major oak clades in the Americas and the origins of Mexican species diversity. New Phytol. 2018, 217, 439–452. [Google Scholar] [CrossRef] [PubMed] [Green Version]
  42. Bittkau, C. Charakterisierung der Genetischen Variation Europäischer Populationen von Acer spp. und Populus tremula auf der Basis der Chloroplaten-DNA: Rückschlüsse auf die Postglaziale Ausbreitung und Differenzierung Forstlicher Provenienzen; FAWF: Gwynedd, Wales, 2002; pp. 1–87. [Google Scholar]
  43. Neophytou, C.; Konnert, M.; Fussi, B. Western and eastern post-glacial migration pathways shape the genetic structure of sycamore maple (Acer pseudoplatanus L.) in Germany. For. Ecol. Manag. 2019, 432, 83–93. [Google Scholar] [CrossRef]
  44. Liepelt, S.; Bialozyt, R.; Ziegenhagen, B. Wind-dispersed pollen mediates postglacial gene flow among refugia. Proc. Natl. Acad. Sci. USA. 2002, 99, 14590–14594. [Google Scholar] [CrossRef] [Green Version]
  45. Hoffmann, E. Der Ahorn. Wald-, Park- und Straßenbaum; VEB Deutscher Landwirtschaftsverlag: Leipzig, Germany, 1960. [Google Scholar]
  46. Rusanen, M.; Vakkari, P.; Blom, A. Evaluation of the finnish gene-conservation strategy for Norway maple (Acer platanoides L.) in the light of allozyme variation. For. Genet. 2000, 7, 155–165. [Google Scholar]
  47. Rusanen, M.; Vakkari, P.; Blom, A. Genetic structure of Acer platanoides and Betula pendula in northern Europe. Can. J. For. Res. 2003, 33, 1110–1115. [Google Scholar] [CrossRef]
  48. Perry, D.J.; Knowles, P. Allozyme variation in sugar maple at the northern limit of its range in Ontario, Canada. Can. J. For. Res. 1989, 19, 509–514. [Google Scholar] [CrossRef]
  49. Fore, S.A.; Hickey, R.J.; Vankat, J.L.; Guttman, S.I.; Schaefer, R.L. Genetic structure after forest fragmentation: A landscape ecology perspective. Can. J. Bot. 1992, 70, 1659–1668. [Google Scholar] [CrossRef]
  50. Koskela, J.; Lefèvre, F.; Schueler, S.; Kraigher, H.; Olrik, D.C.; Hubert, J.; Longauer, R.; Bozzano, M.; Yrjänä, L.; Alizoti, P.; et al. Translating conservation genetics into management: Pan-European minimum requirements for dynamic conservation units of forest tree genetic diversity. Biol. Conserv. 2013, 157, 39–49. [Google Scholar] [CrossRef] [Green Version]
  51. Kavaliauskas, D.; Šeho, M.; Baier, R.; Fussi, B. Genetic variability to assist in the delineation of provenance regions and selection of seed stands and gene conservation units of wild service tree (Sorbus torminalis (L.) Crantz) in southern Germany. Eur. J. For. Res. 2021, 140, 551–565. [Google Scholar] [CrossRef]
  52. Andrews, S. FastQC: A Quality Control Tool for High Throughput Sequence Data [Online]. 2010. Available online: https://www.bioinformatics.babraham.ac.uk/projects/fastqc/ (accessed on 1 March 2022).
  53. Rousset, F. GENEPOP’007: A complete re-implementation of the GENEPOP software for Windows and Linux. Mol. Ecol. Resour. 2008, 8, 103–106. [Google Scholar] [CrossRef]
  54. Kalinowski, S.T.; Taper, M.L.; Marshall, T.C. Revising how the computer program CERVUS accommodates genotyping error increases success in paternity assignment. Mol. Ecol. 2007, 16, 1099–1106. [Google Scholar] [CrossRef]
  55. Peakall, R.; Smouse, P.E. GENALEX 6: Genetic analysis in Excel. Population genetic software for teaching and research. Mol. Ecol. Notes 2006, 6, 288–295. [Google Scholar] [CrossRef]
  56. Peakall, R.; Smouse, P.E. GenALEx 6.5: Genetic analysis in Excel. Population genetic software for teaching and research-an update. Bioinformatics 2012, 28, 2537–2539. [Google Scholar] [CrossRef] [Green Version]
  57. Szpiech, Z.A.; Jakobsson, M.; Rosenberg, N.A. ADZE: A rarefaction approach for counting alleles private to combinations of populations. Bioinformatics 2008, 24, 2498–2504. [Google Scholar] [CrossRef] [Green Version]
  58. Goudet, J. FSTAT (Version 1.2): A Computer Program to Calculate F-Statistics. J. Hered. 1995, 86, 485–486. [Google Scholar] [CrossRef]
  59. Pritchard, J.K.; Stephens, M.; Donnelly, P. Inference of population structure using multilocus genotype data. Genetics 2000, 155, 945–959. [Google Scholar] [CrossRef] [PubMed]
  60. Felsenstein, J. PHYLIP (Phylogeny Inference Package); Department of Genome Sciences, University of Washington: Seattle, WA, USA, 2005. [Google Scholar]
  61. Piry, S.; Luikart, G.; Cornuet, J.M. BOTTLENECK: A computer program for detecting recent reductions in the effective population size using allele frequency data. J. Hered. 1999, 90, 502–503. [Google Scholar] [CrossRef]
  62. Queller, D.C.; Goodnight, K.F. Estimating Relatedness Using Genetic Markers Published by: Society for the Study of Evolution Stable. Evolution (N. Y). 2016, 43, 258–275. [Google Scholar]
  63. Lynch, M.; Ritland, K. Estimation of pairwise relatedness with molecular markers. Genetics 1999, 152, 1753–1766. [Google Scholar] [CrossRef] [PubMed]
  64. Jones, O.R.; Wang, J. COLONY: A program for parentage and sibship inference from multilocus genotype data. Mol. Ecol. Resour. 2010, 10, 551–555. [Google Scholar] [CrossRef] [PubMed]
  65. Mantel, N. The detection of disease clustering and a generalized regression approach. Cancer Res. 1967, 27, 209–220. [Google Scholar] [CrossRef] [PubMed]
  66. Peakall, R.; Ruibal, M.; Lindenmayer, D.B. Spatial autocorrelation analysis offers new insights into gene flow in the Australian bush rat, Rattus fuscipes. Evolution 2003, 57, 1182–1195. [Google Scholar] [CrossRef]
  67. Moran, P. Notes on Continuous Stochastic Phenomena. Biometrika 1950, 37, 17–23. Available online: http://www.jstor.org/stable/2332142 (accessed on 1 March 2022). [CrossRef]
  68. Savolainen, O.; Pyhäjärvi, T.; Knürr, T. Gene flow and local adaptation in trees. Annu. Rev. Ecol. Evol. Syst. 2007, 38, 595–619. [Google Scholar] [CrossRef]
  69. Blanc-Jolivet, C.; Degen, B. Using simulations to optimize genetic diversity in Prunus avium seed harvests. Tree Genet. Genomes 2014, 10, 503–512. [Google Scholar] [CrossRef]
  70. Guarino, C.; Santoro, S.; De Simone, L.; Cipriani, G. Prunus avium: Nuclear DNA study in wild populations and sweet cherry cultivars. Genome 2009, 52, 320–337. [Google Scholar] [CrossRef] [PubMed]
  71. George, J.P.; Konrad, H.; Collin, E.; Thevenet, J.; Ballian, D.; Idzojtic, M.; Kamm, U.; Zhelev, P.; Geburek, T. High molecular diversity in the true service tree (Sorbus domestica) despite rareness: Data from Europe with special reference to the Austrian occurrence. Ann. Bot. 2015, 115, 1105–1115. [Google Scholar] [CrossRef] [PubMed] [Green Version]
  72. Dobeš, C.; Konrad, H.; Geburek, T. Potential population genetic consequences of habitat fragmentation in central European forest trees and associated understorey species-An introductory survey. Diversity 2017, 9, 9. [Google Scholar] [CrossRef] [Green Version]
  73. Akhmetov, A.; Ianbaev, R.; Boronnikova, S.; Yanbaev, Y.; Gabitova, A.; Kulagin, A. Norway maple (Acer platanoides) and pedunculate oak (Quercus robur) demonstrate different patterns of genetic variation within and among populations on the eastern border of distribution ranges. J. For. Sci. 2021, 67, 522–532. [Google Scholar] [CrossRef]
  74. Firbas, F. Spät-und Nacheiszeitliche Waldgeschichte Mitteleuropas Nördlich der Alpen; Fischer: Jena, Germany, 1949. [Google Scholar]
  75. Bertsch, K. Geschichte des Deutschen Waldes; G. Fischer: Jena, Germany, 1949. [Google Scholar]
  76. Tollefsrud, M.M.; Sønstebø, J.H.; Brochmann, C.; Johnsen, Ø.; Skrøppa, T.; Vendramin, G.G. Combined analysis of nuclear and mitochondrial markers provide new insight into the genetic structure of North European Picea abies. Heredity 2009, 102, 549–562. [Google Scholar] [CrossRef] [PubMed] [Green Version]
  77. Caudullo, G.; de Rigo, D. Acer platanoides in Europe: Distribution, habitat, usage and threats. In European Atlas of Forest Tree Species; Publications Office of the EU: Luxembourg, Germany, 2016; p. e019159. [Google Scholar]
Figure 1. Sampling locations of studied populations. Population numbers refer to Table 1.
Forests 13 00552 g001
Figure 2. Unrooted UPGMA tree showing population relationships based on Nei’s Standard genetic distances for all analyzed populations of Acer platanoides. Population numbers refer to Table 1; country codes are provided for non-Austrian populations. Main clusters detected are indicated by brackets. “Low diversity” refers to populations with low genetic diversity and elevated levels of relatedness within them.
Forests 13 00552 g002
Figure 3. STRUCTURE analysis results presented as pie charts on the map; the different colors represent different clusters assigned to populations. Diameter of pie charts is proportional to the number of samples analyzed per population. Population numbers refer to Table 1.
Forests 13 00552 g003
Figure 4. Mantel test results showing the relation of Nei’s standard genetic distance vs. geographical distances for all Austrian samples from 27 natural populations.
Forests 13 00552 g004
Figure 5. COLONY results showing the observed sibship assignment plots for individuals of population 6 on the left and individuals of population 28 on the right side.
Forests 13 00552 g005
Figure 6. Results of pairwise relatedness analysis within population samples using the Queller & Goodnight [62] estimator. Upper and lower error bars bound the 95% confidence interval about the mean values (blue) as determined by bootstrap resampling. Upper and lower confidence limits (red) bound the 95% confidence interval about the null hypothesis of ‘no difference from expected relatedness’ across the populations as determined by permutation.
Forests 13 00552 g006
Table 1. Information on sampled populations.
Population NumberNameCountryProvinceLatitudeLongitudeNumber of SamplesComments
1BromatsreuteATVorarlberg47.549.8229Nature reserve forest
2ZwurmsATVorarlberg47.339.6630Natural
3SchrunsATVorarlberg47.089.9017Natural
4BezauATVorarlberg47.399.8629Natural
5ZamsATTyrol47.1610.6020Natural
6MühlgrabenATLower Austria48.0315.5526Nature reserve forest
7KollmitzgrabenATLower Austria48.8315.5430Nature reserve forest
8MitterbergATUpper Austria48.4313.5729Nature reserve forest
9StaufATUpper Austria48.4413.9245Nature reserve forest
10MarsbachATUpper Austria48.4613.8220Nature reserve forest
11FreyensteinerDonauwaldATLower Austria48.2314.9330Nature reserve forest
12DobraATLower Austria48.5915.4030Nature reserve forest
13KardinalgrabenATLower Austria48.1115.2340Nature reserve forest
14LuxensteinwaldATLower Austria48.6414.7432Nature reserve forest
15SommereinATLower Austria47.9916.6820Nature reserve forest
16Sankt GertraudATCarinthia46.5214.6034Natural
17LeobersdorfATLower Austria47.9216.1328Natural
18LandsbergATUpper Austria47.9014.2630Natural
19SalzkammergutATSalzburg/Styria47.7413.4230Natural
20TennengauATSalzburg47.6513.1030Natural
21VorderbergATCarinthia46.5813.5524Natural
22SchönbrunnATVienna48.1816.3029Natural
23SeebensteinATLower Austria47.6316.1338Natural
24FalkensteinATLower Austria48.7316.5618Natural
25KlagenfurtATCarinthia46.6714.3120Planted stand
26GrünbachATLower Austria47.8015.9933natural
27PernitzATLower Austria47.9315.9811natural
28BernhardtsthalATLower Austria48.7016.9030Registered Seed Stand/planted
29Planting stock AustriaAT 24Obtained from nursery as putative offspring from Bernhardtsthal (pop. 28)
30SternbergATCarinthia46.6313.9824Semi-urban, isolated population
31Germany1DEBaden-Würtemberg48.609.0125Obtained from nursery
32Germany2DEBaden-Würtemberg48.538.9936Obtained from nursery
33Borjád HUBorjád45.9318.4825Obtained from nursery
34SzombathelyHUSzombathely47.2016.5526Obtained from nursery
35BusovacaBHBusovaca44.1017.9031Natural Forest
36RadavaBHRadava43.8918.4230Natural Forest
37EstoniaEEViljandimaa58.0925.0614Natural Forest
38HaarikonmäkiFIEast Finland61.5729.1831Gene conservation unit
Table 2. Information on novel nuclear marker loci used including name, size range in base pairs, mean number of alleles (Na), repeat motif, forward and reverse primers respectively, GenBank accession numbers and average null allele frequency.
LocusSize bpMean NaRepeat MotifPrimer-FPrimer-RGenBank Accession No.Null Alleles
Ap_20237179–2038.895(TATT)8AGTTACCTCTCAAAATCTCCATCTAACAATAAGGGGGTGGTGTGGACMT8954040.105
Ap_188503245–2585.368(TTTA)7TCGTTCCTTATCGGGCAAAATGTCAGAATTGTTTTCTTCACTAGTTGCMT8954050.051
Ap_541809112–1364.000(TTA)10TGAGAATTTTCCAAGTACTAGAACCGTCAAGCACTAGAACTATTTATCCCGMT8954060.016
Ap_638034175–19610.553(ACAT)7GAGATTGCAAGGCCCTGTTGATCATCTGTTGAGCCCCTCCMT8954070.019
Ap_33364228–2397.316(TTTA)7CGGTGGAAACCGACTGTAATCTCATAATGTTTGGAAGGTTTTGGCMT8954080.022
Ap_4482792–1058.684(TA)18GGAGCATCACGAAACTACCGAAATGGCGTCACTTGCTACGMT8954090.017
Ap_6406985–1066.868(ATA)14ACATTAAAAGTGGAAACTGAAAAGGACCGTCGTTTAGATATAGACATGCMT8954100.027
Ap_27475867–18310.026(AG)15GGTATTAACAGAATTAGGAAGGGGGAGTGTCACAAAGTTCGCCAGMT8954110.017
Ap_361727186–2044.579(ATA)9GCAACTCCAAATCCGGACAGCGGTTAGCTGTCATCGTTTCTCMT8954120.093
Ap_374910224–2527.921(ATT)15ACAAGTGGAGTCGTATAGATCCTGACTTCGAGTTCTGATTAAAATTGGGMT8954130.072
Ap_411647227–2459.053(AT)19TCGGCTATTCATCTCAAGATTTGGTGGGTAACCAATCGGTCCAGMT8954140.057
Ap_48820789–1823.711(AAAT)7TCGGGAAACTGGTTAGGTGCGCAACTTTGGAGCGGTATCCMT8954150.134
Ap_501482233–2415.658(TA)11AGGCTTCCATGGCGAAATTGCTT-GCTTGACCAGAGGTTTCCMT8954160.007
Ap_658195190–2063.974(TACA)8AGGTCTAGGACCCAGGAAATCGGTTTAGCTGGTTGAGATGGTCMT8954170.105
Ap_671221123–2146.895(TATT)7TGGAATGTAAAGAGACATTAGTGGGTGGCTCCATTACCACCATCMT8954180.018
Table 3. Diversity indices calculated for all populations including effective number of alleles, observed, and expected heterozygosity, F value (the level of significance for heterozygote [HZ] deficit or excess is indicated by * = 0.05, ** = 0.01; *** = 0.001), allelic richness, CI values and bottleneck IAM respectively.
Pop.NeHoHeuHeF (Sign. HZ Deficit/Excess)ArPop_eff (CI)Bottleneck IAM
13.534±0.3120.670±0.0350.694±0.0270.706±0.0280.033±0.036*4.764±0.3373822–660.0257±0.0065
23.847±0.3050.745±0.0360.724±0.0210.736±0.021−0.029±0.038 4.851±0.3853421–590.1004±0.0013
33.648±0.4250.661±0.0540.686±0.0380.707±0.0390.043±0.046 4.981±0.4602614–530.1004±0.0383
43.657±0.3080.717±0.0290.707±0.0240.719±0.025−0.020±0.041*4.901±0.3964527–800.0236±0.0062
53.641±0.4180.613±0.0310.698±0.0260.717±0.0260.115±0.050***4.635±0.4423017–650.0028±0.0036
64.206±0.3550.727±0.0610.742±0.0250.756±0.0250.032±0.073 5.256±0.4142815–540.0029±0.0003
73.939±0.3900.724±0.0510.715±0.0330.727±0.034−0.008±0.043 5.135±0.4264829–840.0027±0.0024
84.534±0.6110.674±0.0540.724±0.0460.736±0.0460.060±0.058***5.596±0.5768551–1650.0272±0.0079
94.293±0.4530.739±0.0420.734±0.0320.742±0.033−0.002±0.021 5.411±0.4755133–810.0027±0.0009
104.051±0.4230.661±0.0480.728±0.0260.746±0.0260.095±0.050**5.461±0.4685431–1220.0283±0.0184
113.672±0.3920.603±0.0600.672±0.0610.683±0.0620.092±0.035***4.825±0.4463622–650.0240±0.0197
124.460±0.5240.730±0.0460.737±0.0350.750±0.0350.014±0.029*5.531±0.4874426–820.0032±0.0016
134.634±0.6330.770±0.0360.742±0.0330.751±0.033−0.041±0.025 5.533±0.5224026–650.0031±0.0003
144.136±0.5450.670±0.0650.698±0.0540.709±0.0550.037±0.052*4.995±0.5103923–680.0209±0.0009
154.701±0.5930.791±0.0480.745±0.0360.764±0.037−0.057±0.029 5.772±0.5693318–680.0032±0.0005
164.370±0.5380.729±0.0410.738±0.0290.749±0.0290.017±0.025 5.299±0.4852918–530.0027±0.0003
173.886±0.4270.711±0.0670.688±0.0570.701±0.058−0.005±0.043 5.150±0.5453622–630.1009±0.0222
185.092±0.6980.793±0.0380.760±0.0350.773±0.035−0.047±0.027 5.898±0.6285836–1000.0030±0.0002
194.262±0.4640.765±0.0410.733±0.0330.745±0.034−0.040±0.022 5.330±0.4815133–880.1007±0.0014
204.330±0.5330.724±0.0360.736±0.0290.749±0.0300.017±0.030*5.528±0.4986440–1160.0270±0.0032
213.647±0.4040.632±0.0590.681±0.0430.696±0.0440.070±0.067**5.053±0.5053520–690.1018±0.0228
224.605±0.5580.765±0.0450.744±0.0360.757±0.037−0.026±0.028 5.675±0.5154628–820.0281±0.0031
234.376±0.4710.736±0.0450.741±0.0290.751±0.0300.012±0.043*5.540±0.4924832–800.0029±0.0012
243.991±0.5430.702±0.0490.705±0.0350.725±0.0360.013±0.041 5.275±0.6153819–910.2424±0.0129
254.186±0.5000.651±0.0500.720±0.0380.739±0.0390.091±0.055***5.183±0.4665430–1510.0293±0.0022
264.769±0.6690.749±0.0330.750±0.0310.762±0.0320.000±0.021 5.643±0.5605333–920.0274±0.0017
274.154±0.5130.777±0.0480.719±0.0340.754±0.036−0.075±0.035 5.705±0.6875524–undef0.2784±0.0298
283.087±0.3270.742±0.0600.636±0.0400.647±0.040−0.159±0.052***4.250±0.39074–210.0199±0.0366
292.757±0.4230.598±0.0920.544±0.0650.556±0.067−0.091±0.092*3.598±0.443178–380.0576±0.0290
302.963±0.2160.686±0.0480.638±0.0360.652±0.037−0.065±0.043 3.933±0.2092112–430.0226±0.0045
314.636±0.5970.663±0.0590.739±0.0380.755±0.0390.124±0.052***5.398±0.534169–340.0255±0.0005
324.606±0.4980.730±0.0280.754±0.0280.765±0.0280.029±0.025*5.502±0.4613220–570.0029±0.0001
334.434±0.5470.724±0.0520.729±0.0380.744±0.0390.015±0.032 5.367±0.5502715–510.0031±0.0012
343.863±0.4020.675±0.0580.706±0.0350.720±0.0360.051±0.056*5.096±0.488148–300.0026±0.0033
353.483±0.3170.680±0.0410.688±0.0290.699±0.0290.012±0.043 4.873±0.3674627–820.0030±0.0441
364.780±0.7410.718±0.0550.743±0.0340.756±0.0340.036±0.056*5.682±0.6224225–770.0032±0.0016
373.433±0.3160.652±0.0860.672±0.0420.697±0.0430.073±0.102 4.730±0.4375222–16510.0850±0.0167
382.753±0.2770.633±0.0570.588±0.0500.598±0.051−0.086±0.047 3.760±0.375169–340.4203±0.0532
Total4.037±0.0790.703±0.0080.708±0.0060.722±0.0060.009±0.008 5.135±0.48139.2 0.0257±0.0065
Publisher’s Note: MDPI stays neutral with regard to jurisdictional claims in published maps and institutional affiliations.

