
94% of researchers rate our articles as excellent or good
Learn more about the work of our research integrity team to safeguard the quality of each article we publish.
Find out more
ORIGINAL RESEARCH article
Front. Mater. , 03 September 2020
Sec. Structural Materials
Volume 7 - 2020 | https://doi.org/10.3389/fmats.2020.572347
This article is part of the Research Topic Women in Science: Materials View all 34 articles
 Lidija KoratVilma Ducman*
Alkali activated foams have been extensively studied in recent years, due to their high performance and low environmental footprint compared to foams produced via other methods. Three types of fly ash differing in chemical and mineralogical composition and specific surface were used to synthesize alkali activated foams. Sodium perborate monohydrate was added as a foaming agent and sodium dodecyl sulphate as a stabilizing agent. Foams were characterized at room temperature and after exposure to an elevated temperature (1,000°C). Densities from 1.2 down to 0.3 g/cm3 were obtained, depending on the type of fly ash and quantity of foaming agent added. Correspondingly, compressive strength ranged from 1 to 6 MPa. Comparing all three fly ashes the most favorable results, in terms of density and corresponding compressive strength, were achieved from the fly ash with the highest amounts of SiO2 and Al2O3, as well as the highest amorphous phase content i.e., RI fly ash. Furthermore, after firing to 1,000°C, the density of samples prepared using fly ash RI remained approximately the same, while the compressive strength increased on average by 50%. In the other two types of fly ash the density increased slightly after firing, due to significant shrinkage, and compressive strength increased by as much as 800%. X-ray powder diffraction analysis confirmed the occurrence of a crystallization process after firing to 1,000°C, which resulted in newly formed crystal phases, including nepheline, sodalite, tridymite, and gehlenite.
Alkali-activated (AA) materials have been widely investigated in recent years (Provis and Bernal, 2014; Provis et al., 2015; Luukkonen et al., 2018; Provis, 2018) within the context of the construction and building industry. More specifically, research in the area of sintered and non-sintered foam materials, based on the process of alkali activation, is currently extremely active (Zhao et al., 2010; Chen et al., 2011; Hajimohammadi et al., 2017a; Rabelo Monich et al., 2018; Rincon, 2019). The aforementioned foams present one of the most promising types of AA materials, given their high performance and low environmental footprint in comparison to foams produced by other methods (Dal Pozzo et al., 2019). They are known to offer relatively high strength and good insulation, as well as being non-combustible up to high temperatures (Bajare et al., 2019). The key element likely to influence the use of alkali-activation is the local availability of appropriate raw materials (precursors and activators) (Provis, 2018), typically metakaolinite, slags and ashes. The wide availability of fly ash has forced researchers to find novel applications suitable for larger-scale production, one option being lightweight foams with a bulk density of <1 g/cm3. The mechanical properties, i.e., compressive strength of such lightweight materials depends on the density of the foamed AA materials, and is found to range between 1 and 10 MPa for densities from 0.36 to 1.4 g/cm3 (Zhao et al., 2010; Masi et al., 2014a; Sanjayan, 2015). Foaming agents for producing AA foams are selected from various compounds, especially hydrogen peroxide (Masi et al., 2014; Abdollahnejad et al., 2015; Palmero et al., 2015; Hajimohammadi et al., 2017b; Szabo, 2017), NaOCl (Nyale et al., 2013; Boke, 2015; Łach et al., 2018), metal powders (e.g., elemental aluminum or zinc) (Masi et al., 2014a; Hlaváček et al., 2015; Kamseu et al., 2015; Hajimohammadi et al., 2017c), perborate (Abdollahnejad et al., 2015; Davidovits, 2015), as well as silica fume and some others (Zhao et al., 2010; Henon et al., 2013; Guo et al., 2016; Kioupis et al., 2018). Foaming agents react or decompose in alkaline conditions and form gas which remains trapped inside the structure, thus expanding the material, increasing its volume and forming a cellular structure (Masi et al., 2014a; Sanjayan, 2015). Dried AA foams (already successfully stabilized at room or slightly elevated temperature) (Masi et al., 2014b; Sanjayan, 2015; Kioupis et al., 2018) can also be subjected to heat treatment at higher temperatures, for example in a furnace at temperatures between 800 and 1,000°C, in order to improve mechanical properties (Chen et al., 2011; Badanoiu et al., 2015; Carabba et al., 2017; Bajare et al., 2019; Rincon Romero, 2019). Rincon Romero et al. (2019) presented glass-ceramic foams, based on soda lime glass and coal fly ash, where dried foams were later subjected to heat treatment at 700–900°C. The glass-ceramic foams produced had a high porosity (58–78%), a thermal conductivity of 0.163 ± 0.005 W m−1 K−1 (measured at 25°C, samples treated at 800°C), and reasonable compressive strength (1.8–8.7 MPa). The results of Abdollahnejad et al. (2015) show that sodium perborate outperforms hydrogen peroxide, leading to a lower overall thermal conductivity of foam materials (approximately 0.1 W m−1 K−1) and a compressive strength of approximately 6 MPa. Zhao et al. (2010) fabricated foams with coal fly ash and 13 wt% foaming agent (sodium dodecyl benzene sulfonate and gluten) sintered at 1,050°C for 2 h after alkali-activation. The resulting foams exhibited values for water absorption, apparent density, and compressive strength of approximately 126.5%, 0.414 g/cm3, and 6.76 MPa, respectively. Results from other researchers to date have nevertheless shown that the stability of foams at high temperatures (especially with regard to shrinkage) is strongly affected by the composition of raw materials, not only when fly ash is used (Martin et al., 2015) but also when other additives such as metakaolin and slag are present in the AA material (Mierzwinski et al., 2019; Tran et al., 2019). Some of the authors concluded that shrinkage occurs due to the increased density or change in volume induced by the crystallization of new phases, rather than due to a melting point or viscous creep (Martin et al., 2015). In 2006, Bakharev wrote that fly ash activated with activators containing sodium exhibited shrinkage cracking and a rapid decline in strength at 800°C (but an increase in average pore size), where the loss of strength on firing may have been associated with the deterioration of the aluminosilicate gel and feldspar crystallization. Martin et al. (2015) studied AA material (fly ash with 15% sodium silicate + 85% 10-M NaOH) from 25 to 600°C and their findings showed that the increase in temperature led to an increased compressive strength (with the specimens exhibiting elastic behavior and brittle failure), increased pore size distribution, and the presence of hydroxysodalite (nepheline at 800°C), and that the dimensional stability of the material was affected at temperatures over 1,000°C. According to Chen-Yong et al. (2017), the mechanical strength of foamed AA materials (class F fly ash with hydrogen peroxide) deteriorated to 3 MPa at 400°C but increased up to 11 MPa at 800°C, due to the formation of crystalline phases (nepheline, anorthite, and cristobalite) at higher temperatures, which potentially act as fillers to reinforce the matrix.
The aim of the present research was to evaluate the usability of sodium perborate monohydrate (SPM), which is inexpensive and widely available, as a foaming agent in AA systems. Three different types of fly ash were used, the main difference being their chemical composition, i.e., the content of SiO2 and Al2O3, which might subsequently influence the properties of the foams produced. The performance of foams was determined after curing at 70°C but also assessed after exposure to an elevated temperature (1,000°C), in order to verify their mechanical properties and dimensional stability at an elevated temperature and thus expand the potential applications of inorganic AA foams to areas where resistance to high temperatures is required, such as for the insulation of furnaces, chimneys, and heat resistant doors.
Three types of fly ash (designated as RI, TS, and TT) originating from different sources were investigated, including two types (RI, TS) originating from coal thermal power plants, and one (TT) derived from the co-combustion of coal and biomass material at a heat and power station. RI fly ash is F type, while the other two are C type fly ash. The Brunauer-Emmet-Teller (BET) specific surface areas and chemical compositions (determined by X-ray fluorescence) of the investigated fly ashes are shown in Table 1. Sodium silicate solution (sodium silicate crystal 0112; produced by Tennants Distribution, Ltd., SiO2:Na2O = 1.97, 54.2 mass% aqueous solution) and NaOH (produced by Donau Chemie, 41.7 mass% aqueous solution) were used as activating agents. The foaming agent was SPM (Sodium Perborate Monohydrate produced by Belinka) and the stabilizing agent was sodium dodecyl sulphate (SDS) (produced by Acros Organics).
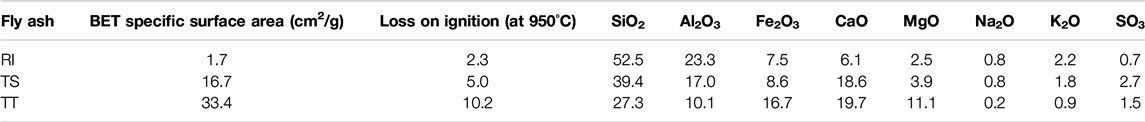
TABLE 1. BET specific surface area and chemical composition of the different types of fly ash (wt%) which were used in the study of alkali-activated foams.
The investigated AA foams were synthesized from sodium silicate solution, NaOH, and the selected fly ash, to which SPM (as the selected foaming agent) and SDS (as the stabilizing agent) were then added. SDS has already been confirmed as a suitable stabilizing agent in a previous study (Korat and Ducman, 2017). Samples were prepared with varying compositions, the sample designations and sample compositions of the various mixtures of the AA foams are presented in Table 2. Three mixtures were prepared for each selected fly ash, with designations 1, 2, and 3 representing the amount of SPM and/or SDS added. The amount of SPM and SDS is equal, determined according to the mixture of water glass, NaOH, and fly ash being investigated. First NaOH was dissolved in the water glass solution, and then this solution was added to the fly ash. Components were then mixed together. Samples were mixed for 5 min in a laboratory mixer. At the end of mixing process the SPM and SDS were added and the foaming process started. The mixture was then placed in molds with dimensions of 20 mm × 20 mm × 80 mm and the samples expanded further. The molds were then placed in an oven for 24 h at a temperature of 70°C. The resulting hardened test specimens were demolded and stored for a further 3 days at a controlled temperature of 20 ± 2°C.
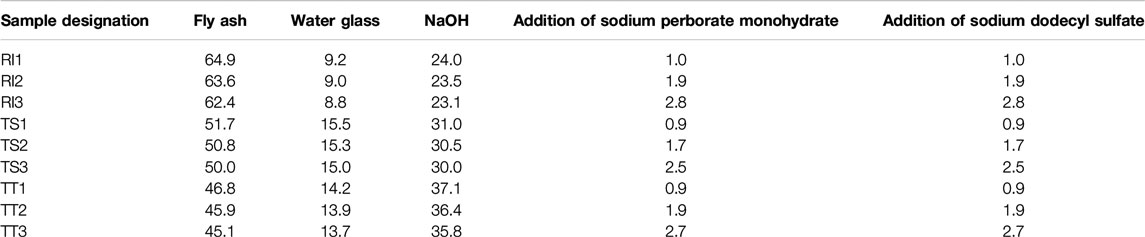
TABLE 2. The sample designation and sample compositions of the different mixtures prepared for the investigation (in wt%).
The investigated AA foams were subjected to thermal treatment using a Porotherm furnace fired to 1,000°C at a heating rate of 600°C/h.
The density of the AA foams were calculated by dividing the measured weight of the samples by their dimensions, firstly at the age of 4 days and later after firing. The dimensions, which were also used to determine shrinkage, were measured using digital Vernier calipers (Mitutoyo, Japan), and the sample mass was measured using a laboratory scale (Sartorious, Germany). Reported density values were obtained from the average of three separate measures per sample.
The compressive strength of the test specimens was determined at the age of 4 days and later on after firing, by means of a Toninorm testing machine (Toni Technik, Germany), using a force application rate of 0.005 kN/s. The reported values of mechanical strength were obtained from the average of 10 sample measures per mixture.
The back-scattered electrons image mode of a low vacuum Scanning Electron Microscope (JEOL 5500 LV equipment) was then used to examine the microstructure of selected cross-sections of the hardened foams.
X-ray diffraction analysis was performed using an Empyrean (PANalytical) X-ray diffractometer equipped with Cu Kα radiation. The data was collected at room temperature at an acceleration voltage of 45 kV using a current of 40 mA, from 4 to 70° 2θ in steps of 0.031° 2θ.
For the porosity analysis X-ray micro-computed tomographic imaging was conducted using an Xradia µCT-400″ tomograph (XRadia, Concord, CA, United States). The 3D images were produced using a working voltage of 80 kV and an energy of 125 µA, with a spatial resolution of 29 µm, using a ×0.39 magnification optical objective. Regions of interest (ROIs) were selected from the center of the sample, at a size of 15 mm × 15 mm × 15 mm. The projection data for each tomographic scan consisted of 2,000 projection images, which were taken from different view-points with an exposure time of 1 s per projection. These images were reconstructed into 3D tomographic volumes using Avizo Fire 3D-image analysis software. The segmentation procedure and quantification, for the determination of overall porosity and pore size distribution of the hardened foams, was performed using the procedure previously described (Korat et al., 2013).
Thermal conductivity tests on the samples were performed using a Hot Disk TPS 2500S instrument with a Kapton sensor 7577 at a temperature of 22–23°C. The measure was tested on square samples (20 mm × 20 mm × 80 mm), with 10 measurements performed on each samples.
Figure 1 shows the AA foams from three types of fly ash (designated as RI, TS, and TT), prepared using a foaming agent and stabilizing agent in the range 0.9–2.8 wt% (designated as 1, 2, and 3). Figure 1A depicts cured samples at 70°C and Figure 1B shows samples after being thermally treated at 1,000°C. The change in color observed in the thermally treated samples can be explained by oxidation of the iron present in the raw fly ash, presenting from greyish to brownish color at higher temperatures. This explains why samples with TT fly ash are darker and have a more intense brown color (see Table 1).

FIGURE 1. Alkali-activated foams (A) cured at 70°C and (B) thermally treated to 1,000°C (two samples per mixture).
Table 3 shows the density and compressive strength of the AA foams investigated, after curing at 70°C and when thermally treated to 1,000°C. Sample RI1 exhibits the highest density of all the samples prepared with RI fly ash when cured at 70°C (0.67 g/cm3). As the amount of foaming agent and stabilizing agent added increased, the density of the RI1 sample decreased by more than half, to 0.3 g/cm3. A similar trend is observed for samples from the TS and TT fly ash, but both have a higher density than the samples produced from RI fly ash. Nevertheless, even with the highest amount of foaming and stabilizing agents added, their densities remain above 0.5 g/cm3. Compressive test results for samples from RI, TS, and TT fly ash (cured at 70°C) are also shown in Table 3 and Figure 2. Values are the highest for samples from RI fly ash (around 6 MPa) and begin to decline as the amount of foaming and stabilizing agent added increased, which decreases density. Values for the samples from TT fly ash are slightly higher than for the sample from TS.

TABLE 3. Density and compressive strength of the alkali-activated foams investigated when cured at 70°C and thermally treated at 1,000°C (the measured standard deviations are shown in brackets).
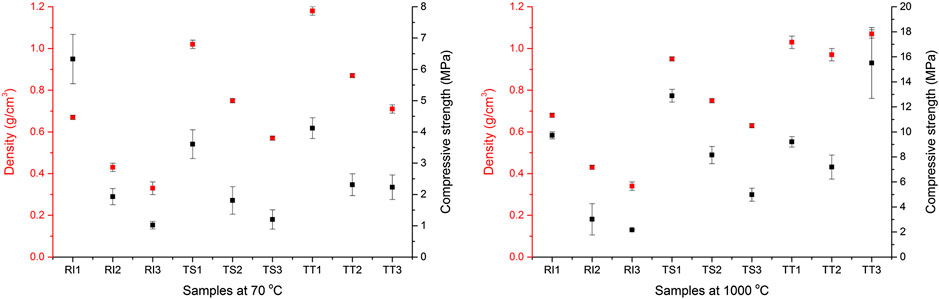
FIGURE 2. Density and compressive strength of the alkali-activated foams investigated when cured at 70°C and thermally treated at 1,000°C.
Compressive test results for samples from RI, TS, and TT fly ash exposed to temperatures of 1,000°C are also shown in Table 3. A tendency to increase compressive strength upon thermal treatment was observed in all samples. After heat treatment, sample RI1 still has the highest density among all three samples from RI fly ash and the lowest amongst all the samples when compared to those produced from the other two types of fly ash. Compressive strength values for RI fly ash began to decline (from 10 to 2 MPa) as the amount of foaming and stabilizing agent added increased, and the density decreased. A similar trend is observed for samples from TS and TT fly ash. There are no significant differences in density between cured and thermally treated samples for samples from RI fly ash (only a few percent), or for samples from TS fly ash, but there is a big difference for samples from TT fly ash (from 10 to 50%), which can be attributed to the increased density resulting from the significant shrinkage.
Dimensional changes, i.e., shrinkage, occurred in samples after exposure to high temperatures of 1,000°C. For samples with the most foaming agent added, the biggest changes were detected in the direction of length, as shown in Figure 3. The results show that the difference in dimensional changes (percentage change in length) is approximately 4% for sample RI3, 9% for sample TS3, and 19% for sample TT3. Lin’s work (Lin et al., 2009) revealed thermal shrinkage values of 45% for geopolymer and 30% for geopolymer with the addition of 10 vol% alumina filler, when heated to 1,000°C. Shrinkage could be attributed to the presence of alkaline earth flux and other oxides in the fly ash and activators, which enter the glassy phase, decreasing the viscosity of these samples resulting in higher shrinkage (Dana et al., 2004), or, as suggested by Martin, to volume changes caused by the formation of new crystalline phases (Martin et al., 2015). Weight loss after exposure to temperatures at 1,000°C is approximately 10% for sample RI3, 14% for sample TS3, and 20% for sample TT3, as shown in Figure 3.

FIGURE 3. Changes in sample dimensions of the alkali-activated foams investigated, expressed in length and weight loss.
Thermal conductivity tests were conducted on AA foams cured at 70°C, the results of which are listed in Table 4. Thermal conductivity properties relative to density are given in Figure 4.

TABLE 4. Thermal conductivity of the investigated alkali-activated foams cured at 70°C (the measured standard deviations are shown in brackets).
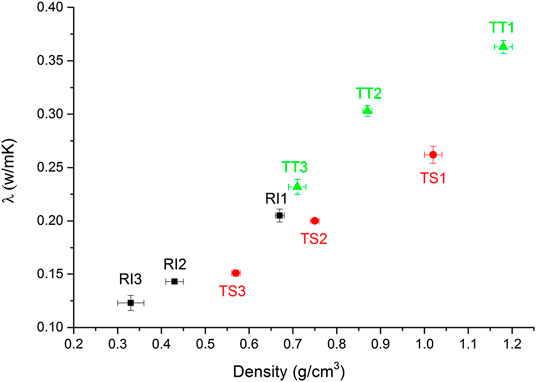
FIGURE 4. Thermal conductivity properties vs. density in the analyzed alkali-activated foams cured at 70°C (RI, TS, and TT fly ash used, 1, 2, and 3 represent amount of foaming and stabilizing agent used).
The results show the thermal conductivity of RI samples to be 0.205 W/m K for the least porous sample (RI1), falling to 0.123 W/m K for the most porous one (RI3; Table 4), where the range of apparent densities for the corresponding samples obtained is 0.67–0.33 g/cm3. The results for TS samples show that thermal conductivity ranges from 0.151 W/m K for the most porous sample (TS3) to 0.262 W/m K for the least porous one (TS1), with the range of apparent densities being 0.57–1.02 g/cm3. The thermal conductivity measured in the TT samples treated at 70°C ranges from 0.232 to 0.363 W/m K, with a density of 0.71 g/cm3 in the least porous sample (TT3). As expected, the higher the density, the higher the thermal conductivity (Figure 4). The overall behavior of the thermal conductivity is generally controlled by the pore volume, as the most porous sample exhibits the lowest thermal conductivity, as has been found by other researchers (Henon et al., 2013).
Microstructural characteristics have a significant influence on material characteristics, especially thermal and mechanical properties, and because the pore structure inside the material strongly affects the cell (solid) structure, tests by scanning electron microscope (SEM) and X-ray micro-computed tomography (XCT) were performed to gain a more detailed understanding. Firstly, Figure 5 shows the microstructural evolution of AA foam samples attained through SEM before exposure to higher temperatures. It is evident that samples from RI fly ash have a porous structure with evenly distributed round pores, clearly developed and connected to each other. No micro-cracks are observed within and nearly all of them are cell pores with no mineral crystallization observed inside or on the walls. Contrarily, samples from TS and TT fly ash have a different pore distribution, especially TT foamed samples, which exhibit high structural heterogeneity and contain hardly any rounded pores. These differences in the type of porosity are most probably a reflection of the previously mentioned thermal conductivity—for example TS2 samples have a higher density than RI1 (0.75 and 0.67 g/cm3, respectively) and exhibited slightly lower thermal conductivity (0.200 vs. 0.205 W/m K), and sample TT3, with a density of 0.71 g/cm3, showed a thermal conductivity of 0.232 W/m K.
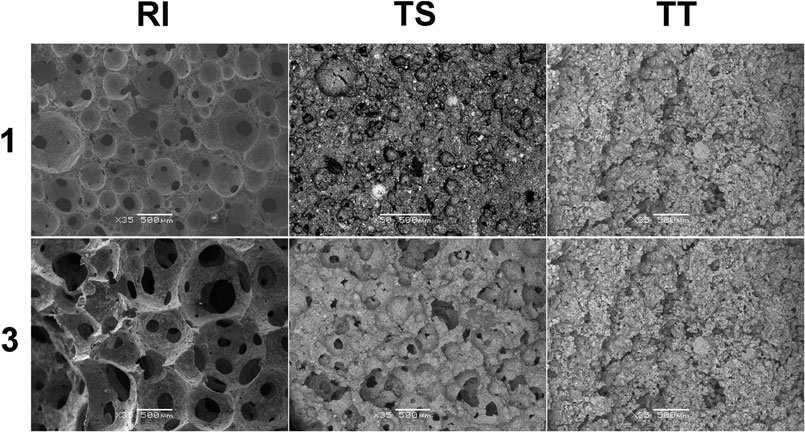
FIGURE 5. Representative SEM image of alkali-activated foams cured at 70°C (RI, TS, and TT fly ash, 1 and 3 represent the amount of foaming and stabilizing agents used).
SEM images can only, however, provide the pore characteristics on a single cross section of the specimen, meaning representative shapes or the number of pores cannot be appropriately characterized. More detailed microstructural 3D data can be obtained from high resolution 3D images achieved through X-ray microcomputed tomography. 3D data is displayed on the basis of threshold segmentation and 3D reconstructions, and where the pore structure quantitative visualization and characterization of pore structure of AA foams cured at 70°C are presented on Figure 6. Figure 6 illustrates the ROI (Region Of Interest) of the analyzed AA foams cured at 70°C, including the grayscale image and the biggest pores (by volume), and after the watershed algorithm, where the labeled images show distinct colors for similar pores (purple, green, and yellow pores, as determined according to the EqDiameter). The overall porosity of samples is presented in Table 5.
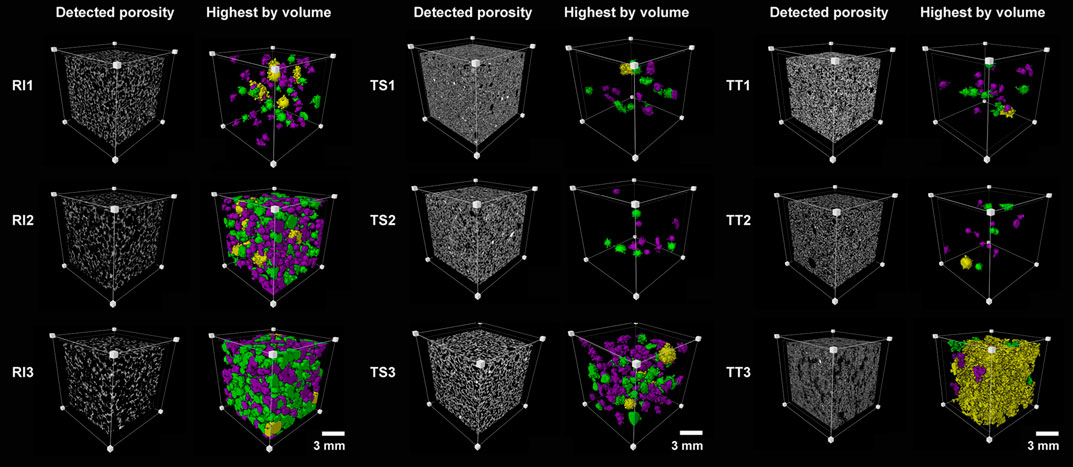
FIGURE 6. Region of interest of the analyzed alkali-activated foams cured at 70°C (RI, TS, and TT fly ash, 1, 2, and 3 represent the amount of foaming and stabilizing agents used) presenting grayscale images and the biggest main pores. Colors denote a range of size classes with respect to EqDiameter: purple (0.85–1 mm), green (1–1.6 mm), and yellow (more than 1.6 mm).
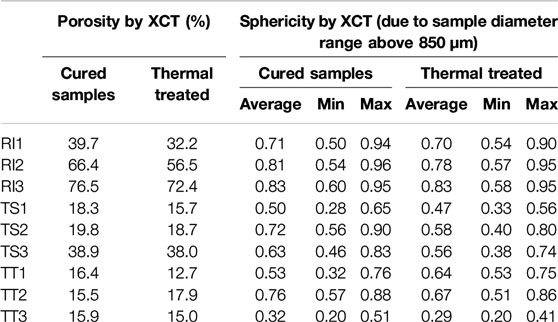
TABLE 5. Porosity by XCT of the investigated alkali-activated foams cured at 70°C and thermally treated at 1,000°C.
Overall porosity, the local volume ration of the cell (solid) in the ROI, is the highest for samples with RI fly ash. The higher percentages for the RI2 and RI3 samples are illustrated by the porous nature of the AA foams analyzed, due to the addition of the largest amount of agents. RI2 and RI3 both consist of a defined connected pore network with larger individual pores, some of which are even larger than 1 mm. A similar effect is observed in samples from the TS fly ash, but with a smaller pore size and porosity up to approximately 40% in TS3. In the case of TT, the effect of poor porosity development is more notably pronounced. The differences between TT1 and TT3 can be seen from the SEM images (Figure 5), which is coherent to the structure detected by XCT scanning, revealing deficient pore development. The structure of samples is similar to one another, with the porosity ranging from 10 to 20%.
3D geometrical parameters (especially equivalent diameter) are relevant for the determination of pore morphology and can indicate the thickness of the asymmetric and/or elongated pore structures. Equivalent diameter is reported as the diameter of a sphere having the same volume as the feature (Figure 7), showing the percentage of pores (as well as number and volume) distributed in each sample.
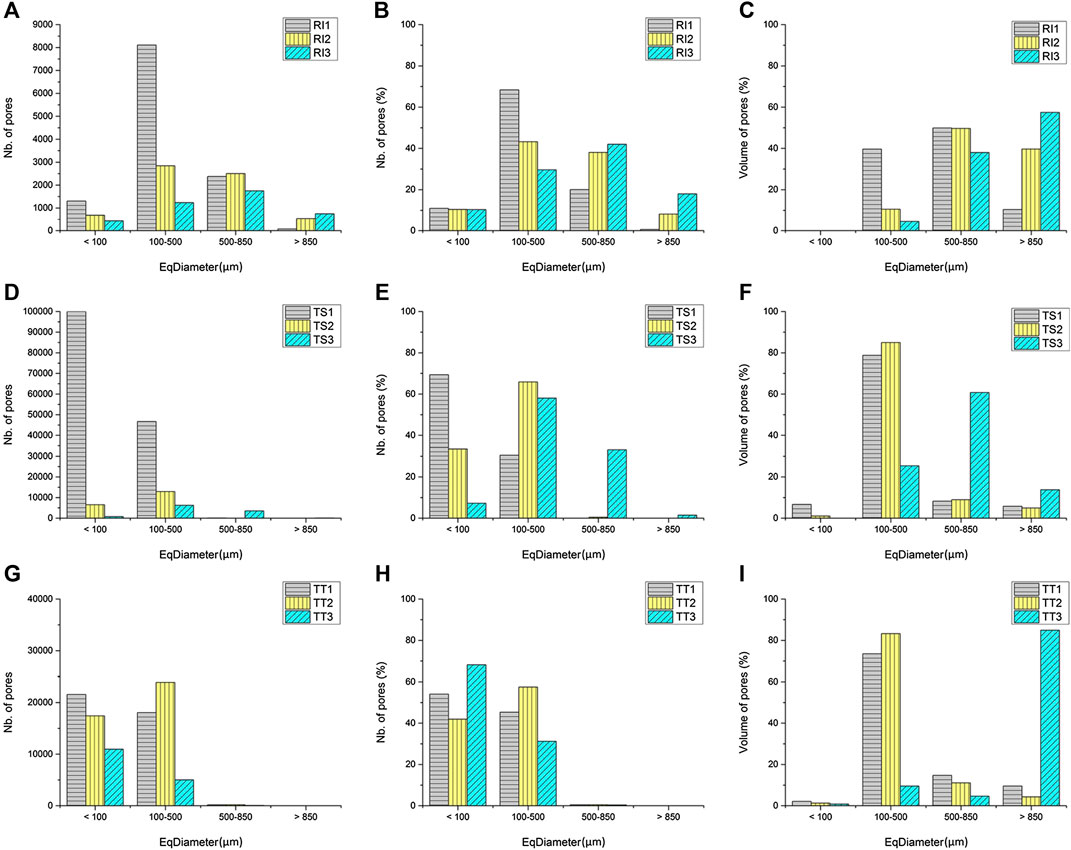
FIGURE 7. Graphical representation of the pore size distribution of the analyzed alkali-activated foams cured at 70°C (RI, TS, and TT fly ash used, 1, 2, and 3 represent the amount of foaming and stabilizing agents used; (A)–(C) RI fly ash, (D)–(F) TS fly ash, (G)–(I) TT fly ash), determined by means of X-ray micro-tomography. The results present the number, percentage and volume of pores with respect to pore size diameter (EqDiameter).
As shown in Figure 7A, the highest number of pores in the RI samples is in the 100–850 µm pore diameter range, where RI1 has the larger number of pores ranging in diameter from 100 to 500 µm, due to the addition of the least amount of foaming agent. The number of pores with a diameter below 100 µm is similar across all three RI samples, with the RI1 sample containing the highest number of pores in this category. In TS samples, the greatest number of pores fall in the pore diameter range below 500 µm (Figure 7D), where TS1 has the largest number of pores with a pore diameter less than 100 µm, due to the addition of a smaller amount of foaming agent. Despite the larger percentage of foaming agent added to samples TS2 and TS3, the number of pores in the 100–500 µm pore diameter range is still high in sample TS1. TT samples (Figure 7G) have the highest number of pores with a diameter less than 500 µm, compared to other types of fly ash, where sample TT1 having the largest number of pores with a diameter less than 100 µm.
In the R1 sample, most pores are in the 100–850 µm pore diameter range (Figure 7B), where RI1 has the largest amount/percentage of pores in the pore diameter range 100–500 µm, reaching almost 70%. Due to the addition of a greater amount of foaming agent, the percentage of number of pores in the range 500–850 µm is higher for samples RI2 and RI3, with approximately 38% of pores in sample RI2 falling in this range. Sample RI3 has a larger percentage of pores with a diameter above 500 µm, approximately 60%. The percentage of pores with a diameter below 100 µm is about 10% for all three RI samples. In TS samples most pores are below 500 µm in diameter, with sample TS1 having the largest percentage of pores with a diameter less than 100 µm, reaching almost 70% (Figure 7E). Due to the addition of a greater amount of foaming agent, the percentage of number of pores in the diameter range 100–500 µm is higher (above 60%) for samples TS2 and TS3. Only sample TS3 has a larger percentage of pores in the pore diameter range above 500 µm (about 35%) and the least in the pore diameter range below 100 µm (about 10%). In the TT samples, most pores are in the pore diameter range below 500 µm (Figure 7H). Due to the addition of a greater amount of foaming agent, the percentage of number of pores in the range 100–500 µm is higher only for TT2 (almost 60%). The percentage of pores in the pore diameter range below 100 µm is large, especially in the RI3 sample (70%).
The volume of pores in the pore diameter range from 100 to 850 µm is between 40 and almost 90% for all three RI samples (Figure 7C), with the greatest volume of pores observed in the RI1 sample, showing the maximum volume of pores for the RI1 sample. In the RI2 sample the volume of pores in this pore diameter range is 60%, with 40% of pores having a diameter greater than 850 µm. In the RI3 sample the largest percentage of pore volume has a pore diameter of greater than 500 µm, almost 95%. TS samples have the greatest volume of pores in the pore diameter range between 100 and 850 µm (Figure 7F), whereas sample TS1 has almost 80% in the pore diameter range between 100 and 500 µm, and sample TS2 more than 80%. In the TS3 sample the maximum volume of pores is in the pore diameter range above 500 µm (75%). In samples TT1 more than 70% of the volume of pores lie in the pore diameter range from 100 to 500 µm (Figure 7I). A high volume of pores in this pore diameter range is also seen in the TT2 sample (80%), whilst in sample TT3 the maximum percentage of the volume of pores is in the pore diameter range above 850 µm, due to poor porosity development.
Another 3D geometrical parameter relevant for the determination of pore morphology is sphericity, which describes how spherical an object is, or how rounded it is. Sphericity is a measure of the degree to which an object approximates the shape of a sphere, where the sphericity of 1 represents a perfect spherical shape. X-ray computer micro-tomography has given the possibility of evaluating the results and the calculated sphericity values, as a function of pore size, are shown in Figure 8. The sphericity of the samples cured at 70°C is also given in Table 5 and represents the quantitative statistical data measured from the reconstructed images. The average value, and minimal and maximal sphericity of the tested samples, are also written in Table 5. This analysis was conducted on pores larger than 850 μm diameter, as presented in Figure 8.
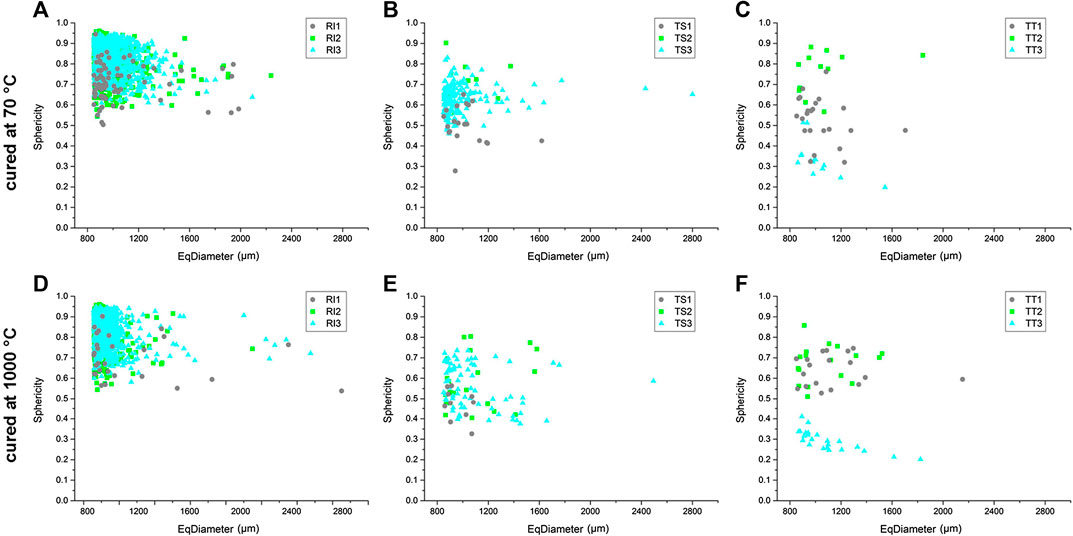
FIGURE 8. Graphical representation of the sphericity values as a function of pore size of the analyzed alkali-activated foams cured at 70°C (A)–(C) and 1,000°C (D)–(F), determined by means of X-ray micro-tomography.
The results for RI samples thermally treated at 70°C show that the majority of pores were close to spherical in shape as their sphericity values are above 0.50, between 0.55 and 0.95, with no huge difference between mixtures (Figure 8A). There are less spherical pores, i.e., with a sphericity smaller than 0.65, in the TS1 samples and more spherical pores in TS2 and TS3 (up to 0.85). The sphericity of the pores in TT samples thermally treated at 70°C is relatively low (0.25–0.75), confirming their irregular shape, especially for sample TT3, which has the lowest sphericity due to poor pore shape (Figure 8C). It is also observed that the sphericity is equal between mixtures in R1 samples, whereas sphericity is seen to slightly change between the mixtures in TS samples (mixtures with a higher addition of foaming agent have higher sphericity values) and in TT samples there are huge changes between the mixtures. Notably, no large differences in the sphericity of samples occur due to an increase in the equivalent diameter of pores.
X-ray powder diffraction (XRD) (Figure 9) revealed the variable phase composition of the studied ashes and AA foams cured at 70 and 1,000°C (results only for samples with the smallest and largest addition of agents). Based on the height of the background presenting the amorphous phase it can be seen the RI fly ash contains the highest amount of amorphous phase of all three precursors, followed by the TT fly ash, and then the TS. The amount of amorphous phase was determined in a previous study (Kramar and Ducman, 2018), as 84.4% for RI, 71.7% for TT, and 70.0 for TS (designated in the previous research as K3, K1, and K2, respectively). The main crystalline phases identified in the designed geopolymers were similar to those found in the raw precursor, such as quartz and hematite, which were also present in all samples cured at 70°C. Lime, anhydrite, and gehlenite were found in all samples, with the exception of one from RI ash (Figure 9). It is known that an increase in quartz concentration positively influences mechanical properties, due to the capacity of its particles to create barriers for crack propagation (Nergis et al., 2020). Brownmillerite, a hydraulic phase, which could contribute to the increase in strength, was present in the samples with TT ash derived from the co-combustion of coal and biomass, while feldspar was identified in samples with TS ash, periclase in RI and TT ashes and mullite in RI samples. Mullite is a less commonly encountered compound formed from aluminum, silicon, and oxygen, which increases the refractivity of a geopolymer due to its very high melting temperature of 1,840°C (Nergis et al., 2020). As written by Diaz et al. (2010), amorphous compounds are easier to dissolve than crystalline compounds during the first step of geopolymerization (dissolution of species), yielding higher amounts of reactive SiO2 and Al2O3 to combine during the transportation/coagulation phase of the geopolymeric reaction, therefore resulting in a higher degree of geopolymerization and consequently higher mechanical strength. When the sodium based alkalis are used with fly ash, the reaction product in the system is associated with the formation of sodium aluminosilicate gel (Bhagath Singh and Subramaniam, 2016).
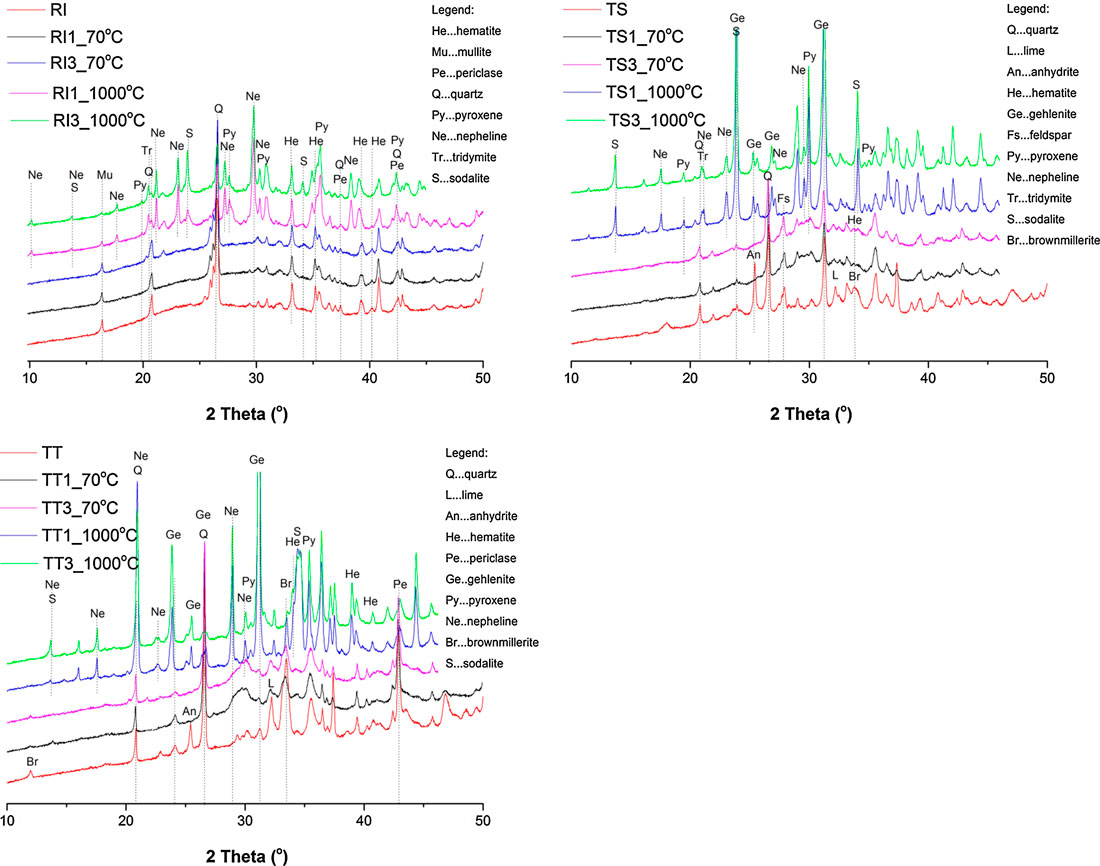
FIGURE 9. Phase composition of the analyzed alkali-activated foams cured at 70 and 1,000°C (RI, TS, and TT fly ash used, 1, 2, and 3 represent amount of foaming and stabilizing agents used), as determined by means of X-ray powder diffraction.
Figure 10 shows the microstructural evolution of AA foam samples after exposure to higher temperatures at 1,000°C, attained through SEM. Samples with RI fly ash still have a nice porous structure with evenly distributed round pores, connected and with no micro-cracks, whereas samples with TT fly ash exhibit poor microstructural evolution. Figure 10 shows that no noticeable changes were observed in samples after exposure to higher temperatures. The more detailed results of X-ray microcomputed tomography further confirm the findings obtained by SEM, as presented in Figure 10.
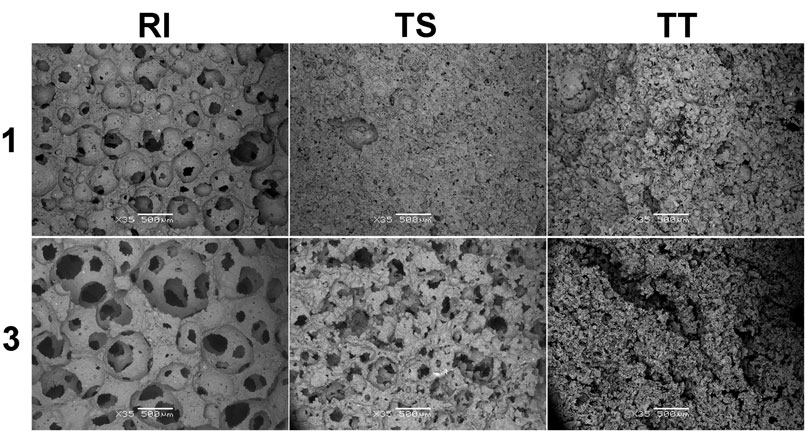
FIGURE 10. Representative SEM image of alkali-activated foams thermally treated at 1,000°C (RI, TS, and TT fly ash used, 1 and 3 represent the amount of foaming and stabilizing agent added). The bars on all SEM photos represent 500 µm (×35 magnification).
Overall porosity determined by XCT is still the highest for samples with RI fly ash, followed by TS samples and TT with poor porosity development (Table 5). The difference in overall porosity between cured samples and samples exposed to higher temperatures is noticeable, varying between samples from 1 to 10%.
Porosity determined by XCT is visually presented in Figure 11, depicting a range of size classes above 0.85 mm, and pore size distribution of the samples is shown in Figure 12. The pore diameter ranges and the number of pores observed in RI samples show a similar trend to the same samples cured at 70°C, but the number of pores in the 100–850 µm pore diameter range, as well as below 100 µm, is smaller in samples cured at 1,000°C (Figure 12A). TS samples cured at 1,000°C also show similar porosity development to samples cured at 70°C, where sample TS1 cured at 1,000°C has large amount of pores in the pore diameter range below 100 µm (Figure 12D), although still less than samples cured at 70°C. Despite the greater percentage of foaming agent added to samples TS2 and TS3, the number of pores in sample TS3 (in the 100–500 µm pore diameter range) is still high, unlike in sample TS3 cured at 70°C. The highest number of pores for TT samples is in the pore diameter range below 500 µm (Figure 12G), where sample TT1 still has the largest number of pores in the pore diameter range below 100 µm, due to the addition of a smaller amount of foaming agent. A similar trend to in samples cured at 70°C can be seen, although a smaller number of pores with a pore diameter below 100 µm are present in sample TT1 when cured at 1,000°C. Despite the larger percentage of foaming agent added to samples TT2 and TT3, TT1 has the highest number of pores in the pore diameter range between 100 and 500 µm, unlike in the sample cured at 70°C.
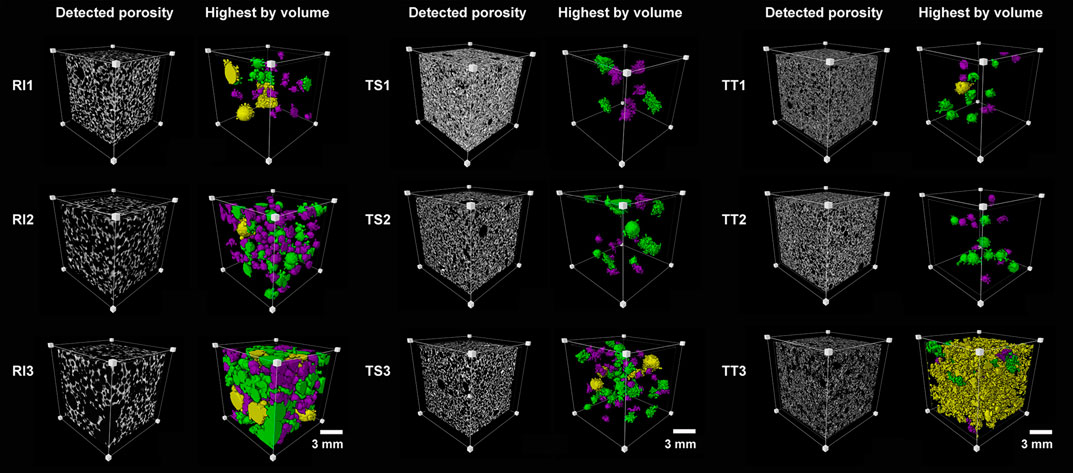
FIGURE 11. Region of interest of the analyzed alkali-activated foams cured at 1,000°C (RI, TS, and TT fly ash used, 1, 2, and 3 represent the amount of foaming and stabilizing agent added) presenting grayscale image and the biggest main pores. Colors correspond to a range of size classes with respect to EqDiameter, purple (0.85–1 mm), green (1–1.6 mm), and yellow (more than 1.6 mm).

FIGURE 12. Graphic representation of the pore size distribution of the analyzed alkali-activated foams cured at 1,000°C (RI, TS, and TT fly ash used, 1, 2, and 3 represent the amount of foaming and stabilizing agents added; (A)–(C) RI fly ash, (D)–(F) TS fly ash, (G)–(I) TT fly ash), determined by means of X-ray micro-tomography. The results show the number, percentage, and volume of pores with regard to pore size diameter (EqDiameter).
In R1 samples cured at 1,000°C the majority of pores are in the pore diameter range 100–850 µm (Figure 12B), where RI1 has the largest percentage of pores in the pore diameter range 100–500 µm, reaching almost 74%, which is more than in those samples cured at 70°C. Due to the higher amount of foaming agent, the percentage of pores in the range 500–850 µm is higher in RI2 and RI3 samples, about 33 and 10%, respectively, which is slightly lower than in those samples cured at 70°C. The percentage of pores in the pore diameter range below 100 µm is approximately 10% for all three RI samples. In TS samples cured at 1,000°C (Figure 12E) the majority of pores have a diameter below 500 µm, with samples TS1 and TS2 having a large percentage of pores in the pore diameter range below 100 µm, approximately 54 and 35%, respectively. A similar trend as in TS samples cured at 70°C was observed, but with a smaller amount of pores. Due to the higher addition of foaming agent in samples TS2 and TS3, the percentage of pores in the 100–500 µm range is higher (above 60%) when cured at 1,000°C compared to when cured at 70°C. Sample TS3 has a larger percentage of pore sizes both in the pore diameter range 100–500 µm about (approximately 60%) and in the pore diameter range below 100 µm (approximately 30%), unlike the samples cured at 70°C. In TT samples cured at 1,000°C (Figure 12H), the majority of pores have a diameter below 500 µm. Due to the higher addition of foaming agent, the percentage of pores between 100 and 500 µm is higher only for TT1, similar to in samples cured at 70°C. Sample TT3 cured at 1,000°C has a large percentage of pores in the pore diameter range below 100 µm (70%).
When compared to other RI samples cured at 1,000°C, sample RI1 has the highest volume of pores in the pore diameter range 100–850 µm (approximately 80%; Figure 12C), which is slightly less than in the samples cured at 70°C. In the RI2 samples almost 60% of the volume of pores lies in the 500–850 µm pore diameter range, while 25% of pores have a diameter larger than 850 µm. In the RI3 sample the largest percentage of the volume of pores is above a diameter of 500 µm (almost 92%), slightly less than in the samples cured at 70°C. At least 75% of the volume of pores in samples TS1 cured at 1,000°C have a pore diameter ranging between 100 and 500 µm (Figure 12F), which is less than in the TS1 sample cured at 70°C. Sample TS2 cured at 1,000°C has 70% in the same pore diameter range and sample TS3 almost 88% volume in the pore diameter range from 100–850 µm. Sample TT1 cured at 1,000°C has more than 60% of the volume of pores in the pore diameter range from 100 to 500 µm (Figure 12I), less than in the same sample cured at 70°C. A high volume of pores in this pore diameter range is also seen in the TT2 sample, reaching 70% (less than the sample cured at 70°C) while sample TT3 has poor porosity development.
The results for RI samples thermally treated at 1,000°C show that the majority of pores were close to spherical in shape, as their sphericity values are above 0.50 (between 0.55 and 0.95) with no huge difference between mixtures (Figure 8D). The same trend is evident as in RI samples thermally treated at 70°C. The same trend also occurs in TS samples thermally treated at 1,000°C, where TS1 samples have a sphericity smaller than 0.6, while more spherical pores occur in TS2 and TS3 (up to 0.8; Figure 8E). The sphericity of the pores in TT samples thermally treated at 1,000°C is relatively low, similar to as in TT samples thermally treated at 70°C, confirming their irregular shape, especially for sample TT3, which has the lowest sphericity due to poor pore shape (Figure 8F). The results for RI samples thermally treated at 1,000°C also show that sphericity is equal between mixtures, whereas it can be seen that sphericity slightly changes according to the mixture in TS samples (mixtures with higher addition of foaming agent have higher sphericity values), and in TT samples huge changes are observed between the mixtures, similar to in samples thermally treated at 70°C.
The XRD patterns of the studied ashes and AA foams cured at 1,000°C are shown in Figure 9. The results show multiple peaks specific to quartz and hematite, and in some cases mullite in the RI samples, and gehlenite in TS and TT samples. The aforementioned crystalline phases detected in the initial material remain apparently unaltered with heating, as it was not expected that the mullite would melt or dissolve during firing to 1,000°C (given their melting point of approximately 1,830°C). It is believed that the presence of free sodium in the matrix causes the dissolution/melting of the mullite into the geopolymer at lower temperature, as alkali’s are known to be excellent sintering agents (Rickard et al., 2012). Hematite, however, exhibited an increased peak intensity, especially in the TT samples (due to their higher concentration of iron). Rickard et al. (2012) reported that hematite is likely to have crystallized from the amorphous iron in the fly ash.
When the temperature is increased to 1,000°C, the diffraction peaks of the aforementioned phases become weak, and new phases start to crystalize into pyroxene, nepheline, tridymite, sodalite, brownmillerite, and gehlenite as response to the thermal treatment. The reduction of quartz peak intensity is likely due to a partial phase change to tridymite. In the presence of alkali oxides, quartz converted to tridymite, depending on the temperature. It has been reported that tridymite starts to form above 872°C with Na2O and above 883°C with K2O (Holmquist, 1961). These high temperature phases, tridymite (SiO2) and nepheline (NaAlSiO4), are reported to improve the thermal resistance of the geopolymers due to their high melting points (tridymite 1,670°C and nepheline 1,257°C) (Rickard et al., 2012). In general, if silicon dioxide is available at such a high temperature, nepheline is no longer stable and feldspar will form. The amount of calcium available causes different types of feldspar to form (Dombrowski et al., 2007). It seems that the matrix decomposes, then the aluminosilicate species react with the released alkalis and calcium to form crystalline phases (nepheline and gehlenite, respectively) (Gyekenyesi et al., 2011). One reason to explain this could be that the mullite and quartz were needed to form the large amount of gehlenite (Ca2(Al(AlSi)O7)), (Dombrowski et al., 2007), as seen in the samples (especially TS and TT) treated at 1,000°C. In addition, at 1,000°C, a phase belonging to the pyroxene group (diopside) is additionally formed due to sufficient Al2O3 content, which has been reported to have a positive role in its crystallization (Qian et al., 2006). Yang et al. (2017) also reported that the Mg-silicate crystalline phases of diopside may work as compensation for the thermal shrinkage of the geopolymer gel phase, in order to improve the volume stability. The intensities of peaks and small amounts of already crystallized aluminosilicate detected corresponded to sodalite (Na8(Al6Si6O24)Cl2), which has been observed to increase in fly ash samples activated by NaOH solution when exposed to temperatures of 1,000°C. Sodalite crystallizes in the cubic system as a mineral complex, formed by the reaction of sodium and chlorine with the main elements of the raw material (aluminum, silicon, and oxygen). The natural sodalite consists of an Al–O–Si network that encompasses Cl+ cations, but the one resulting from geopolymerization shows inter-structural Na+ cations, similar to zeolites (Nergis et al., 2020).
Based on the properties of all three precursors, it can be seen that the fly ash which contains the highest amounts of SiO2 and Al2O3, and the highest amorphous phase content, i.e., RI, is also the most reactive, both in terms of pozzolanic activity (Kramar and Ducman, 2018), and the alkali activation process. By adding foaming and stabilizing agents, the density can be tailored to one’s needs, but the initial precursor should provide sufficient reactivity and consequently result in good mechanical properties. In our study the RI fly ash exhibited the lowest density and when densities were comparable to those obtained from the other two fly ashes the compressive strength was significantly higher, which can be ascribed to the higher reactivity. Contrary to the expectation that BET specific surface would play an important role in the alkali activation process, by providing a surface available for reaction, in our case the BET specific surface area was not recognized as an important parameter.
Three types of fly ash were tested as precursors for the preparation of AA foams. SPM was used as the foaming agent and SDS as the stabilizing agent. Foam properties were determined after curing at 70°C and after exposure to 1,000°C. In all three systems the foaming process was successfully implemented, resulting in foams of density down to 0.3 g/cm. Compressive strength is highly dependent on density, and for the densities from 1.2 down to 0.3 g/cm3, compressive strength ranged from 1 to 6 MPa. Comparing all three fly ashes the favorable results in terms of performance (density vs. mechanical properties) were achieved from the fly ash with the highest SiO2 and Al2O3 content, and the highest amorphous phase content, i.e., RI fly ash. Also compressive strength is influenced by the type of fly ash; the sample from RI fly ash exhibited the highest compressive strength at a comparable (or even lower) density than the other two fly ashes. With the high amount of SiO2 and Al2O3, and high amorphous phase content, the alkali activation reaction is completed to a greater extent, resulting in better mechanical properties. In the case of the fly ash with the highest SiO2 and Al2O3 content, i.e., RI fly ash, the density remained virtually the same after firing to 1,000°C, but the compressive strength increased on average by 50%. In the case of the other two types of fly ash the density increased slightly after firing, but significant shrinkage occurred. Density did not increase, as would be expected due to the high shrinkage. Even though density did not increase, compressive strength increased hugely, by as much as 800% in the case of the TT fly ash, which contains the lowest amount of SiO2 and Al2O3.
XRD analysis also confirmed that the lime contained in the TS and TT fly ash disappeared after firing to 1,000°C, which could have contributed to the loss in mass and consequent reduction in density (in spite of significant shrinkage on firing). The crystallization process also took place during firing, resulting in newly formed crystal phases, including nepheline, sodalite, tridymite, and gehlenite, which could contribute to the increased compressive strength. SEM and microtomography analysis showed differences in the microstructure of foams, whereby pores are more uniform and spherical in foams based on RI fly ash compared to the other two fly ashes, which may also influence properties of thermal insulation and compressive strength. Improvements in the performance of foams in terms of density and mechanical properties, especially after exposure to elevated temperature when their structure remains stable after firing up to 1,000°C, could expand the potential use of inorganic AAM foams into areas where resistance to elevated temperature is required.
All datasets presented in this study are included in the article.
Conceptualization, VD; data curation, VD and LK; formal analysis, VD and LK; funding cquisition, VD and LK; methodology, VD, LK; supervision, VD; writing—original draft, LK; writing—review and editing, VD and LK.
The authors declare that the research was conducted in the absence of any commercial or financial relationships that could be construed as a potential conflict of interest.
We acknowledge financial support from the Slovenian Research Agency through the project No. J2-9197 (VD) and post-doctoral project No. Z2-1861 (LK).
Abdollahnejad, Z., Pacheco-Torgal, F., Félix, T., Tahri, W., and Barroso Aguiar, J. (2015). Mix design, properties and cost analysis of fly ash-based geopolymer foam. Construct. Build. Mater. 80, 18–30. doi:10.1016/j.conbuildmat.2015.01.063
Badanoiu, A. I., Al Saadi, T. H. A., Stoleriu, S., Voicu, G., and Voicu, G. (2015). Preparation and characterization of foamed geopolymers from waste glass and red mud. Construct. Build. Mater. 84, 284–293. doi:10.1016/j.conbuildmat.2015.03.004
Bajare, D., Vitola, L., Dembovska, L., and Bumanis, G. (2019). Waste stream porous alkali activated materials for high temperature application. Front. Mater. 6, 92. doi:10.3389/fmats.2019.00092/full
Bakharev, T. (2006). Thermal behaviour of geopolymers prepared using class F fly ash and elevated temperature curing. Cem. Concr. Res. 36 (6), 1134–1147. doi:10.1016/j.cemconres.2006.03.022
Bhagath Singh, G. V. P., and Subramaniam, K. V. L. (2016). Quantitative XRD study of amorphous phase in alkali activated low calcium siliceous fly ash. Construct. Build. Mater. 124, 139–147. doi:10.1016/j.conbuildmat.2016.07.081
Böke, N., Birch, G. D., Nyale, S. M., and Petrik, L. F. (2015). New synthesis method for the production of coal fly ash-based foamed geopolymers. Construct. Build. Mater. 75, 189–199. doi:10.1016/j.conbuildmat.2014.07.041
Carabba, L., Manzi, S., Rambaldi, E., Ridolfi, G., and Bignozzi, M. C. (2017). High-temperature behaviour of alkali-activated composites based on fly ash and recycled refractory particles. J. Ceram. Sci. Technol. 08 (3), 377–388.
Chen, B., Luo, Z., and Lu, A. (2011). Preparation of sintered foam glass with high fly ash content. Mater. Lett. 65 (23–24), 3555–3558. doi:10.1016/j.matlet.2011.07.042
Cheng-Yong, H., Yun-Ming, L., Mustafa Al Bakri Abdullah, M., and Hussin, K. (2017). Thermal resistance variations of fly ash geopolymers: foaming responses. Sci. Rep. 27 (7), 45355.
Dal Pozzo, A., Carabba, L., Bignozzi, M. C., and Tugnoli, A. (2019). Life cycle assessment of a geopolymer mixture for fireproofing applications. Int. J. Cycle Assess. 10, 1743–1757.
Davidovits, J. (2015). Geopolymer: chemistry and applications. 4th Edn. Saint-Quentin, France: J. Davidovits.
Diaz, E. I., Allouche, E. N., and Eklund, S. (2010). Factors affecting the suitability of fly ash as source material for geopolymers. Fuel 89, 992–996. doi:10.1016/j.fuel.2009.09.012
Dombrowski, K., Buchwald, A., and Weil, M. (2007). The influence of calcium content on the structure and thermal performance of fly ash based geopolymers. J. Mater. Sci. 42, 3033–3043. doi:10.1007/s10853-006-0532-7
Guo, Y., Zhang, Y., Huang, H., Meng, K., Hu, K., Hu, P., et al. . (2014). Novel glass ceramic foams materials based on red mud. Ceram. Int. 40 (5), 6677–6683. doi:10.1016/j.ceramint.2013.11.128
Gyekenyesi, A., Kriven, W. M., and Wang, J. (2011). Developments in Strategic materials and computational design II. New York, NY: Wiley, Vol. 32, Issue 10, 24.
Hajimohammadi, A., Ngo, T., and Mendis, P. (2017a). How does aluminium foaming agent impact the geopolymer formation mechanism? Cem. Concr. Compos. 80, 277–286. doi:10.1016/j.cemconcomp.2017.03.022
Hajimohammadi, A., Ngo, T., Mendis, P., Nguyen, T., Kashani, A., and van Deventer, J. S. J. (2017b). Pore characteristics in one-part mix geopolymers foamed by H2O2: the impact of mix design. Mater. Des. 130, 381–391. doi:10.1016/j.matdes.2017.05.084
Hajimohammadi, A., Ngo, T., Mendis, P., Kashani, A., and van Deventer, J. S. J. (2017c). Alkali activated slag foams: the effect of the alkali reaction on foam characteristics. J. Clean. Prod. 147, 330–339. doi:10.1016/j.jclepro.2017.01.134
Henon, J., Alzina, A., Absi, J., Smith, D. S., and Rossignol, S. (2013). Potassium geopolymer foams made with silica fume pore forming agent for thermal insulation. J. Porous Mater. 20, 37–46. doi:10.1007/s10934-012-9572-3
Hlaváček, P., Šmilauera, V., Škvárab, F., Kopeckya, L., and Šulc, R. (2015). Inorganic foams made from alkali-activated fly ash: mechanical. Chem. Phys. Prop. 35 (2), 703–709.
Holmquist, S. B. (1961). Conversion of quartz to tridymite. J. Am. Ceram. Soc. 44 (2), 82–86. doi:10.1111/j.1151-2916.1961.tb15355.x
Kamseu, E., Ngouloure, Z. N. M., Ali, B. N., Zekeng, S., Melo, U. C., Rossignol, S., et al. (2015). Cumulative pore volume, pore size distribution and phases percolation in porous inorganic polymer composites: relation microstructure and effective thermal conductivity. Energy Build. 88 (1), 45–56. doi:10.1016/j.enbuild.2014.11.066
Kioupis, D., Kavakakis, C., Tsivilis, S., and Kakali, G. (2018). Synthesis and characterization of porous fly ash-based geopolymers using Si as foaming agent. Adv. Mater. Sci. Eng. 2018, 11.
Korat, L., and Ducman, V. (2017). The influence of the stabilizing agent SDS on porosity development in alkali-activated fly-ash based foams. Cem. Concr. Compos. 80, 168–174. doi:10.1016/j.cemconcomp.2017.03.010
Korat, L., Ducman, V., Legat, A., and Mirtič, B. (2017). Characterisation of the pore-forming process in lightweight aggregate based on silica sludge by means of X-ray micro-tomography (micro-CT) and mercury intrusion porosimetry (MIP). Ceram. Int. 39 (6), 6997–7005. doi:10.1016/j.ceramint.2013.02.037
Kramar, S., and Ducman, V. (2018). Evaluation of ash pozzolanic activity by means of the strength activity index test, Frattini test and DTA/TG analysis. Tech. Gaz. 25 (6), 1746–1752.
Łach, M., Mierzwiński, D., Korniejenko, K., and Mikuła, J. (2010). Geopolymer foam as a passive fire protection. MATEC Web Conf. 247, 00031.
Lin, T. S., Jia, D. C., He, P. G., and Wang, M. R. (2009). Thermo-mechanical and microstructural characterization of geopolymers with α-Al2O3 particle filler. Int. J. Thermophys. 30, 1568–1577. doi:10.1007/s10765-009-0636-9
Luukkonen, T., Abdollahnejad, Z., Yliniemi, J., Kinnunen, P., and Illikainen, M. (2018). One-part alkali-activated materials: a review. Cem. Concr. Res. 103, 21–34. doi:10.1016/j.cemconres.2017.10.001.
Martin, A., Pastor, J. Y., Palomo, A., and Fernández Jiménez, A. (2015). Mechanical behaviour at high temperature of alkali-activated aluminosilicates (geopolymers). Construct. Build. Mater. 93, 1188–1196. doi:10.1016/j.conbuildmat.2015.04.044
Masi, G., Rickard, W. D. A., Bignozzi, M. C., and van Riessen, A. (2014a). The influence of short fibres and foaming agents on the physical and thermal behaviour of geopolymer composites. Adv. Sci. Tech. 92, 56–61. doi:10.4028/www.scientific.net/ast.92.56
Masi, G., Rickard, W. D. A., Vickers, L., Bignozzi, M. C., and van Riessen, A. (2014b). A comparison between different foaming methods for the synthesis of light weight geopolymers. Ceram. Int. 40, 13891–13902. doi:10.1016/j.ceramint.2014.05.108
Mierzwinski, D., Łach, M., Hebda, M., Walter, J., Szechynska-Hebda, M., and Mikuła, J. (2019). Thermal phenomena of alkali-activated metakaolin studied with a negative temperature coefficient system. J. Therm. Anal. Calorim. 138, 4167–4175.
Nergis, D. D. B., Al Bakri Abdullah, M. M., Sandu, A. V., and Vizureanu, P. (2020). XRD and TG–DTA study of new alkali activated materials based on fly ash with sand and glass powder. Materials 13 (2), 343.
Nyale, S. M., Babajide, O. O., Birch, G. D., Böke, N., and Petrik, L. F. (2013). Synthesis and characterization of coal fly ash-based foamed geopolymer. Proc. Environ. Sci. 18, 722–730. doi:10.1016/j.proenv.2013.04.098
Palmero, P., Formi, A., Antonaci, P., Brini, S., and Tulliani, J. M. (2015). Geopolymer technology for application-oriented dense and lightened materials. Elaboration and characterization. Ceram. Int. 41 (10), 12967–12979.
Provis, J. L. (2018). Alkali-activated materials. Cem. Concr. Res. 114, 40–48. doi:10.1016/j.cemconres.2017.02.009
Provis, J. L., and Bernal, S. A. (2014). Milestones in the analysis of alkali-activated binders. J. Sustain. Cem.-Based Mater. 4 (2), 74–84. doi:10.1080/21650373.2014.958599
Provis, J. L., Palomo, A., and Shi, C. (2015). Advances in understanding alkali-activated materials. Cem. Concr. Res. 78, 110–125. doi:10.1016/j.cemconres.2015.04.013
Qian, G., Song, Y., Song, Y., Zhang, C., Xia, Y., Zhang, H., et al. . (2006). Diopside-based glass-ceramics from MSW fly ash and bottom ash. Waste Manag. 26, 1462–1467. doi:10.1016/j.wasman.2005.12.009
RabeloMonich, P. R., Romero, A. R., Höllen, D., and Bernardo, E. (2018). Porous glass–ceramics from alkali activation and sinter-crystallization of mixtures of waste glass and residues from plasma processing of municipal solid waste. J. Clean. Prod. 188, 871–878. doi:10.1016/j.jclepro.2018.03.167
Rickard, W. D. A., Temuujin, J., Riessen, A., and van Riessen, A. (2012). Thermal analysis of geopolymer pastes synthesised from five fly ashes of variable composition. J. Non-Cryst. Solids 358, 1830–1839. doi:10.1016/j.jnoncrysol.2012.05.032
Rincón, A., Giacomello, G., Pasetto, M., and Bernardo, E. (2017). Novel ‘inorganic gel casting’ process for the manufacturing of glass foams. J. Eur. Ceram. Soc. 37, 2227–2234. doi:10.1016/j.jeurceramsoc.2017.01.012
Sanyan, J. G., Nazari, A., Chen, L., and Nguyen, H. (2015). Physical and mechanical properties of lightweight aerated geopolymer. Constr. Build. Mater. 79, 236–244.
Szabó, R., Gombkötő, I., Svéda, M., and Mucsi, G. (2017). Effect of grinding fineness of fly ash on the properties of geopolymer foam. Arch. Metall. Mater. 62, 1257–1261.
Tran, T. T., Kang, H., and Kwon, H.-M. (2019). Effect of heat curing method on the mechanical strength of alkali-activated slag mortar after high-temperature exposure. Materials 12, 1789. doi:10.3390/ma12111789
Yang, T., Wu, Q., Zhu, H., and Zhang, Z. (2017). Geopolymer with improved thermal stability by incorporating high-magnesium nickel slag. Construct. Build. Mater. 155, 475–484. doi:10.1016/j.conbuildmat.2017.08.081
Keywords: alkali activated foams, fly ash, sodium perborate monohydrate, microstructural evaluation, mechanical properties
Citation: Korat L and Ducman V (2020) Characterization of Fly Ash Alkali Activated Foams Obtained Using Sodium Perborate Monohydrate as a Foaming Agent at Room and Elevated Temperatures. Front. Mater. 7:572347. doi: 10.3389/fmats.2020.572347
Received: 15 June 2020; Accepted: 18 August 2020;
Published: 03 September 2020.
Edited by:
Jacqueline Anne Johnson, University of Tennessee Space Institute (UTSI), United StatesReviewed by:
Ping Duan, China University of Geosciences, Wuhan, ChinaCopyright © 2020 Korat and Ducman. This is an open-access article distributed under the terms of the Creative Commons Attribution License (CC BY). The use, distribution or reproduction in other forums is permitted, provided the original author(s) and the copyright owner(s) are credited and that the original publication in this journal is cited, in accordance with accepted academic practice. No use, distribution or reproduction is permitted which does not comply with these terms.
*Correspondence: Vilma Ducman, vilma.ducman@zag.si
Disclaimer: All claims expressed in this article are solely those of the authors and do not necessarily represent those of their affiliated organizations, or those of the publisher, the editors and the reviewers. Any product that may be evaluated in this article or claim that may be made by its manufacturer is not guaranteed or endorsed by the publisher.
Research integrity at Frontiers
Learn more about the work of our research integrity team to safeguard the quality of each article we publish.