1. Introduction
The Natura 2000 framework is designed to identify, maintain and protect sites of high biodiversity value [
1,
2]. Globally, Natura 2000 serves as one of the main strategies to mitigate the decline of biodiversity [
3]. Slovenia has the highest percentage of Natura 2000 sites among all EU Member States, with such sites covering almost 38% of the country’s terrestrial area [
4], with a strong prevalence of forest ecosystems within this area [
5]. The Habitats Directive [
6] requires the assessment of the conservation status of habitat types [
2], which results in an overall estimation of the habitat quality in terms of nature conservation [
7] and is usually done by implementing a specific monitoring scheme. Preserving habitats in a favourable conservation status is one of the most effective ways of maintaining biodiversity [
8], and a great deal of monitoring effort is required to achieve this important, but often challenging, goal in nature conservation.
The initial step in the monitoring process is to obtain information on where a targeted habitat type occurs. Such data serves as a baseline for all further evaluations and actions related to the conservation status of the targeted habitat, but other key factors beyond geographical location need to be considered as well. According to the Habitats Directive [
6], the conservation status of a natural habitat is determined by the sum of the influences acting on a habitat and its typical species, that may affect the habitat’s long-term natural distribution, structure and functions, as well as the long-term survival of the typical species. The following defines when the conservation status of a natural habitat is "favourable": (i) its natural range and the areas it covers within that range are stable or increasing, (ii) the specific structure and functions necessary for its long-term maintenance exist and are likely to continue to exist in the foreseeable future, and (iii) the conservation status of its typical species is favourable.
As the more extensive forest habitat types, but sometimes also small-scale habitat types, are quite heterogeneous, Kovač et al. [
9] proposed a hierarchical approach in the current concept of forest habitat types with the inclusion of the subtypes of the forest habitat type, which can be distinguished based on ecological and vegetation characteristics. Although the assessment of the conservation status should refer to the forest habitat type (by implementing appropriate indicators), this evaluation can be based on the level of habitat subtypes. In this novel conceptual framework, the habitat subtype is assumed to be much more homogeneous than the habitat type, restricted to a less broad range of ecological factors, and much more clearly defined in terms of its distribution, structure, and functions, as well as the composition of its typical species. Therefore, the assessment of the conservation status of the habitat subtype is much more accurate and reliable, allowing conservation measures to be more targeted and efficient.
A forest habitat type (hereafter HT) is a vegetation system composed of certain species that provides a living environment for various organisms. It may or may not be composed of two or more interacting forest habitat subtypes (hereafter HsTs). All forest sites that are subject to monitoring and assessment must first be identified in the field and afterwards evaluated to produce valid estimates for HT and HsT [
9].
In the mountainous regions of temperate Europe, erosion gullies, ravines, gorges, cliffs, steep rocky slopes and rocky outcrops are covered by a particular type of azonal forest vegetation, which is included in the
Tilio platyphylli–Acerion pseudoplatani Klika 1955 alliance [
10].
Tilio–Acerion forests of slopes, screes and ravines (Natura 2000 habitat code 9180*) are a priority forest HT. From an ecological perspective, forests belonging to the 9180* HT can be divided into two groups: dry and warm sites with lime trees (
Tilia platyphyllos Scop.,
T. cordata Mill.) and humid and cool sites with a dominance of Sycamore maple (
Acer pseudoplatanus L.) [
11]. On the European scale,
Tilio–Acerion forests represent an understudied and data-scarce HT and have been studied mostly using conventional phytosociological methods [
10,
12,
13]. According to preliminary estimates [
14], it was concluded that trustworthy information on the spatial distribution and characteristics of this habitat type was lacking. Owing to the limited availability of detailed maps and accurate spatial data, the assessment of the conservation status is itself rather unreliable [
5].
Evaluating the conservation status of the HT of EU interest is essential for preserving these areas in favourable conditions [
1]. Similar to more frequent forest HTs found in Slovenia, such as 91K0 Illyrian
Fagus sylvatica forests, 9110
Luzulo–Fagetum beech forests and 91L0 Illyrian oak-hornbeam forests,
Tilio–Acerion forests are facing unprecedented challenges in biodiversity conservation. Due to their small areas and the various threats, they experience, the conservation status of this HT is either unfavourable or simply unknown [
14]. Climate change, fragmentation and overexploitation have been identified as the main potential threats to the existence of this HT [
14]. According to National Forest Inventory data from 2006, only 0.04% of Slovenian forest area was covered by
Tilio–Acerion forests. Such minor HTs are more endangered than those covering larger areas.
Natura 2000 habitat types need to be mapped and monitored in order to assess their conditions [
15]. Assessing the quality of forest habitats over larger areas is a complex monitoring task [
16], particularly in the case of prominent natural heterogeneity within the habitat type (i.e., subtype variation of species composition and associated specificities). While field-based mapping of HTs represents the main pillar of conservation efforts, remote sensing techniques have been increasingly contributing to monitoring and assessing forest biodiversity-related characteristics and functions [
17,
18]. Remote sensing has a wide application in nature conservation and has a high potential for reinforced monitoring of forest habitats to support forest biodiversity assessment and sustainable forest management [
19]. Remote sensing-derived data are not only an alternative to traditional methods (in-field assessments) but can also offer complementary information when both approaches are combined [
20]. LiDAR (Light Detection and Ranging) has been frequently used for mapping natural forest habitats and their conservation status [
15,
16]. LiDAR is a data-rich source and has the potential to address some of the drawbacks associated with traditional vegetation monitoring methods, especially in remote areas [
21,
22].
In order to illustrate the characteristics of the 9180* HT and the potential for distinguishing its HsTs, a case-study was conducted in the Natura 2000 site of Boč–Haloze–Donačka gora in Slovenia. This site is representative of the targeted HT, but the degree of conservation of the natural structure and functions of the HT is lower due to a lack of adequate data and the presence of small, isolated patches in remote areas with diverse topography. According to the latest formal report for Natura 2000 [
23], the conservation status of the 9180* HT in the Boč–Haloze–Donačka gora site is unfavourable and exhibiting a declining trend. Moreover, the information on the locations and quality of the current Natura 2000 zones is inadequate, as they are defined only by the area where the HT may be located. Improving knowledge through field mapping and reliable surveys of this HT is necessary.
The primary objective of this study was to assess the conservation status of the HT and HsTs in the selected Natura 2000 site using field mapping. Additionally, the characteristics of HsTs were compared using LiDAR-derived data of the stand structure and environmental factors related to topography. The subtype approach employed in this research was intended to assist nature conservationists and forest managers in decision-making and to contribute to the sustainable management of HT 9180*. The general conservation goal is to maintain the current extent of these habitats, which requires the implementation of field mapping to determine their actual areas and the implementation of appropriate measures to maintain or improve their conservation status.
2. Materials and Methods
2.1. Study Area
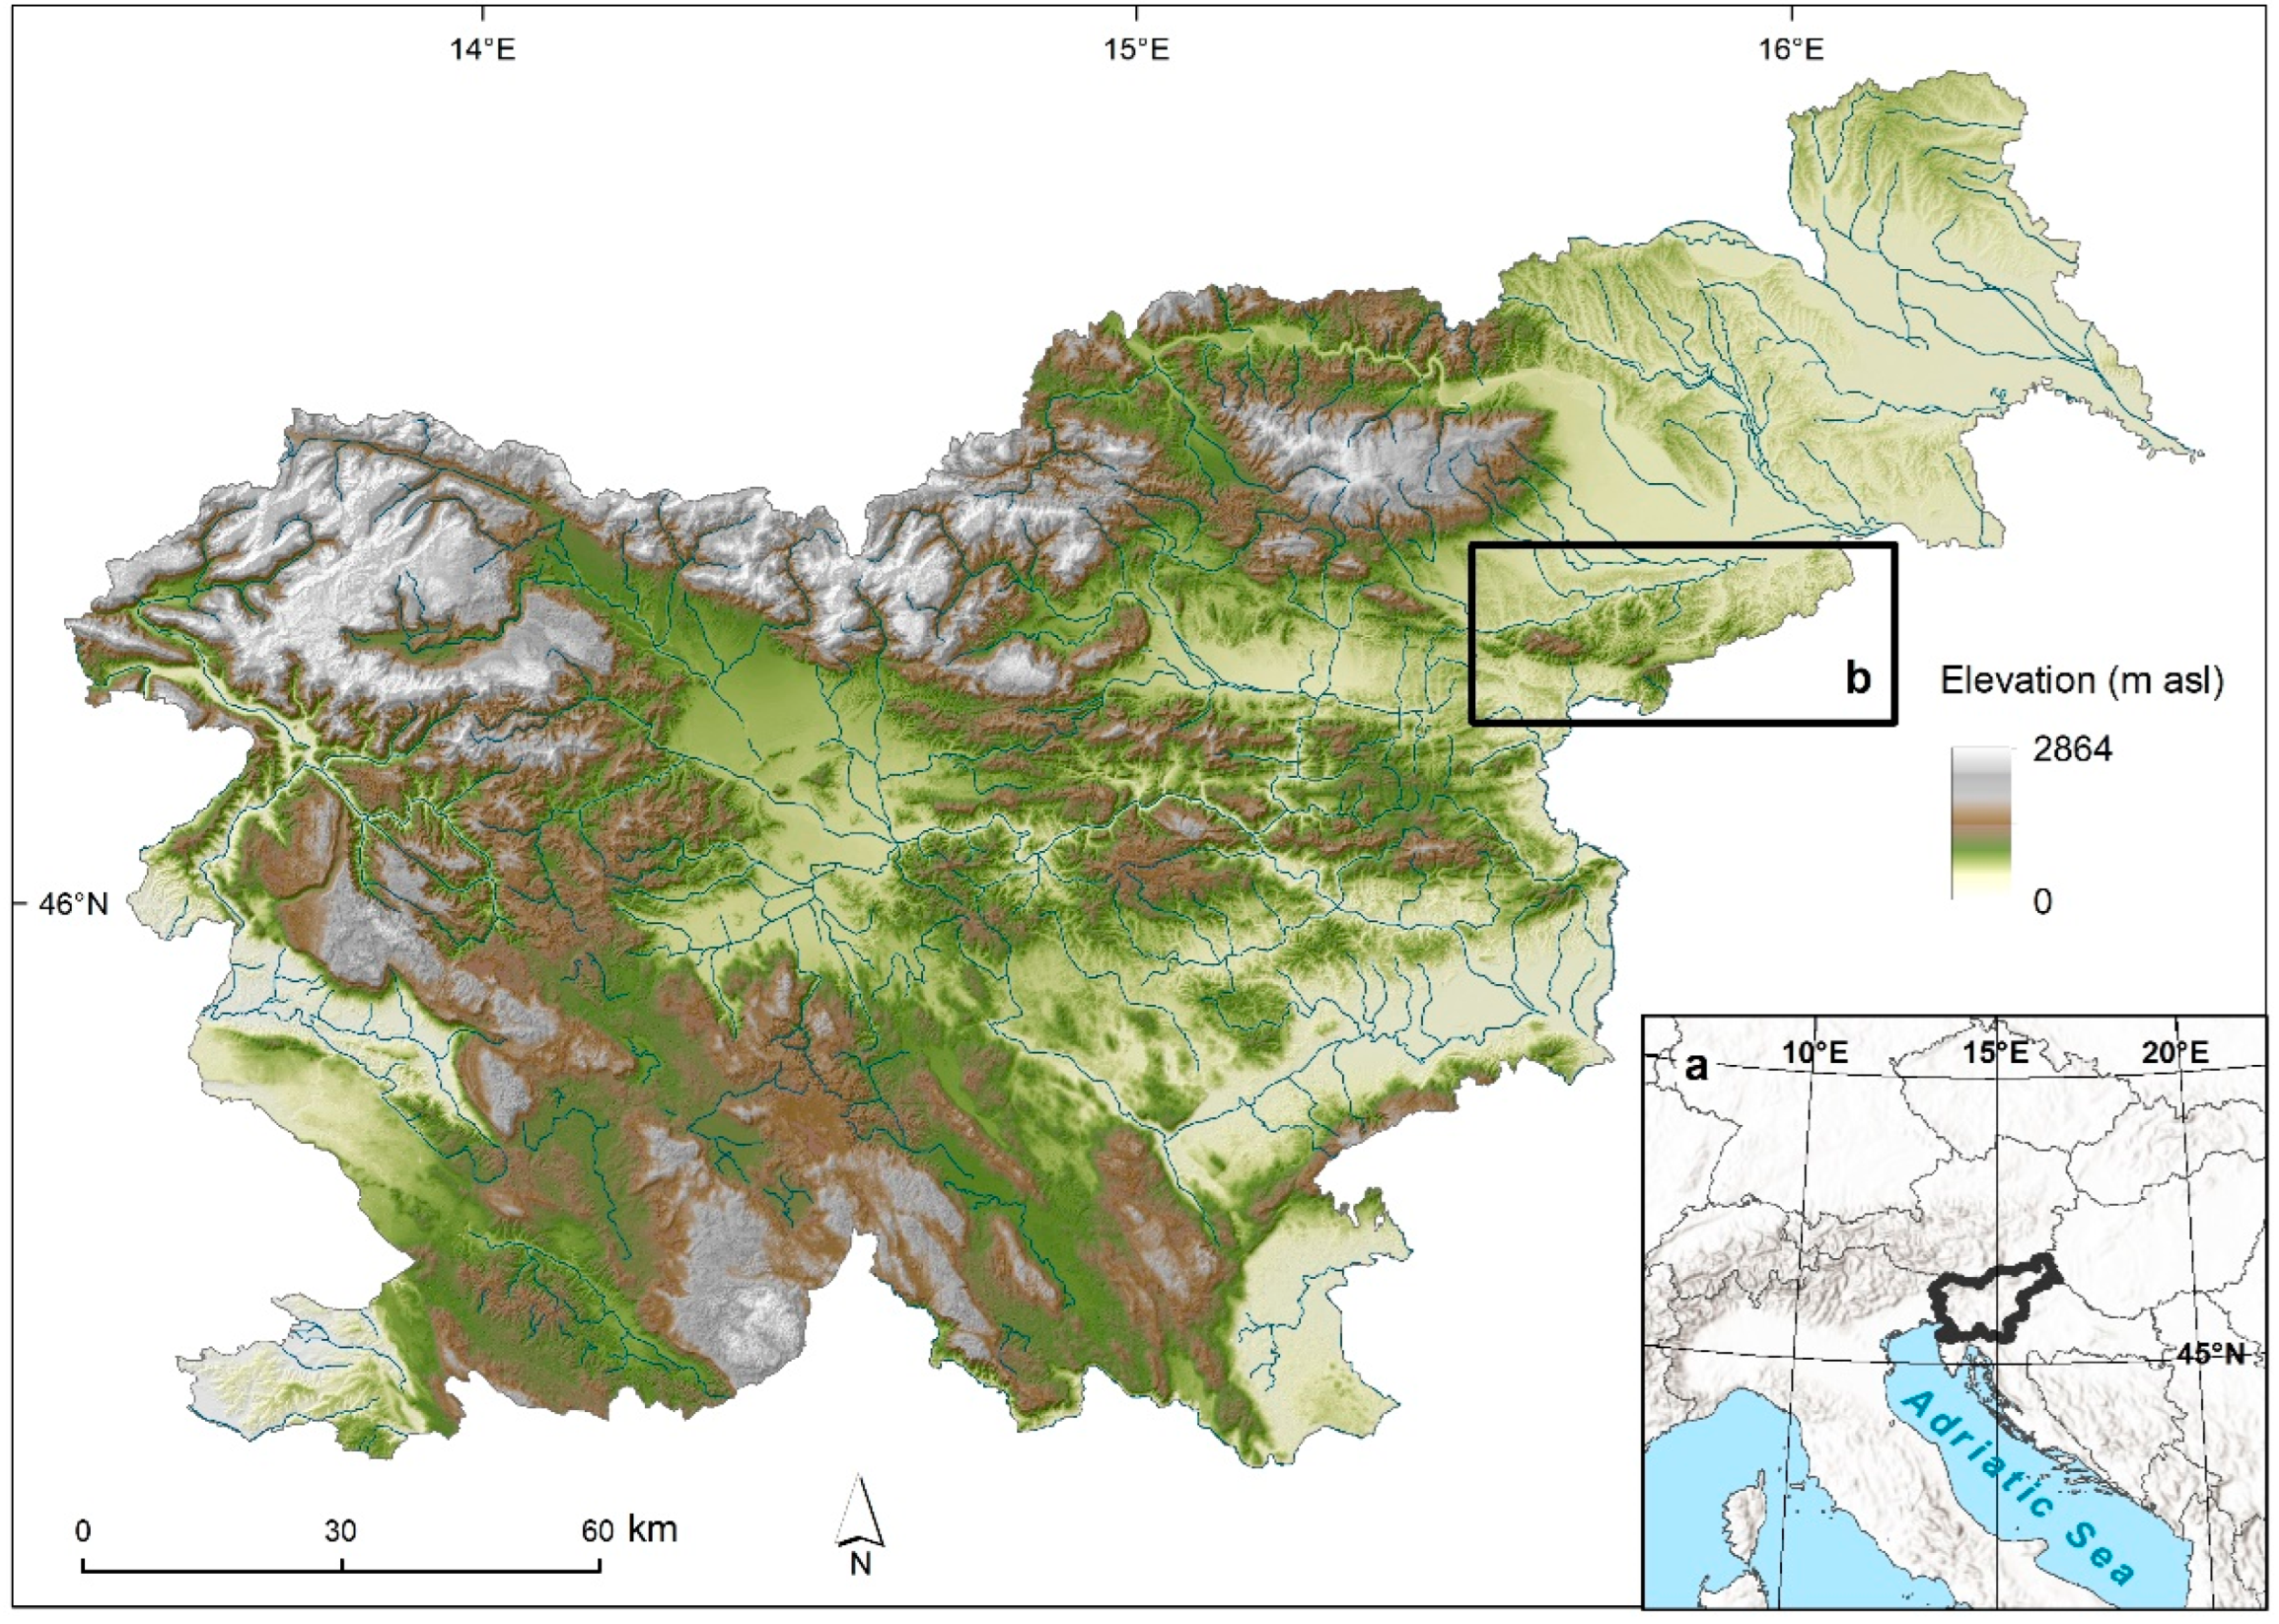
The study area was a forested landscape located in eastern Slovenia (46.294° N, 15.734° E;
Figure 1). As part of the Natura 2000 network, this site is referred to as Boč–Haloze–Donačka gora (site code SI3000118; hereafter referred to as the BHD site). The BHD site is home to 15 Natura 2000 species, including invertebrates (e.g.,
Rosalia alpina L.), mammals, amphibians and flowering plants (e.g.,
Pulsatilla vulgaris subsp.
grandis (Wender.) Zāmelis). Additionally, it serves to protect seven Habitats Directive HTs [
6].
The total surface area of the BHD site is 10,882 ha, and the area of forest zones (nature conservation units) assigned to the priority HT
Tilio–Acerion is 853 ha. The altitude ranges from 240 m (Dravinja valley) to 978 m (summit of Boč mountain). The BHD site is diverse in terms of relief and geology, resulting in a variety of forest vegetation types. The forests mainly belong to Illyrian beech forests (91K0) and central European acidophilous beech forests (9110) HT. The proportion of forest stands (forest management units) belonging to HT 9180* is 1.3% of the entire BHD site [
24]. The structural characteristics are generally favourable, such as a sufficient amount of standing or lying deadwood. However, there is a lack of younger developmental stages, although noble broadleaves often occur as pioneers on primarily beech sites [
24].
Boč mountain, which is located in the western part of the BHD site, is an isolated mountain complex with extremely diverse lithological structure and high biodiversity. Geologically and geomorphologically, it represents the easternmost part of the Karavanke mountain range. The mountain is composed of Triassic limestones and dolomites in the western part and Miocene limestones and quartz sandstones in the eastern part. The northern slopes are steeper than the southern slopes, with more than half of the surfaces having slopes of above 20°. The predominant relief forms are peaks, ridges, slopes and small plains. There is no developed river network in the area, as water quickly sinks into the karst underground on the predominantly carbonate parent material. The diversified geological and topographical conditions are manifested in a mosaic of different soil types. Brown calcareous soils, rendzina and rankers alternate depending on the parent material and slope aspect. Pseudogleys predominate on the slopes in the Haloze hills and Donačka gora (both areas located in eastern part of the BHD site), while deep soils are found on clayey and silty deposits in the valleys [
25].
The BHD site has a Sub-Pannonian climate, with the majority of rainfall occurring in spring and summer and there being a deficit in winter. Due to the higher altitudes and rugged terrain, the climate on Boč mountain is harsher compared to that of the surrounding hills and valleys. The average annual precipitation amount on Boč is around 1200 mm. Average temperatures in the growing season are around 15 °C in the Haloze hills, and only 8 °C at the top of Boč. Due to the diversity of soils and climatic conditions in the area, floristic elements of the Mediterranean, Central European, Alpine, Illyrian and steppe regions are present [
25].
2.2. Description of the Forest Habitat Type and Its Subtypes
Tilio–Acerion (9180*) forests of slopes, screes and ravines are a typical example of azonal forest vegetation. In Slovenia, they commonly occur in small areas, mainly in stony or rocky gullies, in dolines, other depressions and ravines, on torrential fans, and on the gravelly bases of slopes, but also on moist rocks and more sun-exposed ridges at an altitude from the colline to the altimontane vegetation belts [
26]. The soil types in these forests are colluvial–deluvial soils, rare rendzinas and brown calcareous soils, and sometimes also dystric brown soils and ranker or eutric brown soils. They are usually biologically very active, with relatively fast decomposition of litter resulting in high nutrient availability in the soil. These forest stands occur on sites that can be quite extreme for the growth of forest vegetation (i.e., very rocky and steep; [
26]). Forest stands belonging to HT 9180* have important nature conservation features and are particularly relevant as habitats for rare and protected plant species and other organisms [
5]. Within the EUNIS habitat classification [
27,
28], these forests are classified as Illyrian ravine forests (code T1F63), but the current classification scheme does not include more detailed information at the subtype level.
The tree layer of these forests is composed of noble broadleaves, such as sycamore maple (
Acer pseudoplatanus), Norway maple (
Acer platanoides L.), wych elm (
Ulmus glabra Huds.), European ash (
Fraxinus excelsior L.), large-leaved lime (
Tilia platyphyllos) and small-leaved lime (
Tilia cordata). Floristically, these forests are relatively similar to beech communities, but they have a greater abundance of hygrophilous and nitrophilous plant taxa. The diagnostic species of the understory layer are mainly mesophilous tall forbs and ferns that have high requirements for nutrients, soil moisture and air humidity, such as
Lunaria rediviva L.,
Asplenium scolopendrium L.,
Polystichum setiferum (Forssk.) Woyn. and
Urtica dioica L. Forests dominated by
A. pseudoplatanus occur on colder and wetter sites, while slightly more thermophilous
Tilia forests exhibit a higher proportion of plant species indicating a warmer and drier microclimate [
26]. In this part of Europe, their phytogeographic differentiation from similar forest plant communities in Central Europe is further promoted by the presence of some relict and endemic Illyrian species that survived the Quaternary glaciations in southern European refugia, including typical forest herbs, such as
Lamium orvala L.,
Stellaria nemorum subsp.
montana (Pierrat) Berher,
Cardamine waldsteinii Dyer. and
Scopolia carniolica Jacq. [
10].
Forests of the
Tilio–Acerion HT encompass diverse site and stand conditions, covering a broad ecological amplitude and an array of forest associations. Whenever an HT displays such heterogeneity, dividing it into HsTs is meaningful and can substantially increase the identification and conservation of the entire HT [
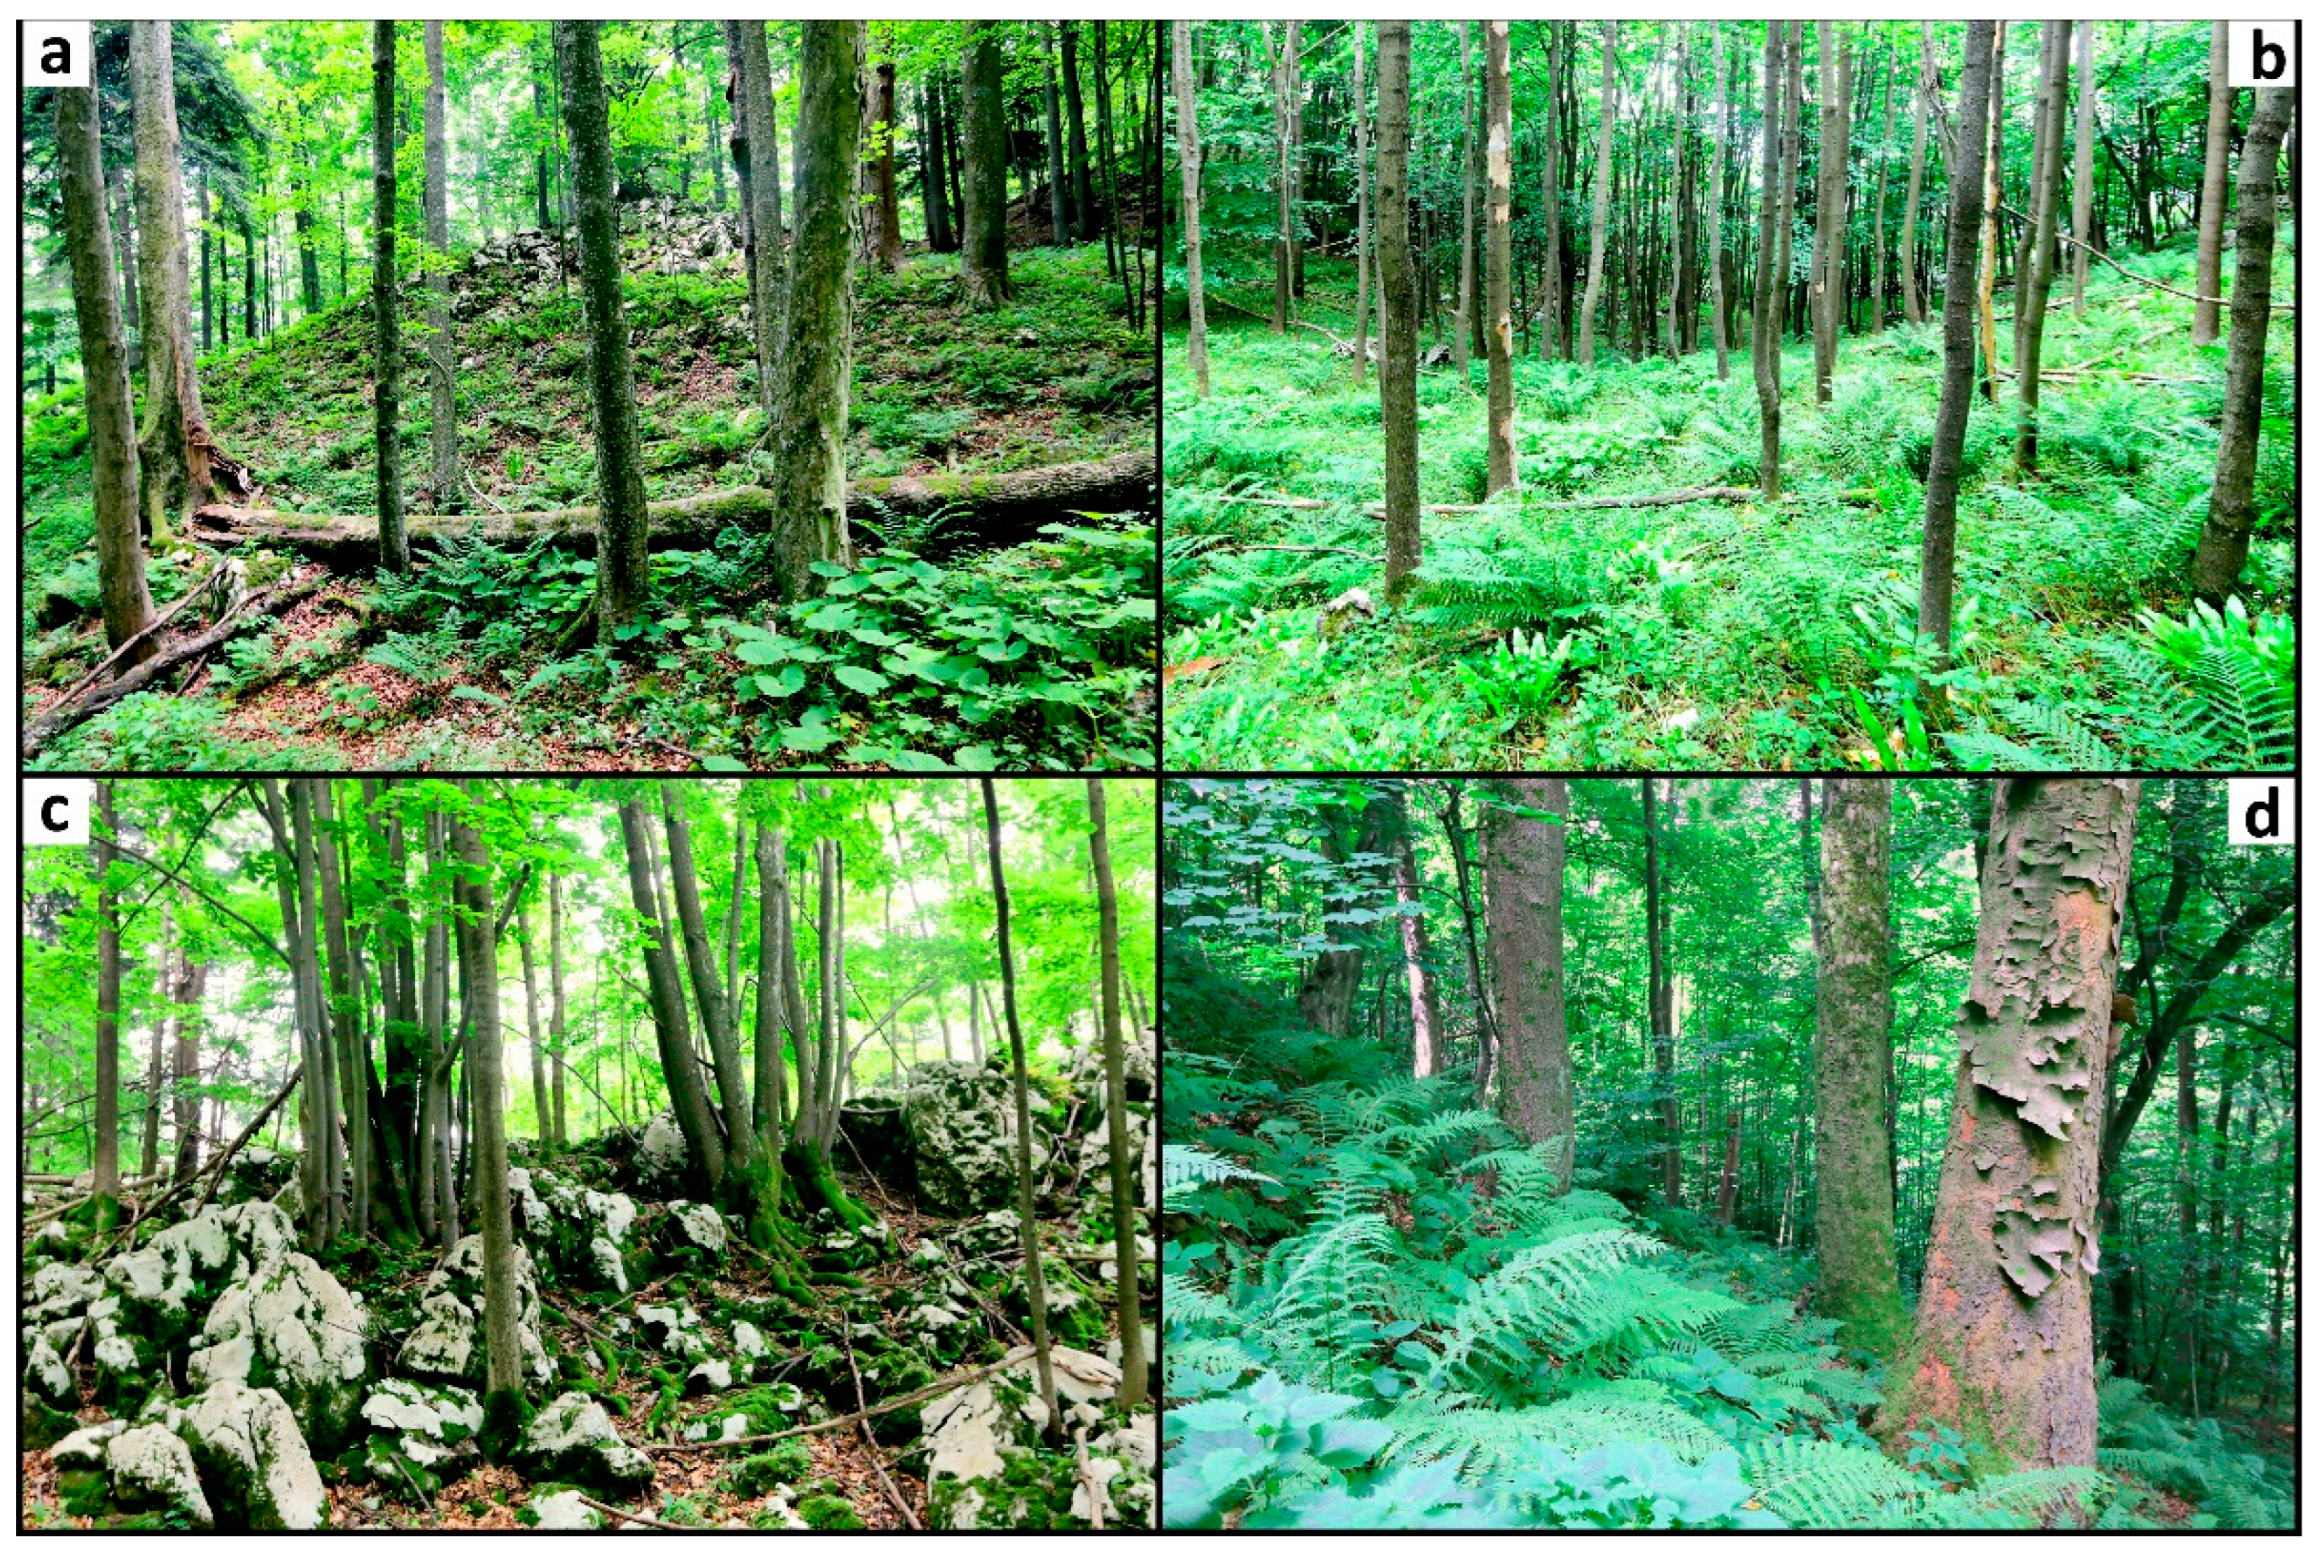
9]. We divided the studied HT 9180* into four pre-defined, relatively homogeneous HsTs. The subtypes were defined based on established forest communities (associations), adopting the classification described in up-to-date phytosociological literature [
26,
29]. Following the classification from the Typology of Forest Sites in Slovenia [
30], the four subtypes were
Acer pseudoplatanus-Ulmus glabra forest stands, growing mostly in concave terrain (hereafter referred to as subtype A;
Figure 2a),
Fraxinus excelsior stands, growing on slopes (hereafter referred to as subtype B;
Figure 2b),
Tilia sp. Stands, with thermophilous broadleaves occurring on exposed ridges and slopes (hereafter referred to as subtype C;
Figure 2c), and
Acer pseudoplatanus stands, occurring on more acidic soils with frequent admixture of
Castanea sativa Mill. (hereafter referred to as subtype D;
Figure 2d).
2.3. Data Collection
In the summer of 2020, we conducted field mapping of the entire study area. All activities were coordinated within the framework of the LIFE Integrated Project for Enhanced Management of Natura 2000 in Slovenia. Our fieldwork primarily focused on the existing (official) Natura 2000 zones of HT 9180*.
Forest stand data from the Slovenian Forest Service database [
31] were used as the basis for field mapping. Managed forest stands, with a proportion of noble broadleaves of more than 30% in the total growing stock, were checked, as well as forest reserves (old-growth forests). In the field, a group of trained and calibrated field mappers checked the already known or existing HT 9180* zones and then searched for, and mapped, stands classified under this HT. We used a 0.5 m resolution digital orthophoto (DOF) as the basis for drawing the boundaries of each polygon (i.e., homogenous mapping entity) in the field. The field mapping was carried out at a scale of 1:5000. Each mapped polygon was assigned to one of the four HsTs described in the previous subsection.
For each of the mapped polygons, we estimated important site, stand and nature conservation characteristics, which are explained in more detail in the following section. Tree species composition was evaluated by recognition of each individual tree species and by visually estimating the proportion (%) of noble broadleaves in the total tree layer cover. Additionally, the tree regeneration layer was inspected by identifying the most frequent tree species in the herb (height below 0.5 m) and shrub (height above 0.5 m and below 5 m) layers. The dominant relief form was determined for each polygon, distinguishing between several categories, as follow: flat relief, ridge or top of a hill, slope, bottom of a concave landform, such as a doline, and ditch. Surface rockiness/stoniness was estimated (% of surface covered by rocks/stones), a feature generally associated with bedrock, soil type and topography. The risk levels of various pressures and threats for HsT conservation status were estimated, distinguishing between tree mortality of key tree species, game browsing of juvenile trees, soil disturbance and tree damage due to forest management operations, presence of forest roads, and occurrence of invasive alien species. Based on these threats, and the previously described forest stand and site parameters, the overall estimation of the conservation status of each mapped polygon was determined (favourable, unfavourable or poor status). To summarize, the most important criteria used during the field mapping for assigning polygons to a specific subtype were the following: (i) dominant tree species, (ii) tree species composition, (iii) understory vegetation (vascular plants present in the shrub and herb layer) composition and cover, (iv) tree regeneration layer, (v) dominant relief type, (vi) bedrock type, rockiness/stoniness, and (vii) soil type. For the field mapping of habitat (sub)types, we used a simplified, faster method based only partly on a phytosociological approach, focusing on tree species composition and some characteristic plant species. Screening of vegetation composition, site conditions and conservation status was conducted in a few sampling points randomly distributed across the area of the mapped polygon. The number of sampling points was proportional to the size of the polygon, i.e., more sampling points were selected in larger polygons.
With respect to remote sensing data, LiDAR (ALS – airborne laser scanning) data [
32] were collected during the period between 12 March, 2014, and 20 October, 2014. The flight took place at an altitude of 1200 to 1400 m above the ground.
2.4. Data Preparation and Analysis
For data obtained during field mapping, we constructed three binary (0/1) matrices with polygons in rows and descriptive variables in columns. The first matrix was for the tree species composition, where the following species, or species groups, were distinguished: Acer pseudoplatanus, A. platanoides, Fraxinus excelsior, Ulmus glabra, Tilia platyphyllos, T. cordata, Fagus sylvatica L., Picea abies (L.) H. Karst., Castanea sativa, thermophilous broadleaved trees (e.g., Ostrya carpinifolia Scop., Sorbus aria (L.) Crantz, Fraxinus ornus L.) and a group of other trees species (species such as Abies alba Mill., Prunus avium (L.) L. and Carpinus betulus being the most frequent).
The second matrix included data on relief, rockiness/stoniness and soil type. For relief, five categories were distinguished: flat surface, ridge or top of a hill, slope, bottom of concave landform, such as doline, and ditch. Rockiness/stoniness was classified into one of the following five classes: 0%–5%, 5%–10%, 10%–30%, 30%–50% and higher than 50%. Soil data were derived from the Slovenian pedological map 1:250,000 [
33] and four soil types were distinguished: brown soils on limestone and dolomite, rendzina, ranker and eutric brown soil. As the soil types often changed over small distances, and some polygons were spread over larger areas with different soil types, the classification of soil types was done by fuzzy logic, with row sums in the matrix equal to 1.
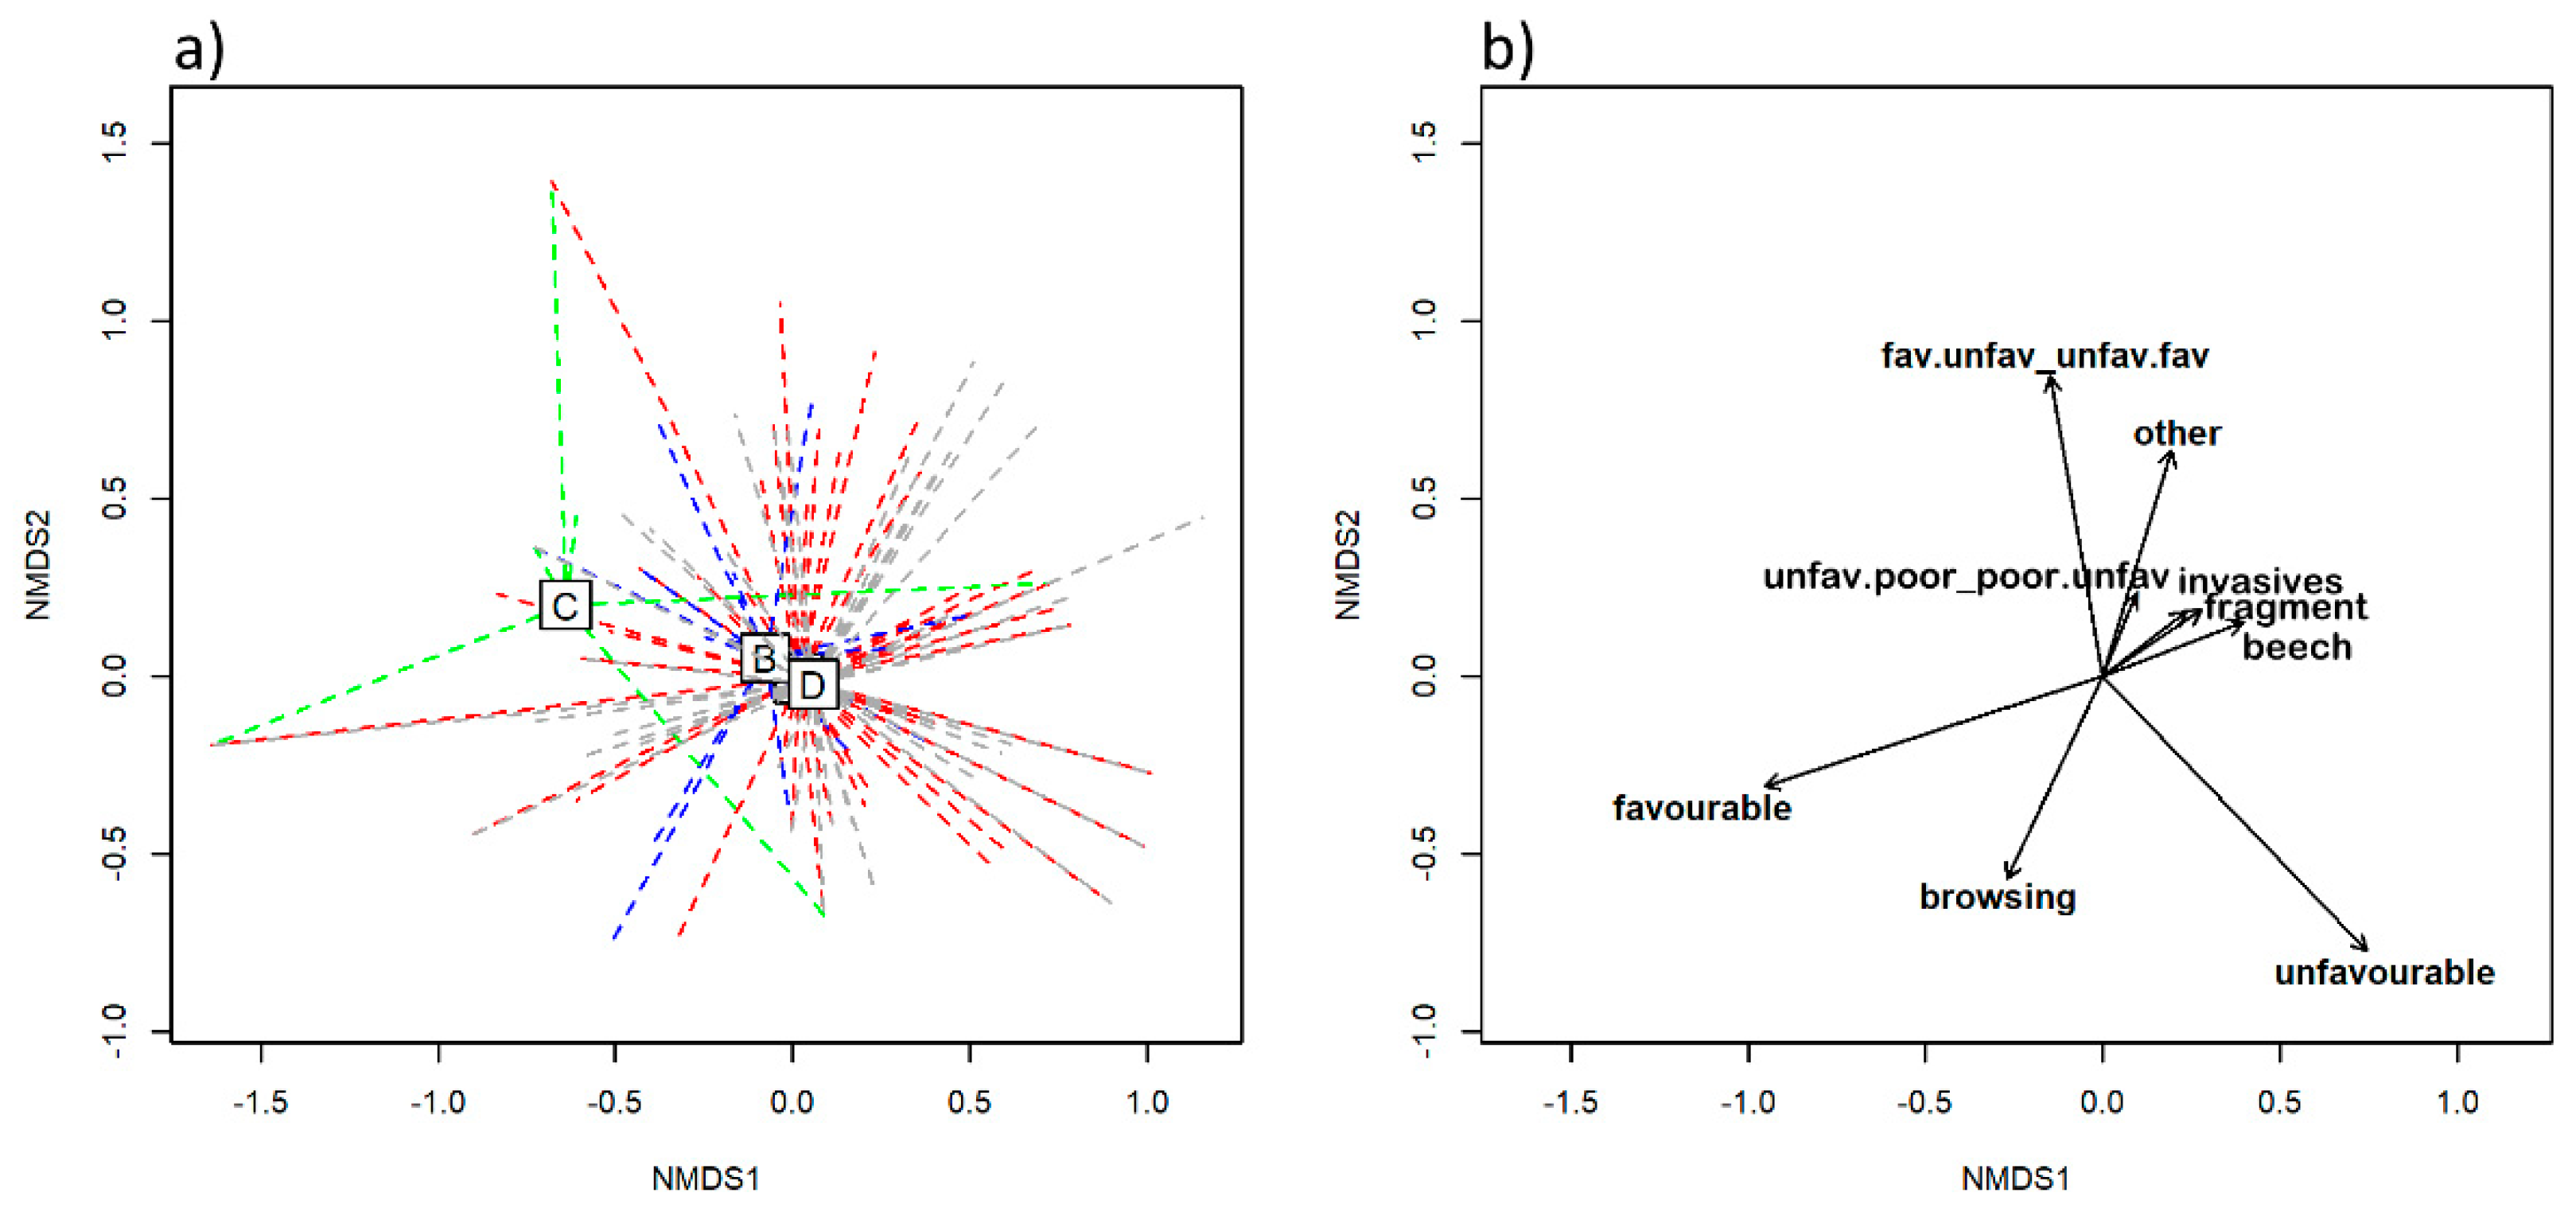
The third matrix was associated with the threats and conservation status of the HsTs (polygon). For threats, we identified seven main categories: game browsing (e.g., visible damage on shoots, leaves and stems of young trees by wild ungulates, most often in the form of deer herbivory and bark stripping), tree mortality of key tree species (e.g., the presence of standing and lying dead trees, the presence of trees with severe crown damage with more dry branches without leaves), small or fragmented area (e.g., smaller patches of HsTs, polygons with a diameter of less than two forest stand heights (ca. 40–60 m) of the surveyed stand), beech competition (e.g., proportion of Fagus sylvatica in the mapped polygon greater than 50% of the stand growing stock), impact of forest roads (e.g., distance to the nearest forest road less than one forest stand height (up to ca. 30 m)), presence of invasive alien species (e.g., one or more individuals of invasive alien plant species present either in the tree or understory layer) and other threats, e.g., altered tree species composition (proportion of tree species unsuitable for local site conditions being more than 50% of the stand growing stock; in most cases, this was Picea abies), and competitive pressure for tree seedlings and saplings from dense herbaceous vegetation.
The conservation status of the polygon was evaluated as either favourable, unfavourable or poor. The conservation status of the stand in the studied polygon was favourable when the tree species composition was preserved, where regeneration of the key tree species occurred and where there were no obvious pressures or threats to the habitat type. Unfavourable conservation status was determined when only one or two less intense pressures or threats to the habitat type were evident (e.g., partially altered tree species composition, minor crown damage from disease, lack of juvenile stages of key tree species, minor damage to young trees from deer, and insignificantly eroded soil from human activities). The conservation status of the stand was poor when multiple negative factors that posed a serious threat to the long-term existence of habitat type were clearly evident. In addition, two transitional categories were also used: favourable/unfavourable (or unfavourable/favourable) and unfavourable/poor (or poor/unfavourable), resulting in a total of five different categories for the overall estimation of conservation status.
All statistical analyses were performed in the R programming environment version 3.5.2 [
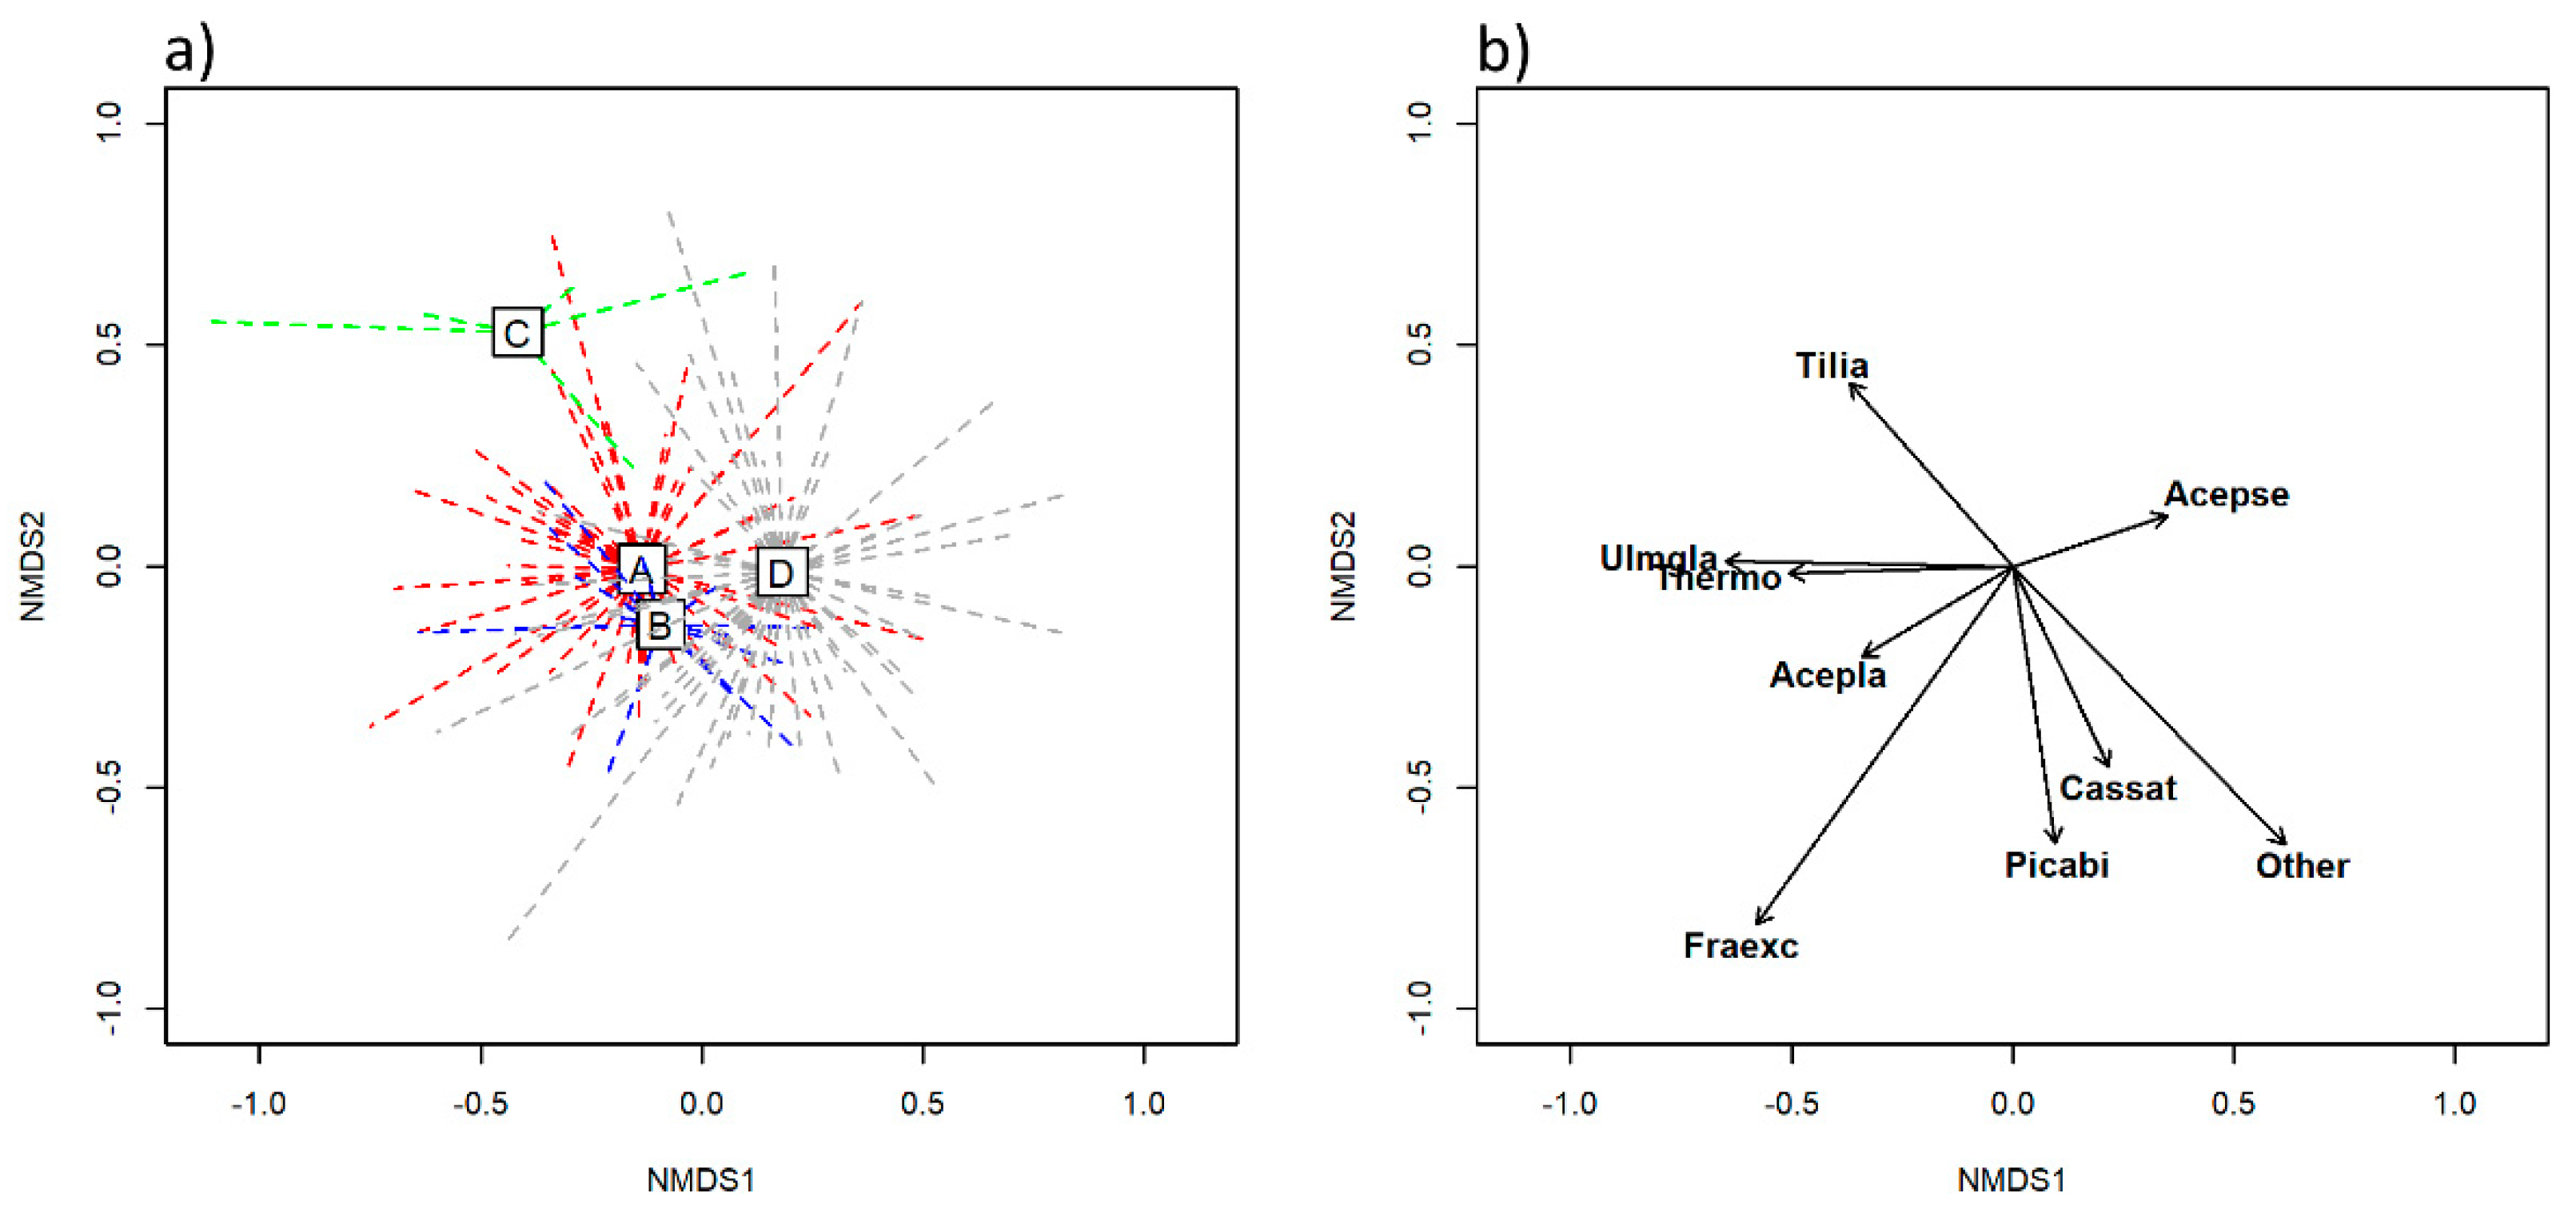
34]. A Non-metric Multidimensional Scaling (NMDS) ordination was performed on each matrix, and the results were illustrated in an ordination diagram. The NMDS ordinations were performed in the
vegan R package [
35]. The distance matrix was first calculated with the Jaccard dissimilarity index for binary data using “vegdist” function in the
vegan package. Then, the distance matrix served as an input for the NMDS ordination. We considered the first two dimensions, since they resulted in a good fit according to the stress values. To quantify the influence of different explanatory variables, the ordination graphs were overlaid with explanatory variables. Significant variables (
p < 0.05) were projected onto the NMDS biplots by passive fitting. To test whether subtypes differed significantly, in terms of tree species composition and other explanatory variables (relief, soil, threats and conservation status), we employed a permutational multivariate analysis of variance (PERMANOVA; [
36]) with 9999 permutations (
vegan package, function “adonis2”). This statistical method uses a permutation test with pseudo-F ratios. In the case of significant PERMANOVA results, pairwise multilevel comparisons (testing which groups differed from each other) were performed by using a wrapper function, “pairwise.adonis2” [
37].
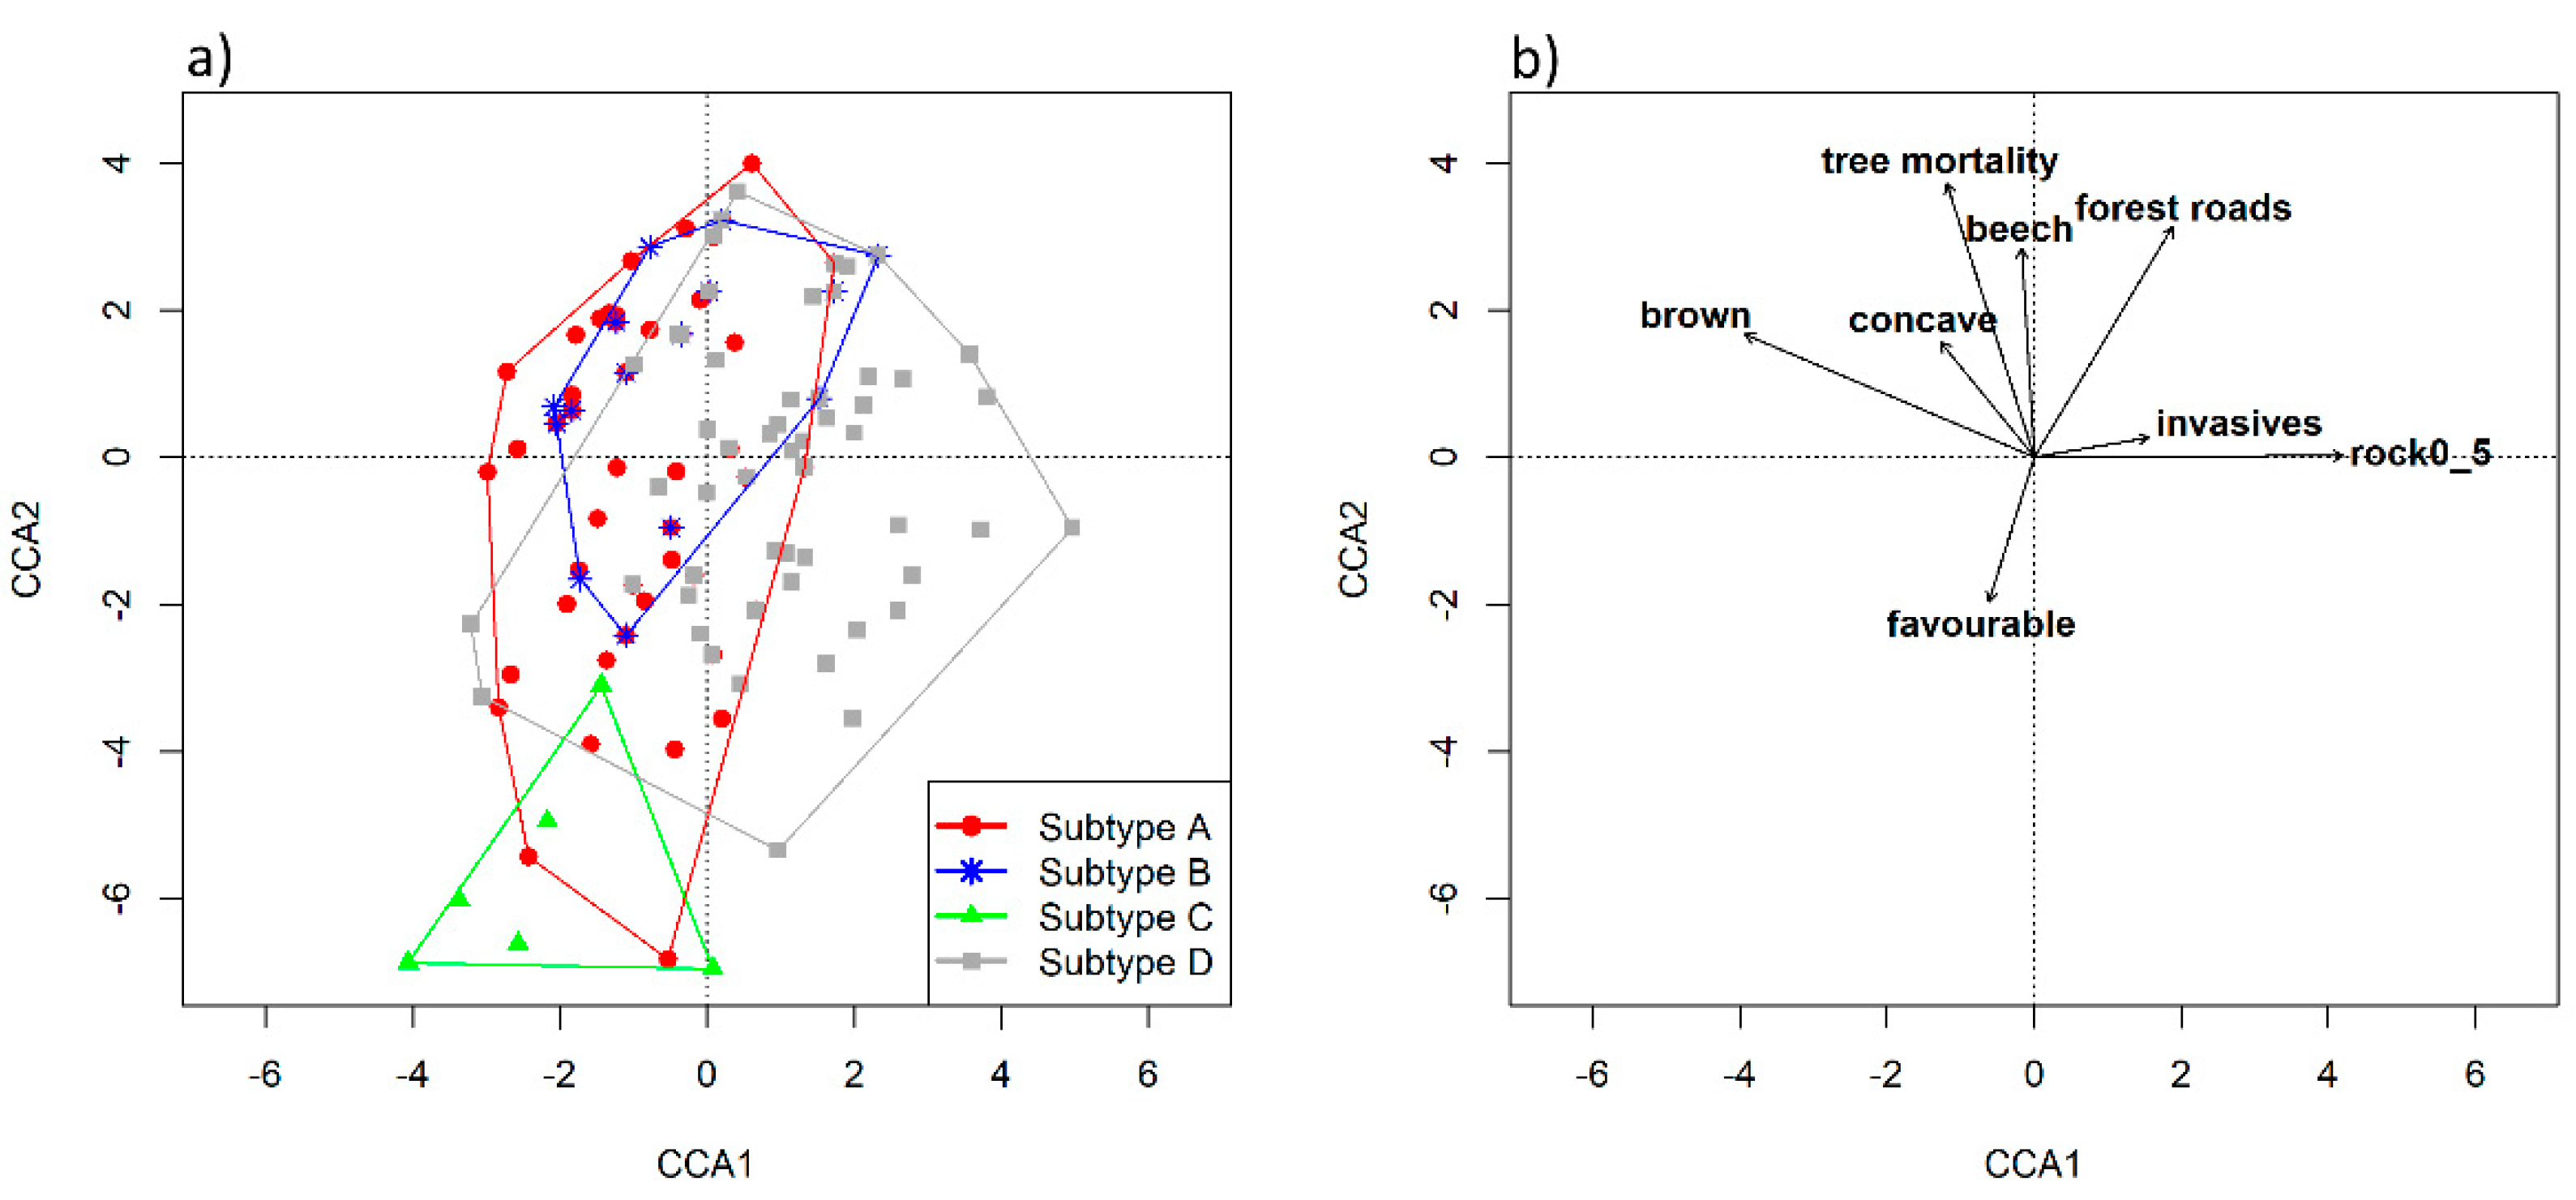
Canonical correspondence analysis (CCA), as a constrained ordination [
38], was performed to explore the relationships between tree community and environmental variables. The tree species data were used as a dependent matrix and the other two datasets were used as predictors. We opted for a stepwise selection of significant explanatory variables, starting with an intercept-only model and, then, sequentially adding significant terms at each step, based on an ANOVA-like permutation test [
39]. This procedure of model selection was based on Akaike’s information criterion. Additionally, we calculated the indicator value of tree species in each subtype by using a statistical method proposed by [
40], implemented in the
labdsv R package [
41]. Since the conservation status formed a core concept in our study, additional descriptive statistics of categories describing the conservation status of the studied subtypes were performed.
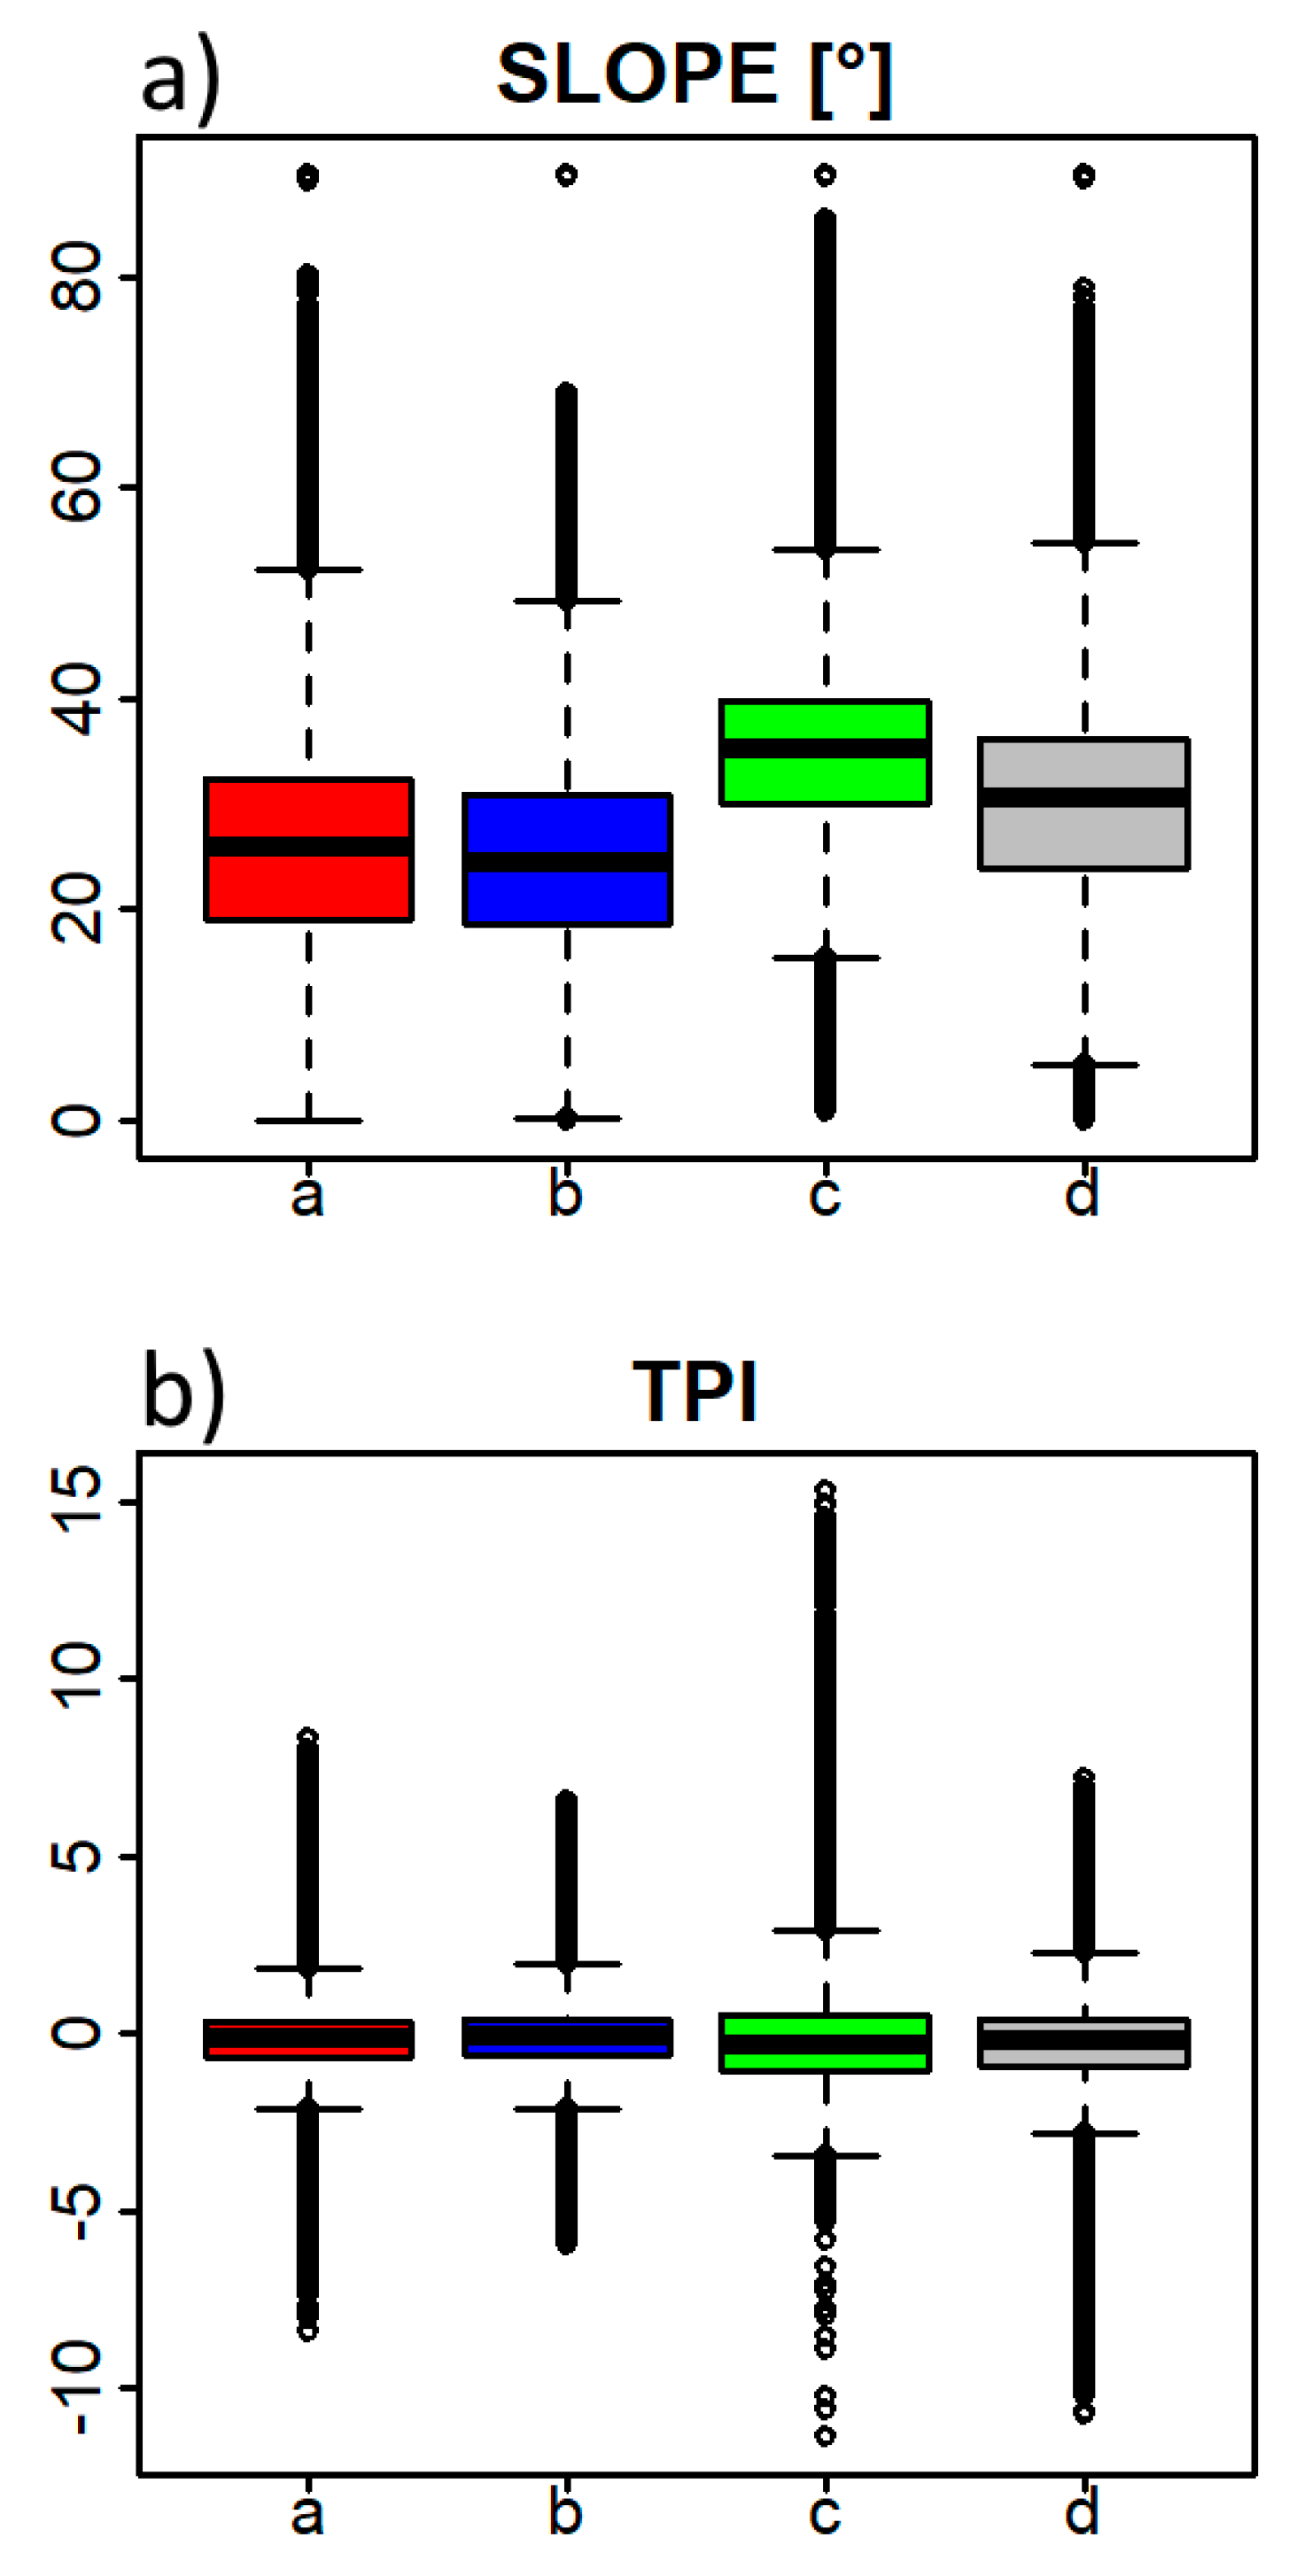
ALS-derived data were analysed in the post-mapping phase. We first intersected the field-mapped polygons (shapefile creation by digitalization in the ArcGIS 10.6.1. software [
42] with two layers: terrain steepness (SLOPE, in degrees) and Topographic Position Index (TPI, unitless variable). The 1 × 1 m resolution TPI and SLOPE were both derived from ALS raw data [
32] with a point density of 2 to 10 per m
2 and a relative horizontal and vertical accuracy of 0.30 and 0.15 m, respectively, and calculated using SAGA GIS and ArcGIS software (tools used: Slope and Terrain Analysis: Topographic Position Index). In the case of TPI, higher values denoted convex topography (ridges, summits), whereas lower TPI values denoted concave terrain (dolines, erosion gullies). The window within which the grid cell values were calculated had a radius of 20 m.
For each pixel (grid cell) in 1 × 1 m resolution, we extracted a value for SLOPE and TPI (each cell containing one value). This was done by implementing the function “extract” in the
raster R package [
43]. Boxplots were constructed for each parameter and a one-way Analysis of Variance (ANOVA) with Tukey post-hoc procedure was implemented to test the differences between the four habitat subtypes.
4. Discussion
Proper management of Natura 2000 HTs requires improved knowledge on their ecological characteristics, spatial distribution and conservation status [
5]. This study addressed the potential of field mapping of forest stands, based on vegetation typology and ALS-based characterization, to reveal the multi-faceted differences between the habitat subtypes (HsT) of the Natura 2000 priority habitat type
Tilio–Acerion (9180*). Although these stands covered rather small areas, we discovered substantial variation between HsTs. Since the
Tilio–Acerion forests are relatively heterogeneous in terms of ecological conditions, the approach based on HsTs could contribute to more reliable conservation assessment and management of an entire HT.
In the BHD Natura 2000 site, we found that the four pre-defined HsTs differ in the majority of the investigated features. The most abundant HsT, covering the largest area, was subtype A (stands dominated by Acer pseudoplatanus and Ulmus glabra), followed by subtype D (occurring on more acidic soils compared to the other three subtypes). We mapped only seven (out of 174) stands assigned to subtype C (Tilia platyphyllos and T. cordata as the dominant overstory tree species). These results indicated that the HsTs of the 9180* HT were unevenly represented in the studied site. Furthermore, the average area of mapped polygons varied significantly. It is, therefore, important to use a spatial resolution which can detect subtypes covering smaller areas, such as subtypes C and B in our case.
The four HsTs differed most significantly in terms of tree species composition, as demonstrated by the results derived from the NMDS and CCA. Tree species composition has been established as a cost-effective and easy-to-obtain indicator, with high predictive power in forest ecosystems [
8,
14] and can serve as an important starting point for assessing the conservation status of a forest HT [
5,
44]. Despite significant differences in tree species composition between the four HsTs, it is important to note that many noble broadleaves, which are diagnostic species of
Tilio–Acerion forests, occur in different subtypes and are not strictly confined to a particular subtype. Some of the tree species were identified as good indicators of certain HsTs, according to the IndVal analysis. For example, the tree layer of even-aged forest stands assigned to subtype B was usually strongly dominated by
Fraxinus excelsior. Similarly,
Tilia platyphyllos and
T. cordata were rarely found in subtypes other than subtype C, which frequently exhibited an admixture of thermophilous broadleaves. On the other hand, subtype A did not have any significant tree indicator species, which could be attributed to the normally diverse tree species composition of forest stands in this HsT (frequent admixture of
Ulmus glabra and
Fagus sylvatica).
Acer pseudoplatanus was present in all subtypes, except subtype C. However, it was identified as an indicator species for subtype D, as shown by the IndVal analysis. Compared to subtype A, stands of subtype D were often composed of a pure
A. pseudoplatanus overstory layer with a smaller admixture of codominant tree species linked to more acidic soil types. Among the subordinate tree species, some could be even used as differentiating species between subtypes. In our study area, this was true for
Castanea sativa, which was never present on pure calcareous soil and was only present in subtype D (clearly supported by the IndVal analysis). Likewise,
Prunus avium was also frequently present in stands belonging to subtype D, as these were mainly mapped at lower elevations in the eastern part of the BHD site (i.e., Haloze hills).
With respect to the tree species composition, we noticed that a substantial proportion of mapped stands (with the exception of subtype C) exhibited deviation from the natural or desired species composition in the tree layer. The degree of representativeness of tree species composition was used as one of the core factors for evaluating conservation status during field mapping. Two distinct patterns were identified. Firstly,
Tilio–Acerion forests in the BHD site were embedded within a large matrix of prevailing
Fagus sylvatica forests. The threat of beech competition was identified as one of the variables explaining the variation in tree communities between different HsTs (CCA results). In our study area, the 9180* HT was preserved to a greater extent where beech was not competitive. Beech is especially competitive in the regeneration layer, where it can outperform noble broadleaves, due to its high shade tolerance. Secondly, altered tree species composition, in the form of a substantial proportion of
Picea abies, was a consequence of past forest management. Norway spruce was often planted on forest sites with high soil productivity, where noble broadleaves would naturally dominate. Such human-induced alterations of tree species composition decreased forest naturalness. Altered tree species composition significantly affected the diversity and composition of understory strata and other trophic levels (animals, fungi), and posed a threat to the conservation of the studied HT and its HsTs. A relatively large proportion of spruce in the growing stock was among the main factors indicating the poorer conservation status of this HT. This seems to be a problem for the majority of
Tilio–Acerion forests in Slovenia. Based on analyses of data from the Slovenia Forest Service, Kutnar et al. [
14] found that
Picea abies accounted for as much as 40% of the total growing stock and
Fagus sylvatica 25% of the total growing stock in Slovenian
Tilio–Acerion forest stands. In addition, low vitality, or even complete dieback of edificator tree species, was another contributing factor to the higher discrepancy between the naturally-preserved state of forest stands and observed situations in the field, and, consequently, to poorer conservation status.
Data acquired during field mapping showed that the four subtypes differed in terms of relief features, rockiness/stoniness and soil conditions. These three parameters were intercorrelated. For instance, subtype C, occurring on ridges and steep slopes, also had a higher proportion of rocks/stones on the surface and more shallow soil (e.g., rendzinas). In concave landforms (e.g., dolines), where subtype A was most often found, deeper soil types were formed, such as brown calcareous soils. For subtype D, a general pattern was that it occurred on more eutric brown soils with lower soil pH compared to the other three soil types. The main difference between carbonate (limestone) parent material and mixed or silicate parent material could be quite easily recognized in the field with respect to how much of the surface was covered with rocks and/or stones. All these topographic and soil parameters could serve as surrogates for identification, and differentiation, of HsTs during field mapping. However, the same subtype could vary significantly, and different subtypes, distinguished on stand characteristics (tree species composition), could share similar topographic and soil properties, as these usually change at fine spatial scales.
Even greater similarity between HsTs was found for pressures and threats and the overall evaluation of conservation status. Subtype C somewhat exhibited the most favourable conditions, despite its low frequency of occurrence. This was related to the fact that
Tilia sp. forest stands were mainly found in more remote areas where anthropogenic pressures were less likely to influence the natural development of forests. We confirmed that among various threats to the conservation status of HsT, habitat fragmentation was common to all subtypes, and stands covering larger areas were rarely found. Small HsT were additionally under pressure because of other threats. Game browsing could be seen as an omnipresent pressure that prevents the ingrowth of key tree species into shrub and tree layers. The Boč mountain is a central area of the mouflon (
Ovis musimon Pallas) population, a non-native animal species introduced decades ago but preserved for hunting. This species, along with indigenous deer species, represents an important negative factor in the natural development of forests, due to their browsing and worsening of the ecological conditions of native species in the entire BHD site and, particularly, on Boč mountain [
25]. Complementary inputs are required from all stakeholders (i.e., foresters, hunters, forest owners, conservationists) to solve the problems of wildlife management [
45]. Natural regeneration of site-adapted tree species is key for preserving the favourable conservation status of the HT. A deficit of natural regeneration is a major long-term threat to the studied HT because it defines the tree species composition of mature stands, a feature for which we demonstrated a high importance in the overall identification of the 9180* HT and its subtypes.
Among the most significant threats that contributed to the differentiation between HsT were also invasive alien plant species and pathogens causing tree mortality. Robinia pseudoacacia L., known for its invasive potential in a wide range of forest communities, was present as an overstory subordinate species in a few surveyed forest stands, followed by non-native conifers Pseudotsuga menziesii (Mirb.) Franco and Pinus strobus L. (both artificially promoted by planting). The most frequently recorded invasive plants in the understory layer were fast-growing ruderals Erigeron annuus (L.) Desf. and Impatiens parviflora DC., but their abundance was rather low in the mapped polygons. The occasional occurrence of these invasive plants was mainly restricted to forest roads, skidding trails and disturbed stands with less canopy closure, as these plants are successful colonizers in canopy gaps with modified ecological conditions. The degree of invasiveness of neophytes should be monitored in the future, as they are often one of the main management concerns.
A major problem for European ash (
Fraxinus excelsior) is the invasive fungal disease known as ash dieback (
Hymenoscyphus fraxineus). The threat of tree mortality was among the leading factors explaining tree community composition (see CCA results). It was noted for almost every forest stand belonging to subtype B and often in other subtypes with the presence of individual European ash trees. This pathogen is a pressing conservation biological challenge throughout Europe [
46], as it lethally affects ash trees of all age classes and tree mortality levels are high. Other tree species have also been threatened by widespread pest infestations. Dutch elm disease (
Ophiostoma novo-ulmi) has long been a threat to
Ulmus glabra trees in the temperate zone.
The relatively unfavourable conservation status of the
Tilio–Acerion forests in the BHD Natura 2000 site results from a complexity of many different negative factors and their interactions. Pressures from fragmentation, hampered natural regeneration, mortality of key tree species and an unsuitable ratio between developmental (successional) phases [
14] pose a serious risk to the studied 9180* HT and, ultimately, undermine the integrity of the existing habitat type to such a degree that the development of a new trajectory is inevitable. As discussed for the 91K0 HT and its HsT [
2], it is possible to predict that shade-tolerant beech is likely to prevail over time if regeneration patterns do not change and deer herbivory does not diminish. Forest stands currently composed of noble broadleaves could be replaced by competitively superior beech in the future. Therefore, effective conservation strategies starting with local site-adapted management measures are urgently needed. To ensure the favourable conservation status of the HT, appropriate management and restoration actions should be implemented regularly [
47], and, in the case of
Tilio–Acerion forests, preferably at the level of HsTs.
Forest stands assigned to the
Tilio–Acerion HT are interesting for both timber production (valuable timber of noble broadleaves) and biodiversity conservation. It is, thus, imperative that the goal-setting process becomes more subtype-specific, aiming at finding trade-offs between economic and biodiversity forest functions. Differentiating between HsTs can contribute to the more sustainable management of these forest stands. Similar to the conclusions made by Kovač et al. [
2], we believe that unified management approaches simply do not work because they provide different outcomes in habitat subtypes with different ecological backgrounds, stand characteristics (tree species composition), topographic factors and other specificities (threats in the form of biotic and abiotic stressors) and, thus, in management applications. If the stands belonging to HsTs and forest associations alone are considered as conservation units, and their biodiversity portrayals need to be sustained, only a free-style silvicultural system can be implemented [
2].
We showed that information obtained with remote sensing techniques can be used in terms of valuable explanatory and discriminating variables. ALS-derived variables served to characterize individual HsT with respect to topographic variables (slope steepness and terrain concavity and convexity). The application of remote sensing techniques in conservation ecology and forest management is still scarce [
48]. ALS data and its derivatives have a strong, yet underexploited, potential to assist in the monitoring of Natura 2000 habitat types and other ecologically significant areas [
49]. Overall, the results from Bässler et al. [
3] demonstrated that airborne laser scanning is a rapid method of predicting Natura 2000 habitat types with an accuracy similar to time-consuming ground surveys. Multiple arguments were outlined in favour of the application of ALS for conservation efforts. The main advantage of ALS and related methods is that they allow sampling of habitat characteristics at a high spatial resolution over a large spatial extent. However, the authors do not suggest that ALS alone should be used to map Natura 2000 habitat types. In our case, both SLOPE and TPI could be used as input variables to model the probability of occurrence of different HsTs, but any successful application of remotely sensed indicators of habitat characteristics or conservation status requires careful ground truthing [
7].
If we are to maintain the favourable condition of forest HT, mapping, monitoring and management should be based on the subtype level [
9,
50]. The integration of such principles into conservation schemes would help the estimation of habitat type status. Verified estimations based on HsT level can help to identify more detailed threats and subtype-specific stressors, which are usually not identified at the level of habitat types. Such approaches allow for both practical results useful for management as well as more scientific outputs. Assessments made at the subtype level can certainly improve the overall assessment of the conservation status of HTs, because the evaluation is more detailed. Whenever relevant, we recommend transferring the subtype-level approach to other (heterogenous) forest habitat types and regions.


