Characterizing the interfacial zones of fly ash based alkali activated adhesives to various substrates
 Wolfgang Wisniewski
  Vilma Ducman*
- Slovenian National Building and Civil Engineering Institute (ZAG), Ljubljana, Slovenia
Alkali Activated Materials (AAMs) are important potential substitutes for cement in many materials. The AAMs presented here are based on industrial ground granulated blast furnace slag (GGBFS) and fly ash (FA). They are tested for their suitability as adhesives for joining concrete, ceramic tiles, a wood-based geopolymer (WGP) and a high density geopolymer (HDGP). After mixing multiple batches and performing preliminary tests of the resulting shrinkage, bending-, compressive- and pull-of-strengths to standard ceramic tiles, selected mixtures are tested for their open time and applied to bond intended substrates. The interfacial zones (ITZ) of an AAM containing additional KOH and the most comparable KOH-free AAM to concrete, ceramic tiles, WPG and HDGP are subsequently characterized in detail using scanning electron microscopy (SEM) and energy dispersive X-ray spectroscopy (EDXS). Both mechanical interlocking and areas of probable chemical bonding are identified.
Introduction
Adhesive materials play an important role in the building sector where they are applied to one or both surfaces of two separate items to bind them together and subsequently resists their separation. Frequent examples are binding ceramic tiles to walls or floors and binding panels into multicomponent products. Mortars should also show a good adhesion/bonding to various substrates such as concrete, ceramics, stone and even wood or steel. Most adhesives in the building sector are currently cement based, but the extensive efforts required to keep cement economical (Imbabi, et al., 2012) due to increasing energy costs and green taxes means alternatives are constantly being sought after. One of the directions currently in focus is using different waste materials as precursors for adhesives prepared by utilizing the alkali activation process, i.e., solidifying materials obtained by the reaction of aluminosilicate materials with an alkaline activator (Provis & van Deventer, 2013; Provis 2018). Here it must be noted that the environmental impact of such materials can be further optimized by selecting alternatives to the classic activators (Na/K)OH or Na-silicate (Mendes et al., 2021).
The most important characteristics of adhesives are a sufficient adhesion strength to the respective substrate, a matching shrinkage/expansion and the wetting angle. The mechanisms causing the adhesion strength of cement adhesives has been extensively analysed using various methods while alternative adhesives and the mechanisms via which they bind to substrates have barely been analysed. Interfacial zones (ITZ) between substrates and cement-free binders based on mine waste (Pacheco-Torgal et al., 2008), metakaolin (Zhang et al., 2010; Vasconcelos et al., 2011; Zhu et al., 2013; Chen et al., 2016) or granulated blast furnace slag (Zhang et al., 2010; Zhu and Zheng, 2012) have been presented. While a chemical bonding to the substrate has been claimed by Pacheco-Torgal et al. (2008), the presented SEM-micrographs at best show a direct contact in the ITZ but chemical information via EDXS is not presented and the magnification is insufficient to reveal small cracks, similar to Chen et al. (2016). Nevertheless, the lack of large, far ranging cracks at the ITZ does prove that the formed bond is strong enough to prevent separation, shear bonding strengths of more than 16 MPa were measured (Pacheco-Torgal et al., 2008).
The bonding mechanism between alkali activated binders and Ca(OH)2 rich substrates such as concrete has been proposed to result from a compensating effect of Ca2+ which is released from the substrate to balance the negative charge of Al3+ in [AlO4]−1 ions. This mechanism could be combined with mechanical interlocking due to a silica dissolution from the aggregate into the activators (Pacheco-Torgal et al., 2008). Metakaolin based mortars reached adhesion strengths of less than 1.5 MPa (Vasconcelos et al., 2011), 1.8 MPa (Zhang et al., 2010) or 3.76 MPa (Chen et al., 2016) in contact to concrete. Average shear strengths of 0.65–1.34 MPa were required to cause failure in adhesives based on granulated blast furnace slag where epoxy adhesives required 1.19–1.34 MPa to fail (Zhu and Zheng, 2012). It has been concluded that shrinkage can significantly affect adhesion as a high shrinkage can cause micro-cracking in the ITZ (Zhang et al., 2010; Vasconcelos et al., 2011). MgO has been used as an expansion agent to optimize the shrinkage in AAM coatings (Zhang et al., 2010).
The bonding strength of metakaolin-based binders decreased when cured at temperatures of 80 °C under hydrothermal conditions (Zhu et al., 2013) possibly due to internal stresses caused by the crystallization of zeolites (Zhu et al., 2013).
The ITZ of alkali activated materials has been described to be composed of a Na2O-CaO-Al2O3-SiO2-H2O (N-C-A-S-H) gel where a gradual enrichment of Si and Na has been measured at the interface to quartz sand aggregates spanning 20–50 µm (Nicolas and Provis 2015). These gels play a very important role because they function as the binder amongst all the components of an AAM and hence microstructural studies aimed towards identify bonding mechanisms are frequently performed. One proposed chemical bonding mechanism is that strong alkaline media initially break the Ca-O bond in C-S-H gels but then restructure to form new C-S-H gels which are more uniformly distributed throughout the ITZ and provide a better adhesion (Zhang et al., 2010). C-S-H as well as Ca-hydroxide can react with Al and Si in the mixture due to the balancing effect of Ca2+ (Pacheco-Torgal et al., 2008). Krivenko et al. similarly suggested a formation of alkaline and alkaline-alkali-earth aluminosilicate hydrates in the ITZ contribute to the increased adhesion (Krivenko et al., 2020).
The mechanism comparable to the ITZ between adhesive and substrate can be found at interfaces between AAMs and aggregates: a Ca-enrichment was also reported in the ITZ of an expanded clay and alkali-activated foams (Traven et al., 2022) while alkali-activated cement containing high levels of Ca failed to show a Ca enrichment in the ITZ (Fang and Zhang, 2020). A Ca-enriched ITZ was also not observed when the AA binder or cement belong to low Ca alkali-activated cements containing less than 4 wt% Ca (Lee and van Deventer 2007). While a recent review concluded that direct evidence of a physical or chemical bonding remains lacking in 2021 (Tian et al., 2021), such Ca-enriched zones imply some kind of a chemical interaction and, if analyzed in detail, could provide such evidence. At the same time bonding clearly occurs, even though e.g. Latella et al. reported in 2006 that a chemical bonding to steel or glass could not be detected by EDXS at a scale of −1 μm (Latella et al., 2006). Chemical differences in Ca and K in the ITZ of an AAM geopolymer applied to concrete were noticed and attributed to a newly formed phase containing Ca2+ and K+ ions (Perná et al., 2020). It should be noted that the substrate conditions can affect the ITZ formation, and hence bonding, because e.g. application to a dry surface can cause a fast desiccation of the liquid from the AAM and lead to additional cracking at the interface (Perná et al., 2020).
Ultimately, a properly designed adhesive must show a suitable shrinkage and ideally form a chemical bond to any intended substrate. Additional mechanical interlocking is desirable to compensate differences in the coefficient of thermal expansion and result in a higher bonding strength. The work presented here features experiments aimed at developing a fly ash (FA) based alkali-activated adhesive mainly intended for joining a high density geopolymer (HDGP) with a wood-based geopolymer (WGP) (Frankovič et al., 2020; Kvočka et al., 2020). Its potential use for other contact surfaces like ceramics or concrete is also assessed. Special attention is placed on analyzing the ITZ in order to recognize parameters which contribute to the good adhesion between different substrates and adhesives.
Experimental procedure
GGBFS slag (Minerali Industriali, Italy) and FA (Baumineral GmbH, Germany) were used to mix batches of alkali activated adhesive. Their loss on ignition (LOI) components were determined by placing them in an XRF xrFuse1 electric furnace where they were heated to 950°C for 1 h in a 25 ml Pt crucible and chemical composition were determined using wavelength dispersive X-ray fluorescence (WD XRF, Thermo Scientific, Thermo electron SA, Ecublens, Switzerland), the results are stated in Table 1. Potassium water glass (KS, Betol K 5020 T, Woellner, Auatria) with SiO2/K2O = 1.6 was used as the activator to prepare the batches stated in Table 2. PA grade KOH supplied by ITRIJ d.o.o. (Slovenia) was used to mix the batches.

TABLE 1. Chemical composition of the raw materials in ma% measured using WD XRF.
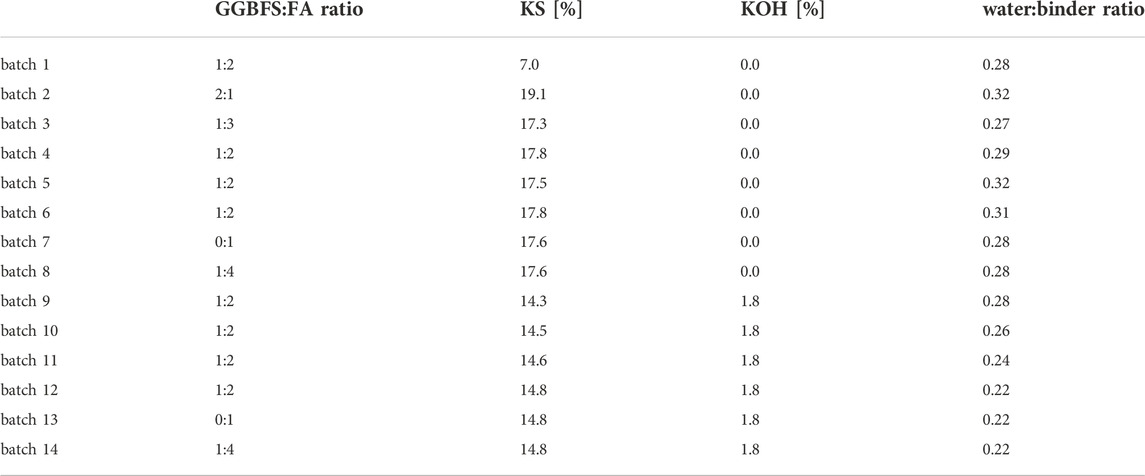
TABLE 2. Batch compositions of the prepared adhesives.
The batches were mixed in a standard mechanical stirrer for 3 min before their consistency/flow was analyzed according to EN 1015-3, i.e., by filling the standard truncated conical mold, removing it and shaking the flow table 15 times. The diameter of the spread material was averaged over two measurements at differing locations.
Samples for mechanical tests were prepared by casting the batches into molds of 20 × 20 × 80 mm3. The prepared samples were cured at room conditions (20°C and 55% relative humidity) for 7 days before performing the mechanical tests. A Toninorm press (Toni Technik, Germany, force detection limit 100 N) with a force application rate of 0.05 kN/s was used to measure mechanical properties according to EN 196-1 and averaged over three samples per batch.
Altogether three sets of pull-off-test were performed with the prepared batches. The samples for these tests were prepared by spreading a thin layer of each batch on a bottom substrate with a straight trowel before a thicker layer was applied with a notched trowel. A top substrate was then placed on the adhesive after waiting for a defined time and loaded with 2 kg for 3 min following EN 1542. After waiting 3 or 7 days, the adhesive Sikadur 31CF RAPID was used to bond the samples onto the steel heads of a portable Freundl F15D EASY M dynamometer (Josef Freundl, Wennigsen, Germany, max. Pulling capacity 15 kN) used to measure the pull-off strength. For pull-off-test {A} the respective bottom and top substrates were concrete and standard ceramic tiles and the defined time was 5 min. The second pull-off-test {B} was performed to determine the open time of selected batches in contact to the respective bottom and top substrates concrete and concrete tiles and the defined time was 0, 5, 10 or 20 min following EN 12004-2. The final pull-off-test {C} was performed to test the adhesion of the batches 4 and 12 to concrete, standard ceramic tiles, a WPG and a HDGP in varying combinations and the defined time was always 5 min.
Cross-sections of selected samples were cut and embedded in EpoThin resin (Buehler, Leinfelden-Echterdingen, Germany), cured at 50°C, and polished using decreasing grain sizes to a final step of ca. 10 min on a SiC Buehler Micro Cut plate 30-10-4000 (Buehler, Leinfelden-Echterdingen, Germany, ca. 5 µm grain size). Scanning electron microscopy (SEM) was performed using a JSM-IT500 (Jeol, Tokyo, Japan) in low vacuum mode. Energy dispersive X-ray spectroscopy (EDXS) was performed using an Ultim Max 65 detector (Oxford Instruments, Abingdon, UK) and the software Aztec 5.0 (Oxford Instruments, Abingdon, UK). SEM figures and EDXS maps were acquired using an acceleration voltage of 15 kV.
Results and discussion
Preliminary experiments: Shrinkage and mechanical strength
Different mixtures were prepared as stated in Table 2 starting with FA and slag combinations activated with K-silicate (batches 1–8) while KOH was added to the batches 9-14 to allow a further decrease of the water/binder ratio which should increase their strenghts (Kramar and Ducman, 2015). The GGBFS/FA and water/binder ratios were varied to obtain a suitable consistency. Results of these preliminary tests are stated in Table 3.
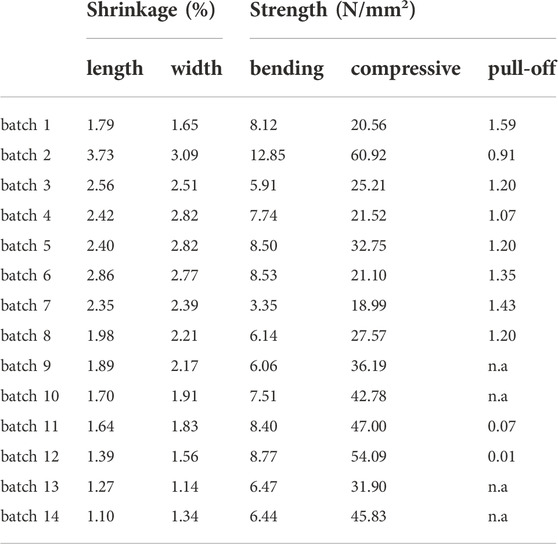
TABLE 3. Results of the preliminary experiments performed on samples representing the respective batches to determine their shrinkage and bending, compressive and pull-off strengths of test {A} after curing for 3 days.
The KOH-containing batches generally show a lower shrinkage which should result from the usually lower water/binder-ratio as KOH has been reported to increase the shrinkage in otherwise comparable composions (Omur et al., 2022). In agreement with Omur et al. (2022) they indeed show higher compressive strengths as intended (except for batch 2) while the bending strengths are comparable to the KOH-free batches. The measured pull-off strengths of test {A} after 3 days of curing, however, are systematically higher for the KOH-free batches while those containing KOH show a minimal adhesion or even failed to provide measurable data.
While a high mechanical strength is good for an adhesive, its adhesion and ultimately its pull-off strength are more important. The latter can be severely affected by the shrinkage as adhesives are usually applied to solids of a fixed shape so that their shrinkage causes stresses at the interface to the substrate and can even cause a complete failure of the bond. The measured strengths and length shrinkage of the prepared batches are correlated to the respective water/binder ratio in Figure 1. As is to be expected, the shrinkage increases with the amount of water in the composition, the shrinkage in width shows the same trend, but the values at ratios of 0.22, 0.28 or 0.32 show that adhesives with the same water/binder ratio can show quite different shrinkages. The lowest shrinkage of 1.1% at a ratio of 0.22 was measured for batch 14, the lowest of 1.65% at a ratio of 0.28 for batch 1 and the lowest of 2.4% at a ratio of 0.32 for batch 5.
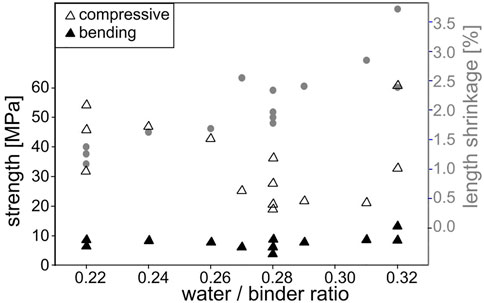
FIGURE 1. Measured strengths and length shrinkage correlated to the water/binder ratio of the prepared batches.
The compressive strengths decrease with an increasing water/binder ratio as reported by Kramar and Ducman (2015) and the accompanying shrinkage increases except for the values correlated to a ratio of 0.32 (batches 2 and 5). A comparable trend is not discernible for the bending strength which remains relatively constant but again shows elevated values for the ratio of 0.32. While the bending strength is well known to be severely affected by surface cracking, a higher shrinkage could increase the depth to which surface cracks propagate during curing and hence increasingly affect the compressive strength in a negative way.
The measured strengths and length shrinkage of the prepared batches are correlated to the respective GGBFS/FA ratio in Figure 2, the shrinkage in width shows the same trend. Batch 2 with the highest GGBFS content again shows the highest values but a trend that increasing GGBFS amounts are accompanied by larger strengths and shrinkages is supported by all batches. This correlation contradicts the results in Figure 1 where an increasing shrinkage is accompanied by decreasing strengths when correlated to the water/binder-ratio. It would seem the broad spread of composition changes tested in this initial screening is not optimal to determine systematic effects of the individual components.
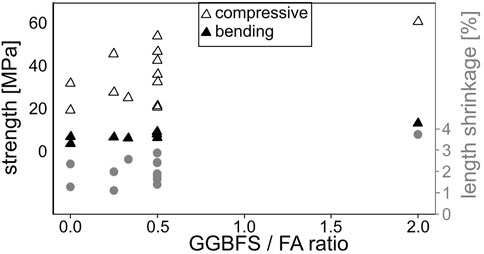
FIGURE 2. Measured strengths and length shrinkage correlated to the GGBFS/FA ratio of the prepared batches.
The preliminary tests indicate that adding KOH allows lower water/binder ratios which probably enhance the mechanical properties but mainly affect the compressive strength. This could be ascribed to two different factors, presumably with synergistic effects; adding KOH increases the alkalinity and can increase the solubility of Al and/or Si from the precursors fly ash and slag (Panagiotopoulou et al., 2007), and thus result in a higher degree of inorganic polymerization. KOH also functions as a surfactant and reduces the amount of water to achieve a suitable consistency; and less lower water/binder ratio contribute to the higher compressive strength (Kramar and Ducman, 2015). However, it has a very negative effect on the pull-off-strength measured in contact to ceramic tiles after 3 days of curing.
Flow, open time, and adhesion tests
A minimum flow of 130 mm is desirable so that the adhesiv is fluid enough for a successful application to a substrate. The consistency test results stated in Table 4 showed that the measured KOH containing batches, except for batch 12, were too liquid to measure their flow despite their somewhat lower water/solid ratio. This is in agreement with the above noted function of KOH as a surfactant as it has also been reported to increase the flow and setting time compared to NaOH in alkali activated mortars of otherwise comparable composition (Omur et al., 2022).
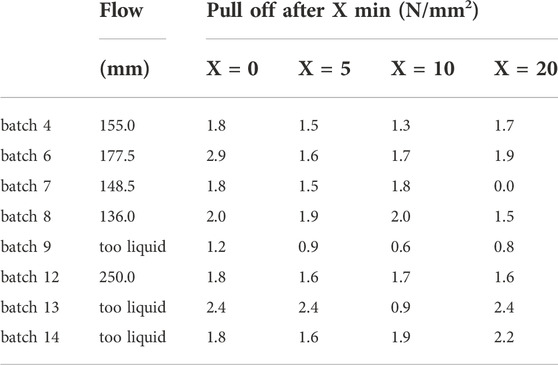
TABLE 4. Results of the consistency test (flow) and the pull-off strengths of test {B} after curing for 3 days to determine the open time.
Further tests were performed on well workable batches with sufficient mechanical properties and free of major cracks to determine which adhesives to apply to other substrates in the planned pilot production. The results of the tested consistency and pull-off-strengths to determine the open time are stated in Table 4. As the adhesion of the KOH-containing batches to ceramic tiles was insufficent, see Table 3, concrete tiles were used as the top substrate in the pull-off-test {B} in order to obtain more reliable open times.
As intended, the adhesion to the concrete tiles turned out to be systematically higher, especially with respect to the KOH containing batches. While the adhesion generally remained the weak point of the bond, i.e. fractured along the ITZ, the bond of batch 9 applied after X = 10 min surpassed the internal strength of the adhesive. The open time (a.k.a. pot life) is at least 20 min for all measured batches except batch 7 as they successfully bonded the tiles to the concrete even after waiting for 20 min before application.
As the effect of KOH on the ITZ is of interest, batch 12, as the only KOH-containing batch with a measurable flow, and the most similar KOH-free batch were selected for a further test of their bonding properties to different substrates and subsequent analyses of their ITZ. The most comparable KOH-free composition is batch 4 as it shows the same GGBFS:FA ratio and the lowest water:binder ratio of such batches with a similar KS content. The results of the pull-off-test {C} to various substrates are stated in Table 5. While the measured pull-of strength to ceramic tiles or concrete was considered to be sufficient with one exception, i.e. more than 0.5 MPa, that to the WGP and HGP was systematically lower. Here it must be mentioned that the weak point for the WGP-adhesive ITZ was the WGP-panel itself as the fracture occurred inside it. If the pull-of strength exceeded 1 MPa, the fracture usually occurred inside the adhesive layer warranting a more detailed analysis of the prepared adhesive-substrate ITZs.
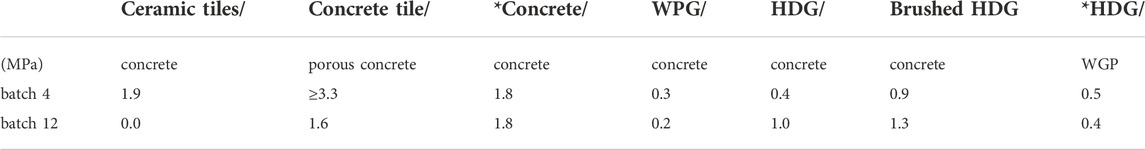
TABLE 5. Three (*) or 7 day pull off strengths of test {C} of the adhesives batch 4 and 12 bonding the respectively stated components.
Interface analysis
Selected adhesive/substrate interfaces were then analysed in detail using SEM and EDXS. The interface between concrete and the adhesive batch 1 is presented in Figure 3A) while that to batch 4 is featured in Figures 3B. Figure 3C illustrates the interface to batch 12. The solid frames outline the areas from which the EDXS element maps of Ca and K respectively presented below were acquired. They best visualize the noteworthy chemical signals: in all three cases concrete contains more Ca than the adhesive, not surprizing as cement generally has a high Ca content, while the opposite is true for K and the boundary is clearly discernible in the Ca maps. The main difference is that the K maps of batch 1 and 4 indicate an accumulation of K at the interface, highlighted by white arrows, while that of batch 12 does not. Additionally, is seems like Ca is also enriched in this area compared to the adhesive matrix further from the interface. The enrichment of K in the adhesive near the interface could be caused by K-containing liquid being drawn into the dried concrete which can probably absorb water better than the comparably large K+ ions and hence function as a filter. An enrichment of K could increase the local basicity, perhaps chemically attacking the concrete and thus allow some of the Ca to diffuse into the adhesive to reduce the chemical gradient at the interface. As batch 12 showed the maximum measured flow in the consistency test, the absence of a comparable K accumulation could be explained by a larger amount of liquid flushing K into the concrete.
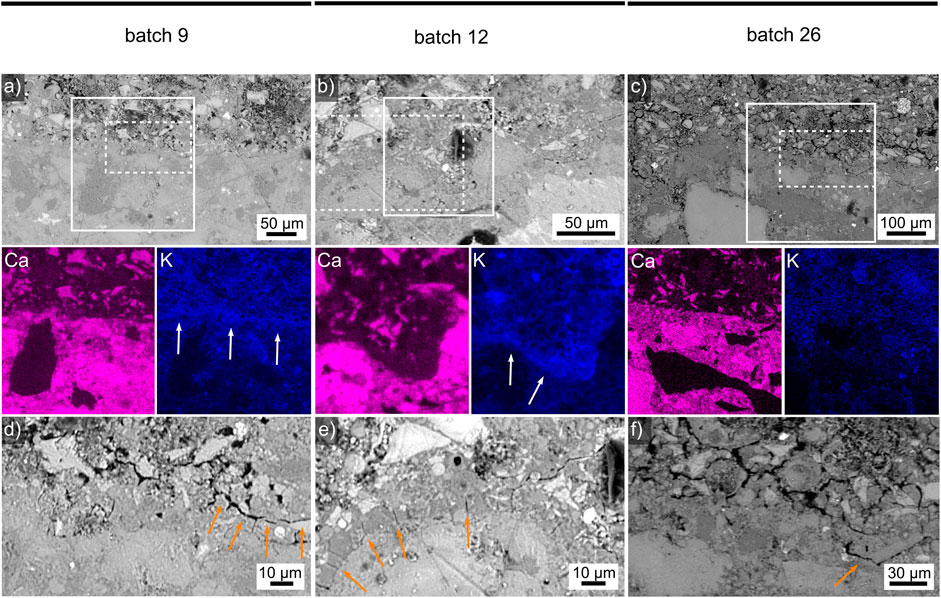
FIGURE 3. SEM micrographs between concrete (bottom) and the adhesives (A) 1, (B) 4 or (C) 12 (top of each figure). Selected EDXS element maps of the solid-framed areas are respectively presented below where white arrows highlight the concrete/adhesive interface. The dash-framed areas are presented below where SEM micrographs illustrate the concrete/adhesive interface between (D) 1, (E) 4 or (F) 12 in greater detail and orange arrows highlight cracks.
The dashed frames in the Figures 3A–C outline the areas presented in greater detail in the Figures 3D–F. Figure 3D shows the concrete/batch 1 interface in greater detail to show that there are areas of direct contact (left) as well as cracks, highlighted by the orange arrows, running parallel to the interface. Please note that these cracks are too small to be discernible in the SEM-micrographs presented by Pacheco-Torgal et al. (2008) illustrating the importance of using a sufficient magnification. Figure 3E presents the concrete/batch 4 interface which features a large number of crack perpendicular to the interface, probably resulting from shrinkage as the adhesive dried in contact to the already comparable stable concrete. Here a crack-free interface is discernible in the right half of the figure. The concrete/batch 12 interface featured in Figure 3F showed comparably less cracks but also showed cracks parallel to the interface as outlined by the orange arrow.
Systematically quantifying the number of micro-cracks in the vicinity of each ITZ component in the analysed samples is beyond the scope of the work presented here, but it should be noted that the presented batches showed shrinkages in length of 2.42% (batch 4), 1.79% (batch 1) or 1.39% (batch 12) in Table 3. The shrinkage in the KOH-free batch 1 is hence closer to the KOH-containing batch 12 than to batch 4 which is KOH-free, has comparable GGBFS:FA and water:binder ratios but contains almost twice the KS, see Table 2. The cracks perpendicular to the interfaces are observed despite the comparably low shrinkage. Assuming batch 12 did, in fact, lead to more liquid being transferred to the concrete as speculated above, the local water/binder ratio at the interface would be lowered and with it the local shrinkage, causing less shear stresses and hence less cracking at this interface.
Interfaces of ceramic tiles in contact to the adhesives batch 4 and batch 12 are presented in Figure 4, both ceramics contain darker and brighter areas in the respective optical micrographs. The framed area in Figure 4A spans a thin layer of the bright ceramic better discernible in the inset. An SEM-micrograph of this interface is presented in greater detail in Figure 4B where this thin layer appears more compact than the ceramic at the top of the micrograph. The EDXS elements of the frame in this SEM-micrograph presented below show that the adhesive contains slightly more K than the compact ceramic layer which in turn shows a stronger K signal than the ceramic appearing dark in the corresponding optical micrograph. While the adhesive-ceramic interface is also discernible in the element maps of Ca, Si, and Al, the interface between the “bright” and “dark” ceramic does not provide a discernible contrast in these elements.
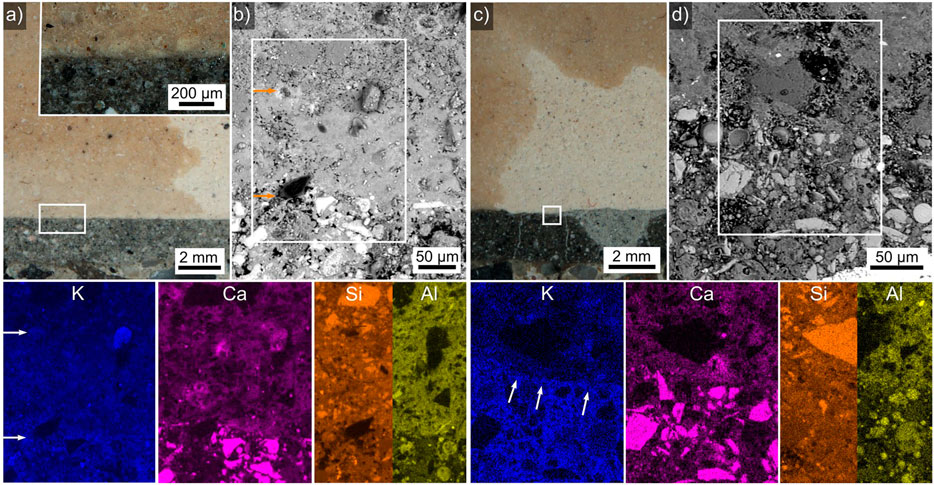
FIGURE 4. (A) An optical micrograph of a ceramic tile (top) in contact to adhesive 4 (bottom), the framed area is presented in greater detail in the inset. (B) SEM micrograph of this interface, EDXS element maps of the framed area are presented below, the orange arrows highlight transitions from the adhesive (bottom) to the bright ceramic (middle) and the dark ceramic (top). (C) An optical micrograph of a ceramic tile (top) in contact to adhesive 12 (bottom), the framed area is presented in greater detail in (D) an SEM micrograph of this interface. Selected EDXS element maps of the framed area are presented below where the white arrows highlight the adhesive/ceramic interface.
The framed area in Figure 4C spans the interface between the bright ceramic and a dark and bright region in adhesive 12. The more detailed SEM micrograph of this area in Figure 4D does not enable to discern the different regions of the adhesive. The EDXS elements of the frame in this SEM-micrograph presented below show that the adhesive again contains slightly more K than the ceramic, the interface is highlighted by white arrows. In this case, the adhesive matrix contains comparable amounts of Ca and Si as the ceramic which contains a higher amount of Al.
Whether the optically dark and bright regions of the ceramic result from a heterogeneity during production or from an infusion of K-containing liquid from the adhesives cannot be said at this point. It should be noted that neither cracks nor gaps occur between the ceramic and the adhesives, implying a relatively good adhesion which is supported by the relatively high corresponding pull-off-strengths in Table 5. Assuming the bright ceramic indicates a zone where a K-containing liquid fused into the porosity of the ceramic, upon drying this liquid should form a mechanical interlock with the ceramic and perhaps a chemical interaction which, however, would form on a scale below the detection threshold/spatial resolution of the EDXS-analyses presented here.
The interface between WGP and the adhesives is not homogeneous as the “wood” and “matrix” components of the WGP show very different interactions. Figure 5 presents the direct contact between the adhesive and the wood component of the WPG. The interface to batch 4 in Figure 5A contains wood fibers embedded in the adhesive as confirmed by the presented C map and Ca particles in the pores of the wood component which is also saturated by K. The interface to batch 12 in Figure 5B shows a similarly direct contact, a comparable saturation of the wood with K and Ca and Si enriched particles inside the pores of the wood. These results confirm the penetration of wood pores by the AAM proposed by Gouny et al. (2012). While these interfaces clearly imply a good level of mechanical interlock, a chemical interaction is not indicated as it is unknown whether the non-wooden components in the pores and the K in the wood result from contact to the adhesive or, more likely, from the initial WPG production.
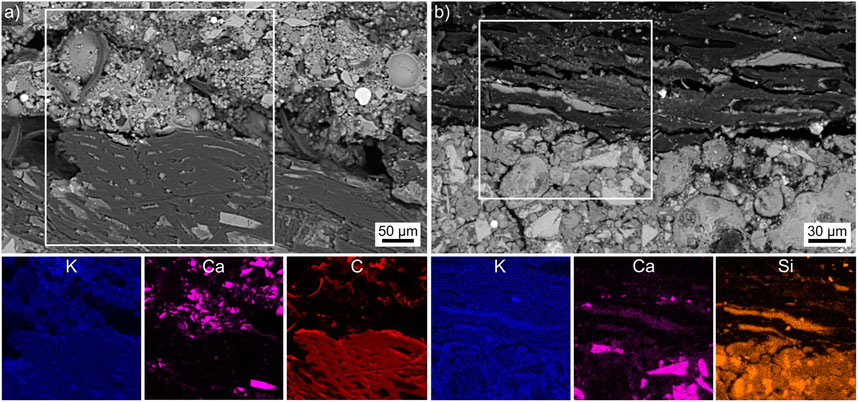
FIGURE 5. (A) SEM micrograph of the batch 4/WPG interface (WPG at the bottom). Selected EDXS maps of the framed area are presented below. (B) SEM micrograph of the WPG/batch 12 interface (WPG at the top). Selected EDXS maps of the framed area are presented below.
The interface between the matrix components of the WGP and the batches 4 and 12 is illustrated in Figure 6. Figure 6A features the batch 4 interface to the matrix (left, cracked) as well as the wood part (right) of the WGP. The area in the frame is presented in greater detail in Figure 6B to show that the interface crack (left) is deflected into the WGP at this location. Whether this was caused by a weakness in the WGP or a good bond to the adhesive cannot be clarified at this point. Figure 6C presents the interface between the WGP matrix and batch 12 which was generally separated by a rather large gap. However, the two locations highlighted by the arrows in this figure contain clear proof of initial mechanical interlock, the framed area is presented in Figure 6D for greater detail. This figure features a clear undercut of the adhesive in the WGP matrix, however the crack patterns also imply that this structure separated from the bulk of the adhesive, probably when the gap was formed. EDXS element maps of the framed area in Figure 6D were acquired, those of K and Ca are presented below to visualize that these results do not indicate any chemical interaction between the adhesive and the WGP matrix. At best, the interlocking feature contains somewhat less K than either bulk components. Figure 6E presents an area where the WGP matrix is in direct contact with batch 12, the EDXS element maps of the solid-framed area below again fail to indicate any chemical interface interaction with respect to K or Ca which represent the results for all other detected elements. The area in the dashed frame is presented in Figure 6F to confirm the direct contact between the adhesive and the WGP in this area.
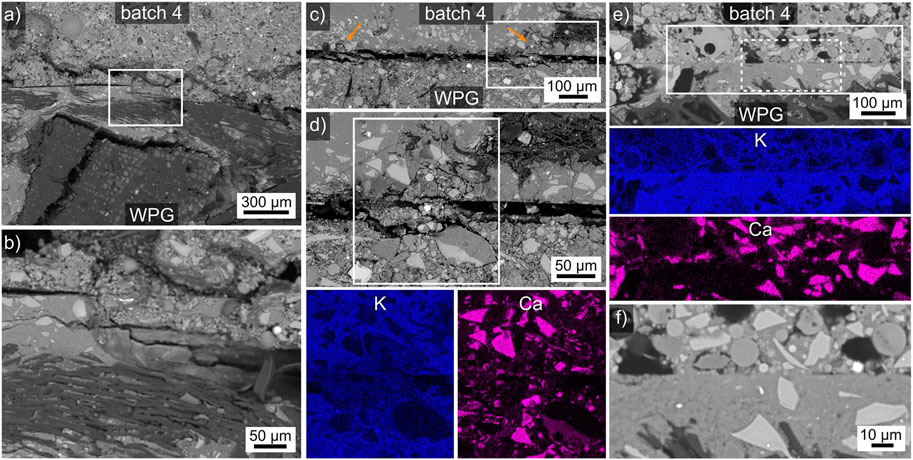
FIGURE 6. (A) SEM micrograph of the batch 4/WPG matrix interface, the framed area is presented in greater detail, see (B). (C) SEM micrograph of a cracked batch 12/WPG matrix interface, orange arrows highlight locations of mechanical interlock. The framed area is presented in greater detail in (D), selected EDXS maps of this framed area are presented below. (E) SEM micrograph of a batch 12/WPG matrix interface, selected EDXS maps of the solid framed area are presented below. The area in the dashed framed is presented in the SEM micrograph (F) for greater detail.
The results presented in Figure 5 and Figure 6 enable to conclude that the main reason for the adhesion between the WGP and the adhesives is probably a mechanical interlock with the wooden component of the WGP. Mechanical interlocks to the WGP are formed but can be fractured when large shrinkage gaps are formed. On the other hand, it is also clear that a direct contact between the WGP matrix and the adhesives is possible and some level of adhesion is achieved at these locations as well.
The interface between the HDGP and the batches 4 and 12 is illustrated in Figure 7 where the HDGP is always at the top of a figure. As for the WGP-matrix discussed above, the analyzed samples often showed significant gaps or cracks along this interface. For example, the location featured in Figure 7A is one of only two locations in the prepared cross section where the adhesive batch 4 is in contact to the HDGP. However, the mere fact that some of the adhesive was torn from its bulk and stuck to the HDGP proves that some interaction must have occurred and this bond must have been stronger than the internal strength of the adhesive at this location. Figure 7B presents a much better connected interface which still affected by cracking. The K-map presented in the inset was obtained in the framed area and shows that the bond between the adhesive and the HDGP actually surpassed the internal strength of the HDGP in this case as the crack parallel to the interface occurs inside the K-rich zone and any transfer of K into the adhesive should be gradual rather than the discrete boundary indicated in the map. A third kind of interface is presented in Figure 7C where the adhesive and the HDGP are generally separated by a gap of ca. 10 µm which is frequently bridged as highlighted by the arrows. The EDXS-maps of K and Ca presented below indicated these bridges are formed by the adhesive (comparable K content) but do not contain any larger Ca-particles, which would be in agreement with the “wall effect” (Nicolas and Provis 2015).
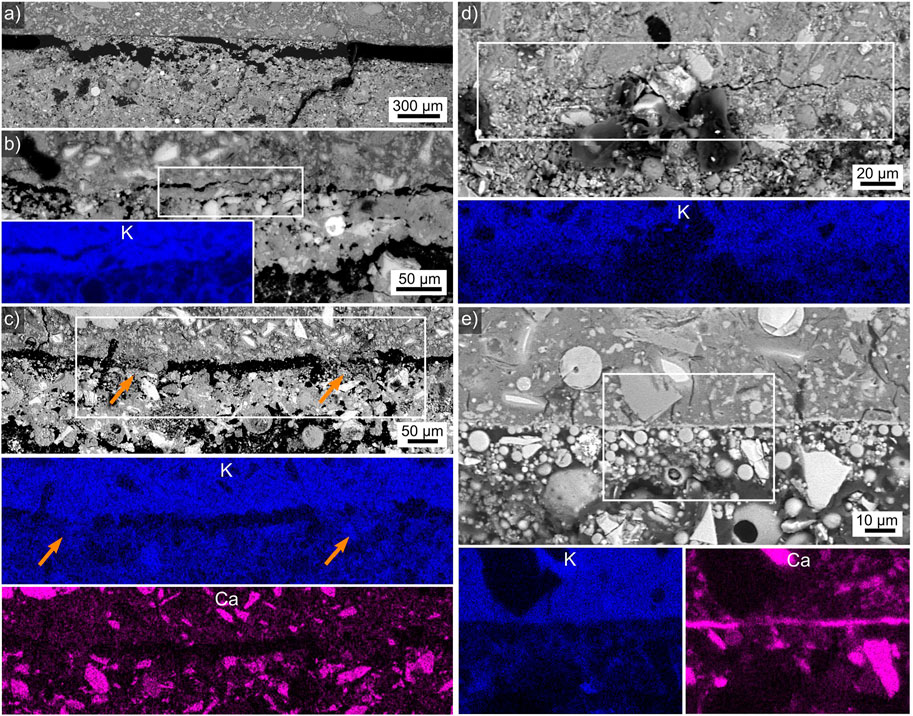
FIGURE 7. (A) SEM micrograph of a largely separated batch 4/HDGP interface. (B) A cracked batch 4/HDGP interface, an EDXS map of K acquired in the framed area is presented in the inset. (C) A batch 4/HDGP interface where two bridges between the materials are highlighted by arrows. EDXS maps of K and Ca acquired in the framed area are presented below. (D) A partially cracked batch 12/HDGP interface, an EDXS map of K acquired in the framed area is presented below. (E) An interface where batch 12 and the HDGP are in direct contact, EDXS maps of K and Ca acquired in the framed area are presented below. The HDGP is at the top of all figures.
Figure 7D features an HDGP/batch 12 interface where direct contact is observed to the left while a crack is observed to the right. The K-map acquired in the framed area shows no significant difference between the cracked and non-cracked regions and but the K-transition is less discrete than at the previously presented interfaces, implying some chemical interaction may have occurred here. A final interface is featured in Figure 7E which neither shows a gap nor any cracks parallel to the interface, instead a bright line less than 1 µm thick indicates some kind of chemical interaction. While the element map of K only indicates a rather discrete interface, the Ca-map proved that this layer is significantly enriched in Ca. Local Ca-enrichments have been observed in LWA-AAF-composites (Traven et al., 2022) and the ITZ in alkali activated slag mortars (Nicolas and Provis 2015) has also been described to contain elevated levels of Ca. This interface also shows the wall-effect: large grains do not occur in the region of ca. 5–10 µm adjacent to the interface.
Finally, the interface between HDGP etched with KOH for 10 min before applying the adhesive batch 1 (containing less than half the KS of batch 4) is presented in Figure 8. Figure 8A presents an overview showing a ca. 50 µm wide gap between the HDGP and the adhesive. However, this gap contains structures which must have formed while the adhesive was still liquid and thus prove that the gap was not formed as a crack during solidification. The area in frame 1 is presented in greater detail in Figure 8B and shows some larger, compact grains protruding into the gap surrounded by finer particles which form a radial structure and are in direct contact with the HDGP. Frame 2 features the area also featured in Figure 8C where predominantly larger, compact grains protrude into the gap. Frame 3, in turn, features the area detailed in Figure 8D where only the finer particles form a clearly radial structure. Selected EDXS element maps of the area in frame 4 are presented below to show that the large, compact particles are enriched in K while the finer particles show relatively high contents of Ca and Si. A chemical interaction with the HDGP is not indicated. The gap, on the other hand, primarily contains C, which can only result from the embedding procedure.
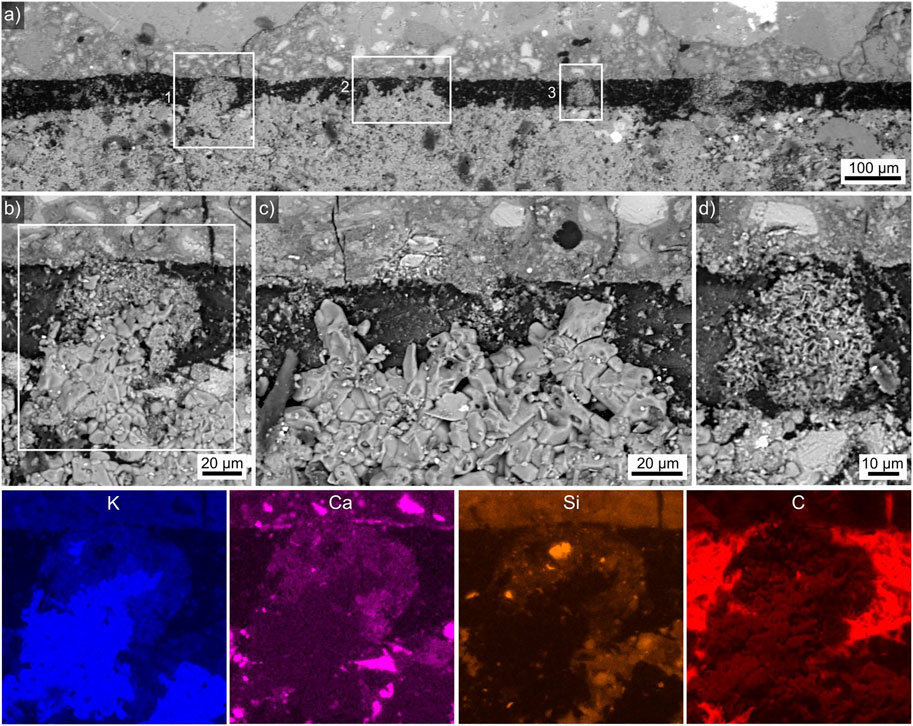
FIGURE 8. SEM-micrographs of the interface between etched HDGP (top) and the adhesive batch 1 (bottom). (A) Overview of the interface, the areas in the frames 1–3 are respectively presented in (B), (C) and (D) in greater detail. Element maps of the area in frame 4 are presented below.
\These results can be explained by the formation of a water soluble layer on the HDGP during etching. Once the adhesive was applied, it fills weak spots in this layer (the compact particles in the gap) but probably also partially dissolves this layer to form e.g., the spherical, fine-grained structures in Figures 8B,D. The water soluble layer must either be absorbed by the adhesive or have been washed out or evaporated at some point to produce a gap that could be filled with the epoxy resin when the samples were embedded for SEM analysis. While such a gap is certainly not ideal, adhesive strengths were measured for this sample, proving that some adhesion is achieved and it is plausible to assume that large shrinkage tensions are avoided for lack of a direct contact between the adhesive and the HDGP.
Conclusion
Sufficiently strong adhesives based on FA and GGBFS activated by K-silicate were developed and characterized. Adding KOH to the mixture enhances flow and allows for lower water:binder ratios but also had a negative effect on the pull-off strength although it seems to reduce the micro-cracking at the interface to concrete. Acceptable technological parameters (open time ≥20 min, flow >130 mm) for application were confirmed for selected mixtures which also showed high pull-off strengths (≥1.6 MPa) when used to bond concrete to ceramic tiles or concrete. Insufficiently low strengths (usually ≤0.5 MPa) were measured for the bonding to the WPG or HDGP.
The systematic ITZ analysis proved mechanical interlocking in various cases and clear indications of different cases of chemical adhesion whose exact mechanism remain to be clarified: some show no significant chemical signal in the applied EDXS measurements but clear Ca-enrichment in the ITZ could also be detected. As both the inorganic polymers and the adhesives contain multiple components in contact to binders, the direct “adhesive-substrate interface” is actually composed of various interfaces between multiple components which can each interact differently.
Data availability statement
The raw data supporting the conclusion of this article will be made available by the authors, without undue reservation directed to the corresponding author.
Author contributions
VD designed the experiments and acquired the preliminary results. WW performed SEM and EDXS analysis. Both authors contributed to the writing and approved the submitted version.
Funding
This work was supported samples were prepared as part of InnoWEE project (European Union’s Horizon 2020 research and innovation programme under Grant Agreement No. 723916), while further analysis were funded by the Slovenian Research Agency (ARRS) via program P2-0273 “Building structures and materials”.
Conflict of interest
The authors declare that the research was conducted in the absence of any commercial or financial relationships that could be construed as a potential conflict of interest.
Publisher’s note
All claims expressed in this article are solely those of the authors and do not necessarily represent those of their affiliated organizations, or those of the publisher, the editors and the reviewers. Any product that may be evaluated in this article, or claim that may be made by its manufacturer, is not guaranteed or endorsed by the publisher.
References
Chen, L., Wang, Z., Wang, Y., and Feng, J. (2016). Preparation and properties of alkali activated metakaolin-based geopolymer. Materials 9, 767. doi:10.3390/ma9090767
European Committee for Standardization (1999a). EN 1015-3: Methods of test for mortar for masonry. European Committee for Standardization.
European Committee for Standardization (2017). EN 12004-2: Adhesives for ceramic tiles - Part 2: Test method. European Committee for Standardization.
European Committee for Standardization (1999b). EN 1542: Products and systems for the protection and repair of concrete structures - test methods - measurement of bond strength by pull-off. European Committee for Standardization.
European Committee for Standardization (2016). EN 196-1: Methods of testing cement - Part 1: Determination of strength. European Committee for Standardization.
Fang, G., and Zhang, M. (2020). The evolution of interfacial transition zone in alkali-activated fly ash-slag Concrete. Cem. Concr. Res. 129, 105963. doi:10.1016/j.cemconres.2019.105963
Frankovič, A., Ducman, V., Dolenec, S., Panizza, M., Tamburini, S., Natali, M., et al. (2020). Up-scaling and performance assessment of façade panels produced from construction and demolition waste using alkali activation technology. Constr. Build. Mat. 262, 120475. doi:10.1016/j.conbuildmat.2020.120475
Gouny, F., Fouchal, F., Maillard, P., and Rossignol, S. (2012). A geopolymer mortar for wood and Earth structures. Constr. Build. Mat. 36, 188–195. doi:10.1016/j.conbuildmat.2012.04.009
Imbabi, M. S., Carrigan, C., and McKenna, S. (2012). Trends and developments in green cement and concrete technology. Int. J. Sustain. Built Environ. 1, 194–216. doi:10.1016/j.ijsbe.2013.05.001
Kramar, S., and Ducman, V. (2015). Mechanical and microstructural characterization of geopolymer synthesized from low calcium fly ash. CI&CEQ. 21, 13–22. doi:10.2298/ciceq130725042k
Krivenko, P., Petropavlovskyi, O., Kovalchuk, O., and Gelevera, O. (2020). “The Influence of interfacial transition zone on strength of alkali-activated concrete,” in Compressive strength of concrete (London: IntechOpen). doi:10.5772/intechopen.90929
Kvočka, D., Lešek, A., Knez, F., Ducman, V., Panizza, M., Tsoutis, C., et al. (2020). Life Cycle assessment of Prefabricated geopolymeric façade Cladding panels made from large Fractions of Recycled construction and demolition waste. Materials 13, 3931. doi:10.3390/ma13183931
Latella, B. A., Perera, D. S., Escott, T. R., and Cassidy, D. J. (2006). Adhesion of glass to steel using a geopolymer. J. Mat. Sci. 41, 1261–1264. doi:10.1007/s10853-005-4234-3
Lee, W. K. W., and van Deventer, J. S. J. (2007). Chemical interactions between siliceous aggregates and low-Ca alkali-activated cements. Cem. Concr. Res. 37, 844–855. doi:10.1016/j.cemconres.2007.03.012
Mendes, B. C., Pedroti, L. G., Vieira, C. M. F., Marvila, M., Azevedo, A. R. G., de Carvalho, J. M. F., et al. (2021). Application of eco - friendly alternative activators in alkali - activated materials: A review. J. Build. Eng. 35, 102010. doi:10.1016/j.jobe.2020.102010
Nicolas, R. S., and Provis, J. L. (2015). The interfacial Transition Zone in alkali-activated slag Mortars. Front. Mat. 2, 70. doi:10.3389/fmats.2015.00070
Omur, T., Kabay, N., Miyan, N., Özkan, H., and Özkan, C. (2022). The effect of alkaline activators and sand ratio on the physico-mechanical properties of blast furnace slag based mortars. J. Build. Eng. 58, 104998. doi:10.1016/j.jobe.2022.104998
Pacheco-Torgal, F., Castro-Gomes, J. P., and Jalali, S. (2008). Adhesion characterization of tungsten mine waste geopolymeric binder. Influence of OPC concrete substrate surface treatment. Constr. Build. Mat. 22, 154–161. doi:10.1016/j.conbuildmat.2006.10.005
Panagiotopoulou, C., Kontori, E., Perraki, T., and Kakali, G. (2007). Dissolution of aluminosilicate minerals and by-products in alkaline media. J. Mat. Sci. 42, 2967–2973. doi:10.1007/s10853-006-0531-8
Perná, I., Hanzlíček, T., and Žaloudková, M. (2020). Microscopic study of the concrete/geopolymer coating interface. Ceram. - Silik. 64, 68–74. doi:10.13168/cs.2019.0050
Provis, J. L. (2018). Alkali-activated materials. Cem. Concr. Res. 114, 40–48. doi:10.1016/j.cemconres.2017.02.009
Provis, J. L., and van Deventer, J. S. J. (2013). “Alkali activated materials: State-of-the-Art Report,” in RILEM TC 224-AAM (Berlin: Springer/RILEM).
Tian, Q., Wang, S., Sui, Y., and Lv, Z. (2021). Alkali-activated materials as coatings deposited on various substrates: A review. Int. J. Adhes. Adhes. 110, 102934. doi:10.1016/j.ijadhadh.2021.102934
Traven, K., Wisniewski, W., Češnovar, M., and Ducman, V. (2022). Microstructural characterization of alkali-activated composites of Lightweight Aggregates (LWAs) embedded in alkali-activated foam (AAF) Matrices. Polymers 14, 1729. doi:10.3390/polym14091729
Vasconcelos, E., Fernandes, S., de Aguiar, J. L. B., and Pacheco-Torgal, F. (2011). Concrete retrofitting using metakaolin geopolymer mortars and CFRP. Constr. Build. Mat. 25, 3213–3221. doi:10.1016/j.conbuildmat.2011.03.006
Zhang, Z., Yao, X., and Zhu, H. (2010). Potential application of geopolymers as protection coatings for marine concrete II. Microstructure and anticorrosion mechanism. Appl. Clay Sci. 49, 7–12. doi:10.1016/j.clay.2010.04.024
Zhu, H., Zhang, Z., Deng, F., and Cao, Y. (2013). The effects of phase changes on the bonding property of geopolymer to hydrated cement. Constr. Build. Mat. 48, 124–130. doi:10.1016/j.conbuildmat.2013.06.095
Keywords: alkali activated adhesive, fly ash, GGBFS, mechanical properties, interfacial transition zone, ITZ, SEM, EDXS
Citation: Wisniewski W and Ducman V (2022) Characterizing the interfacial zones of fly ash based alkali activated adhesives to various substrates. Front. Mater. 9:1049383. doi: 10.3389/fmats.2022.1049383
Received: 20 September 2022; Accepted: 10 November 2022;
Published: 05 December 2022.
Edited by:
John L. Provis, The University of Sheffield, United KingdomReviewed by:
U. Johnson Alengaram, University of Malaya, MalaysiaMarija Nedeljkovic, Delft University of Technology, Netherlands
Copyright © 2022 Wisniewski and Ducman. This is an open-access article distributed under the terms of the Creative Commons Attribution License (CC BY). The use, distribution or reproduction in other forums is permitted, provided the original author(s) and the copyright owner(s) are credited and that the original publication in this journal is cited, in accordance with accepted academic practice. No use, distribution or reproduction is permitted which does not comply with these terms.
*Correspondence: Vilma Ducman, vilma.ducman@zag.si