
Quantification of the Link between Timed Up-and-Go Test Subtasks and Contractile Muscle Properties

 , , , and
Abstract
:1. Introduction
2. Materials and Methods
2.1. Participants
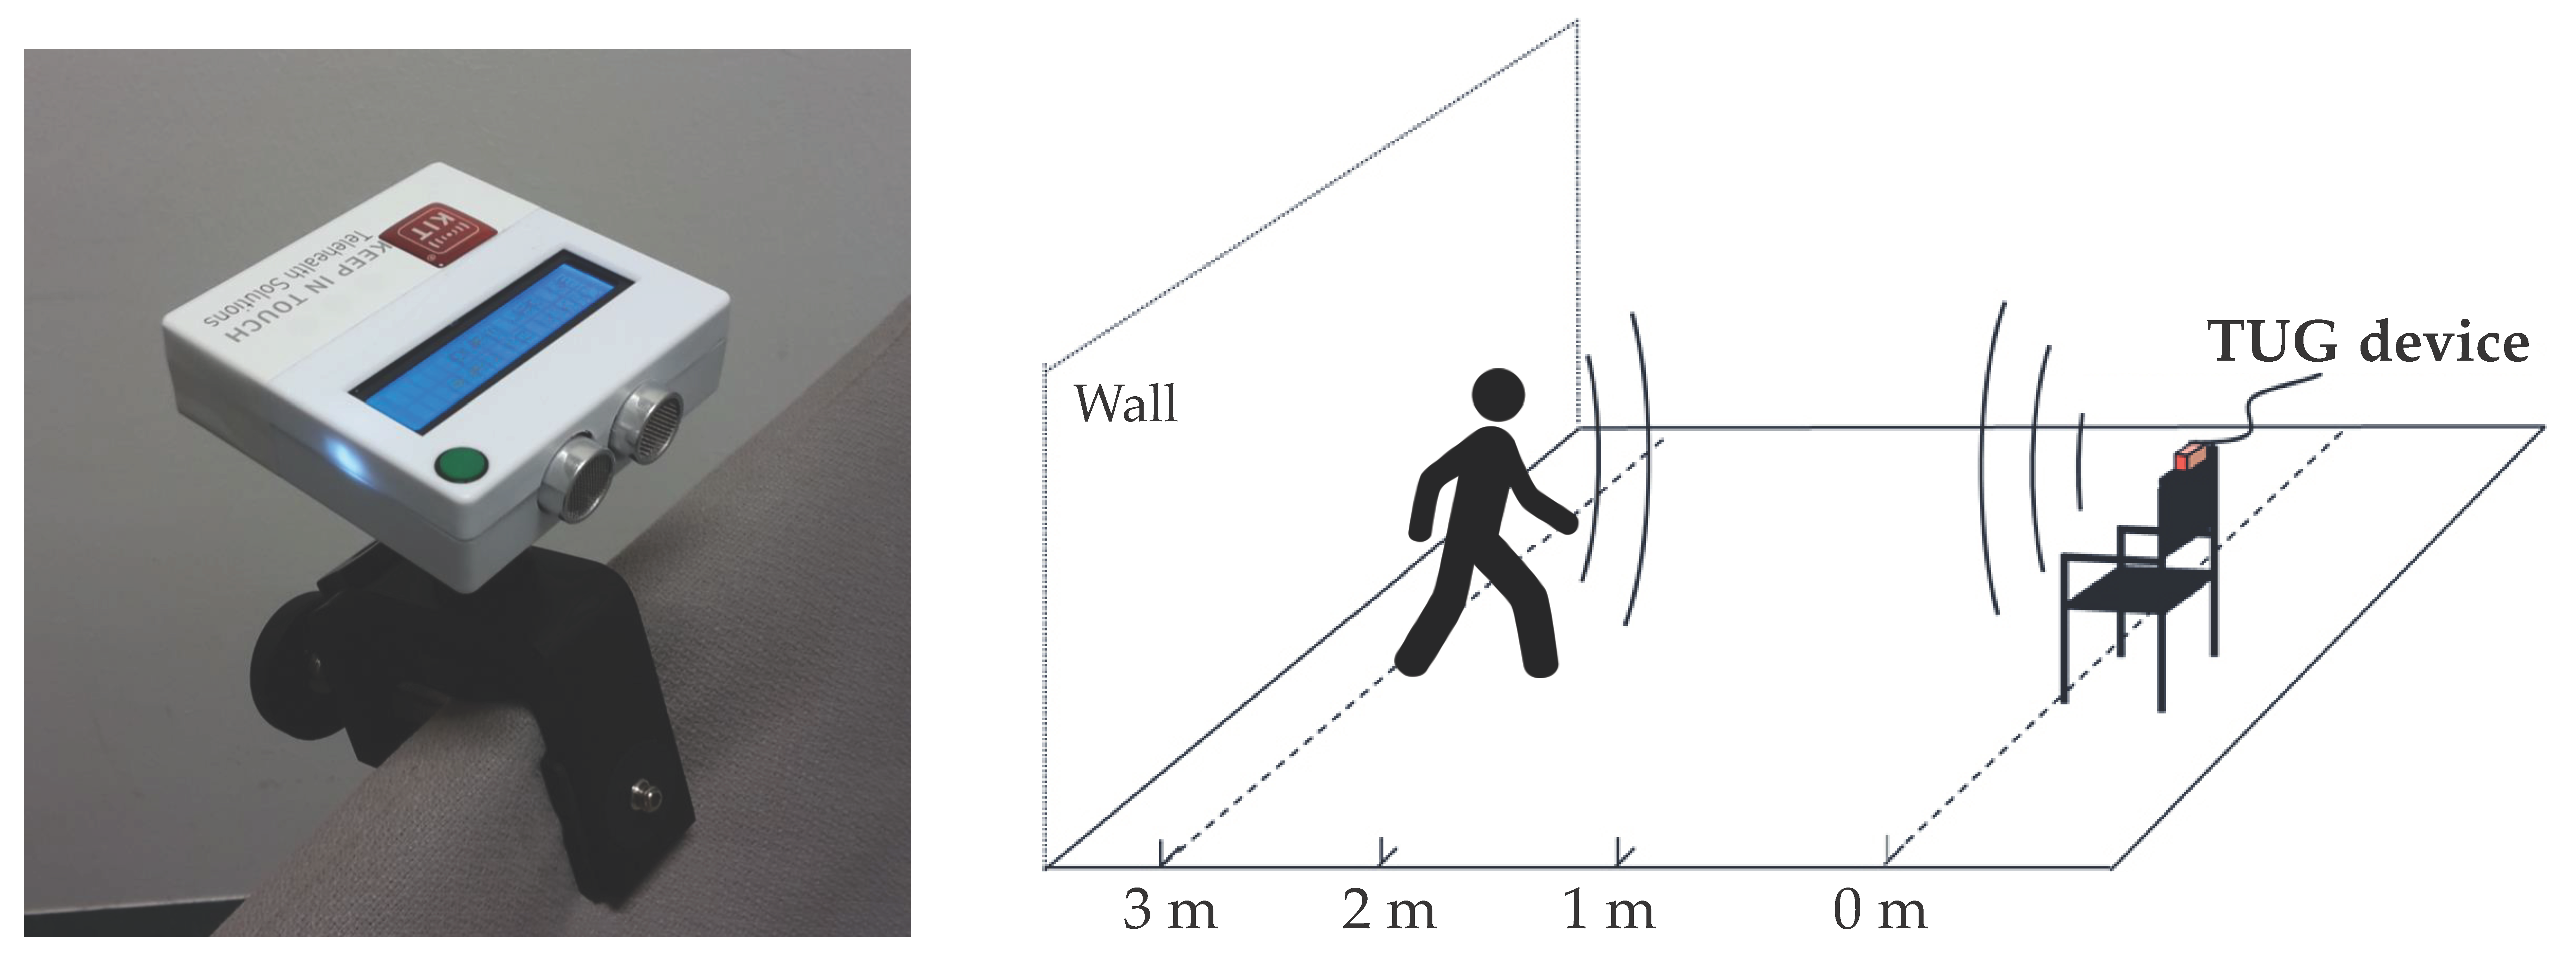
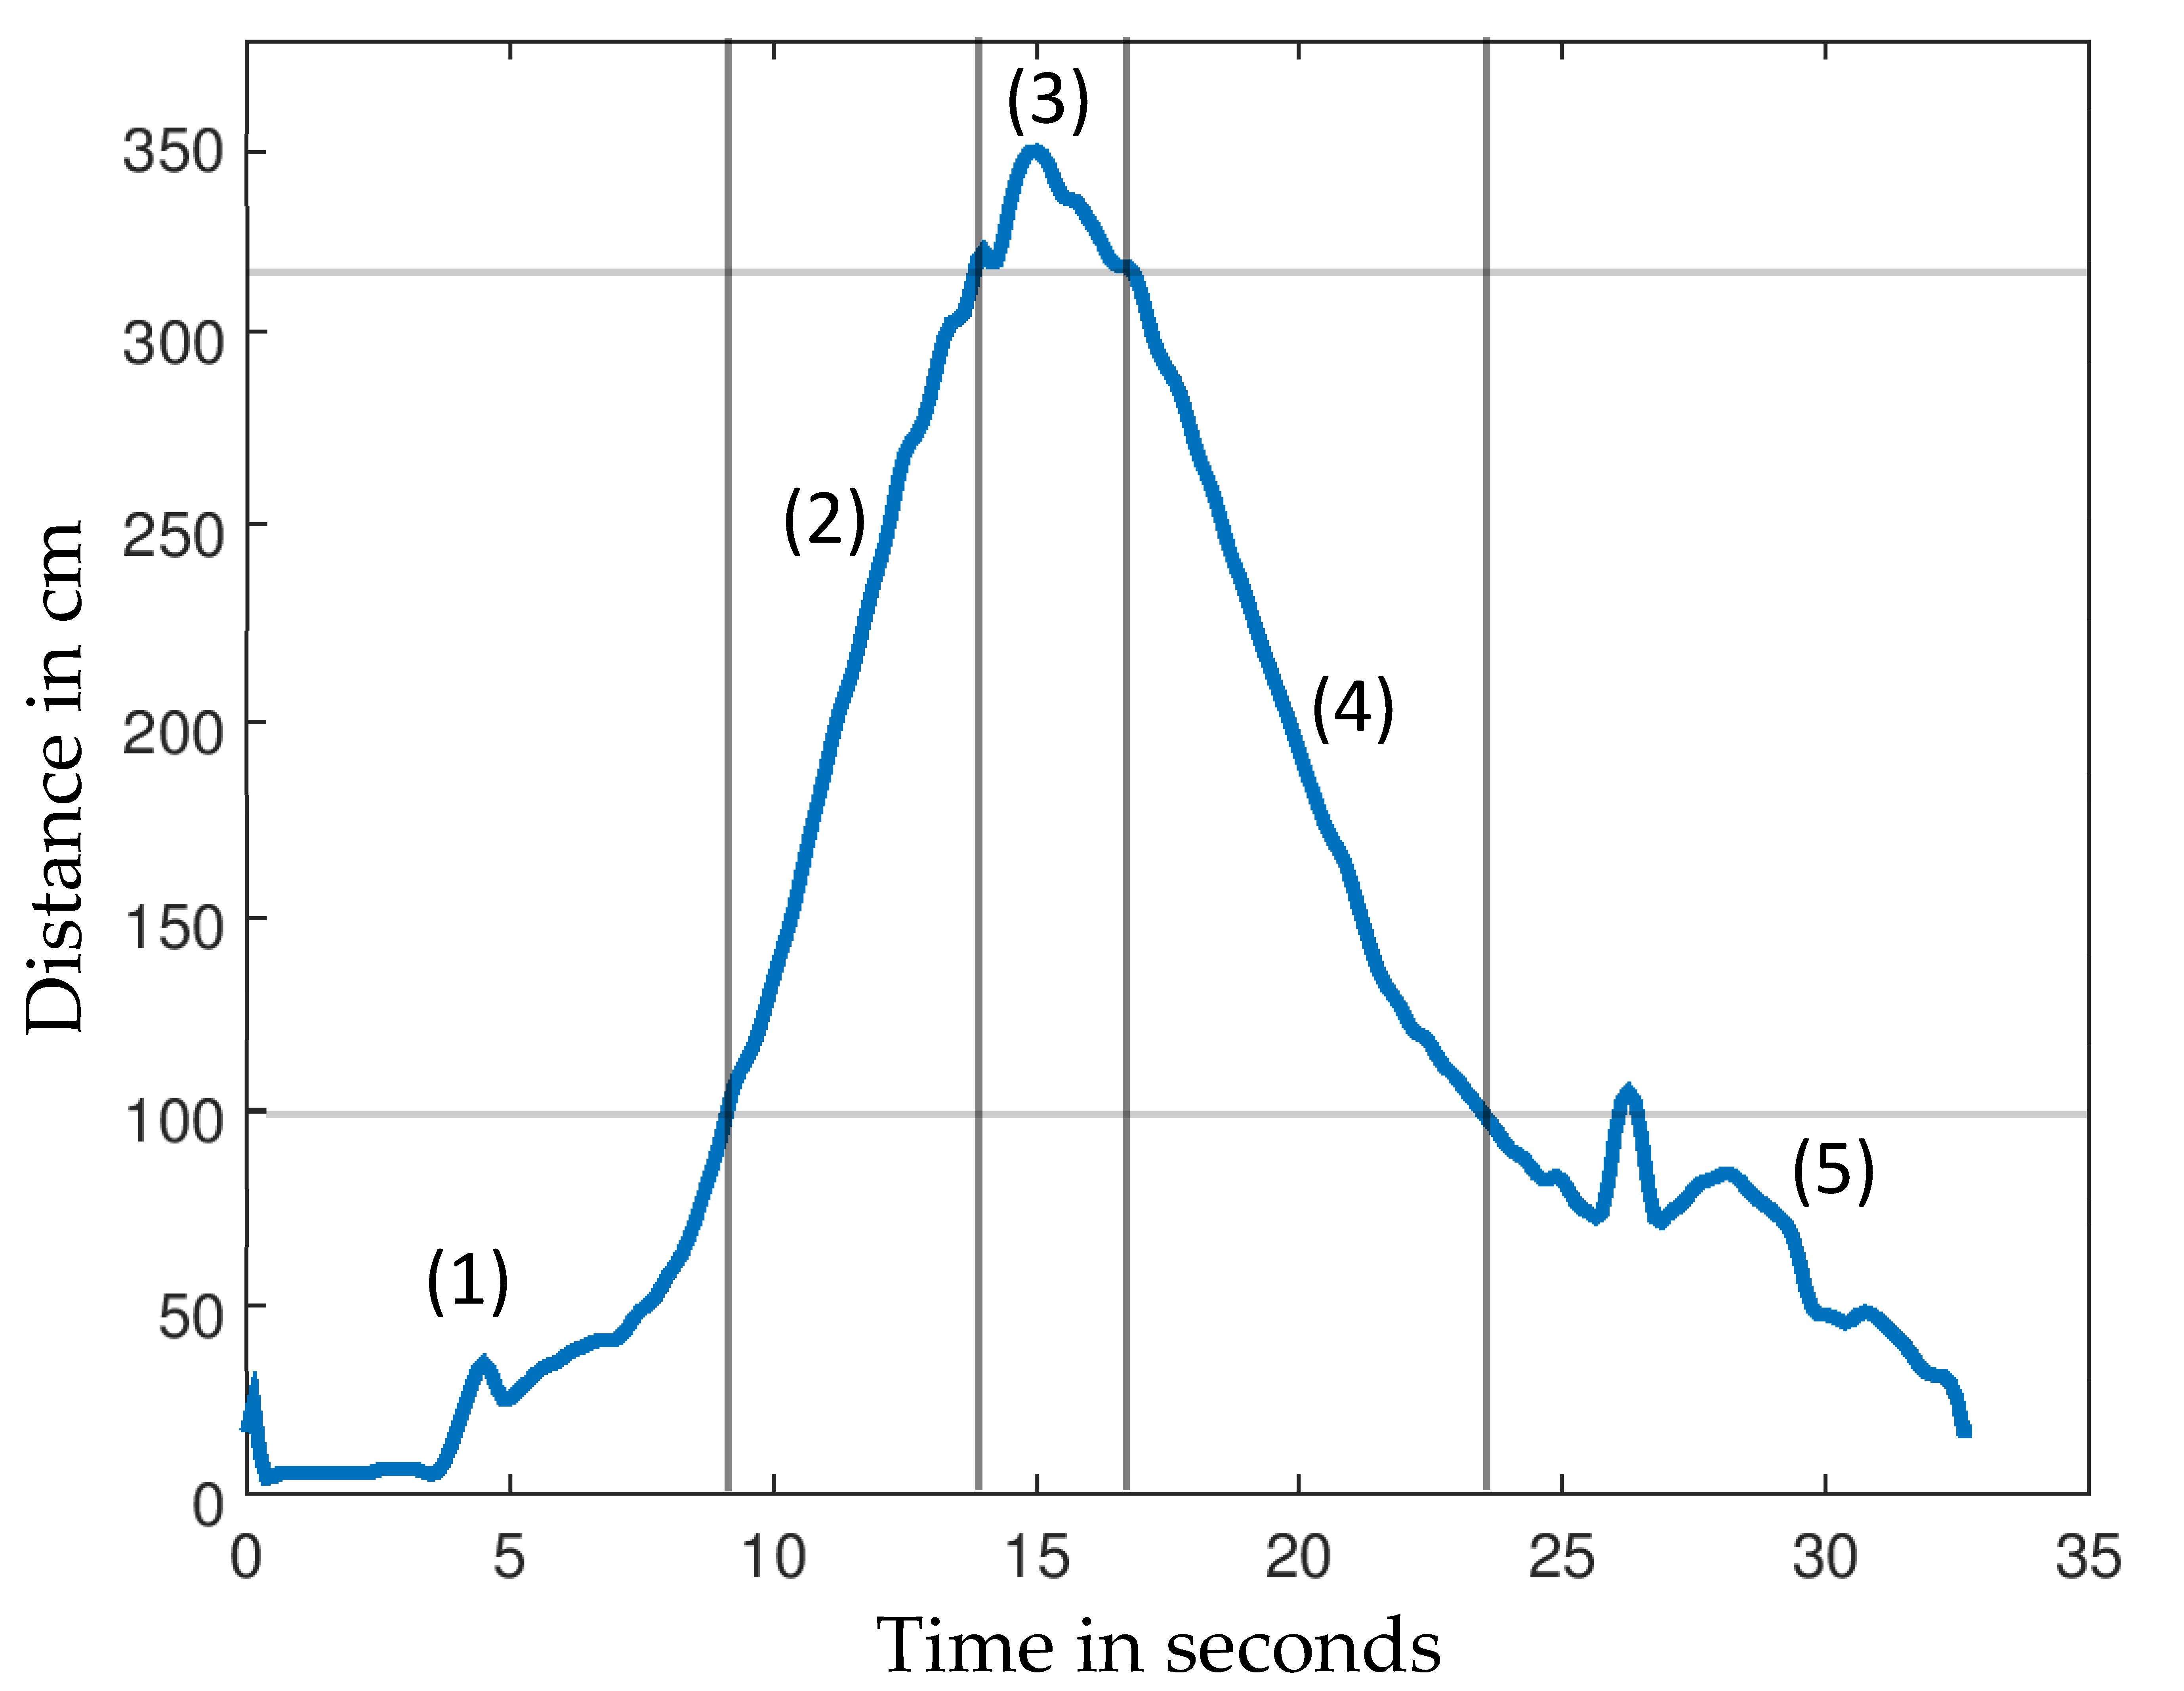
2.2. Timed Up-and-Go Test Measurements
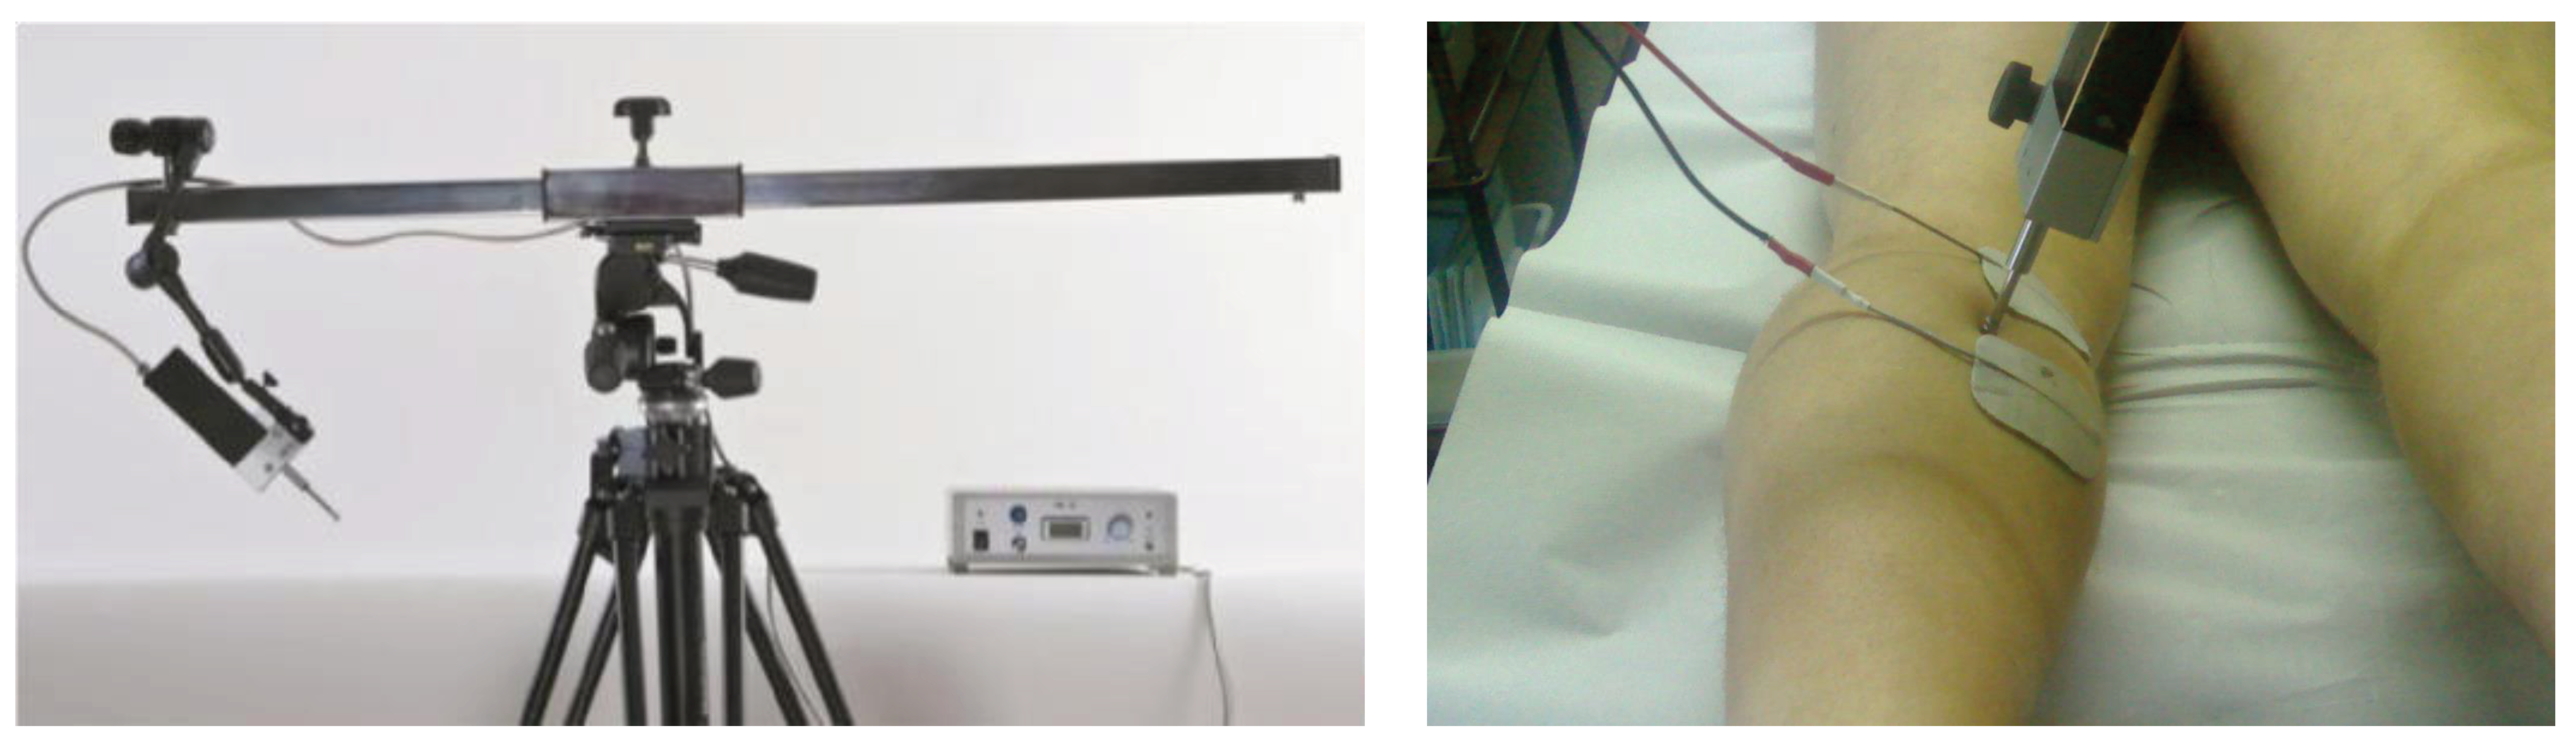
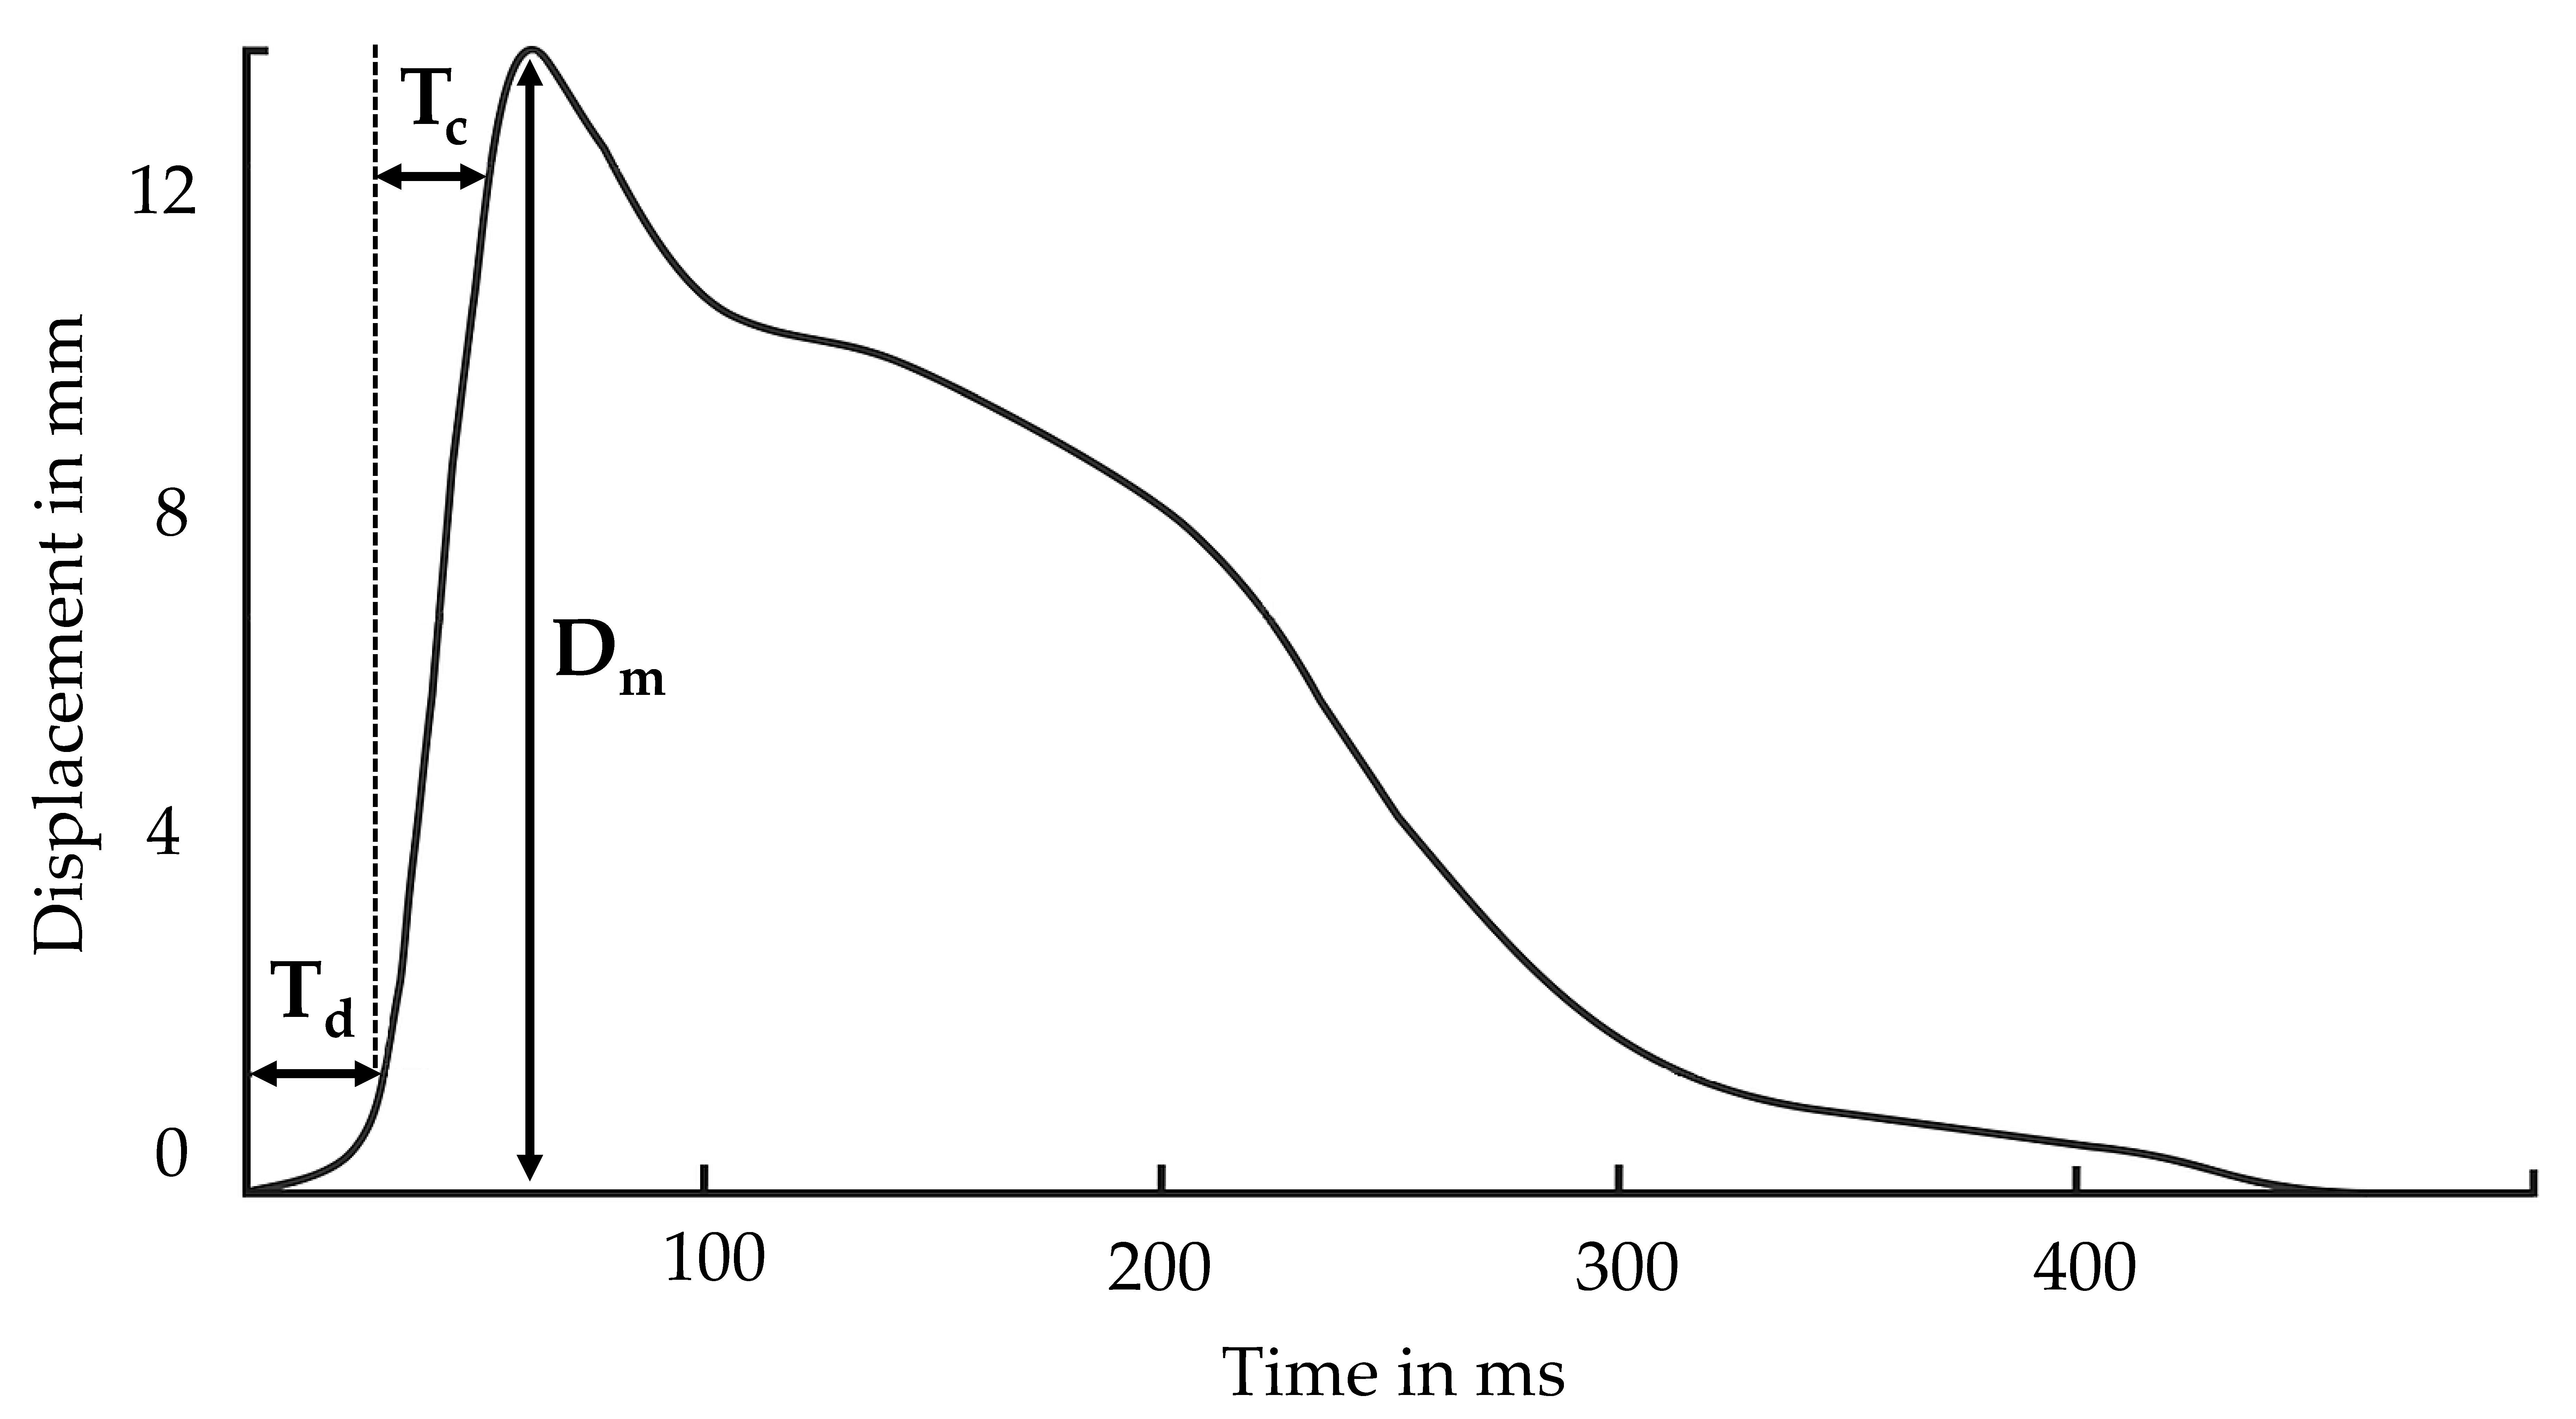
2.3. Tensiomyography Measurements
2.4. Study Design
2.5. Statistical Analysis
3. Results
4. Discussion
5. Conclusions
Author Contributions
Funding
Institutional Review Board Statement
Informed Consent Statement
Acknowledgments
Conflicts of Interest
Ethical Statements
References
- Fried, L.P.; Tangen, C.M.; Walston, J.; Newman, A.B.; Hirsch, C.; Gottdiener, J.; Seeman, T.; Tracy, R.; Kop, W.J.; Burke, G.; et al. Frailty in Older Adults: Evidence for a Phenotype. J. Gerontol. Ser. A Biol. Sci. Med. Sci. 2001, 56, M146–M157. [Google Scholar] [CrossRef]
- Kojima, G. Frailty as a Predictor of Future Falls among Community-Dwelling Older People: A Systematic Review and Meta-Analysis. J. Am. Med. Dir. Assoc. 2015, 16, 1027–1033. [Google Scholar] [CrossRef] [PubMed]
- Kalache, A.; Fu, D.; Yoshida, S.; World Health Organization; Ageing, Life Course Uni. WHO Global Report on Falls Prevention in Older Age; World Health Organization: Geneva, Switzerland, 2008. [Google Scholar]
- Cheng, M.-H.; Chang, S.-F. Frailty as a Risk Factor for Falls among Community Dwelling People: Evidence from a Meta-Analysis. J. Nurs. Scholarsh. 2017, 49, 529–536. [Google Scholar] [CrossRef] [PubMed]
- Cruz-Jentoft, A.J.; Baeyens, J.P.; Bauer, J.M.; Boirie, Y.; Cederholm, T.; Landi, F.; Martin, F.C.; Michel, J.-P.; Rolland, Y.; Schneider, S.M.; et al. Sarcopenia: European Consensus on Definition and DiagnosisReport of the European Working Group on Sarcopenia in Older PeopleA. J. Cruz-Gentoft et Al. Age Ageing 2010, 39, 412–423. [Google Scholar] [CrossRef] [PubMed] [Green Version]
- Horlings, C.G.; Van Engelen, B.G.; Allum, J.H.; Bloem, B.R. A Weak Balance: The Contribution of Muscle Weakness to Postural Instability and Falls. Nat. Clin. Pract. Neurol. 2008, 4, 504–515. [Google Scholar] [CrossRef] [PubMed]
- Tieland, M.; Trouwborst, I.; Clark, B.C. Skeletal Muscle Performance and Ageing. J. Cachexia Sarcopenia Muscle 2018, 9, 3–19. [Google Scholar] [CrossRef] [PubMed]
- Pišot, R.; Marusic, U.; Biolo, G.; Mazzucco, S.; Lazzer, S.; Grassi, B.; Reggiani, C.; Toniolo, L.; Di Prampero, P.E.; Passaro, A.; et al. Greater Loss in Muscle Mass and Function but Smaller Metabolic Alterations in Older Compared with Younger Men Following 2 Wk of Bed Rest and Recovery. J. Appl. Physiol. 2016, 120, 922–929. [Google Scholar] [CrossRef] [Green Version]
- Goswami, N. Falls and Fall-Prevention in Older Persons: Geriatrics Meets Spaceflight! Front. Physiol. 2017, 8, 603. [Google Scholar] [CrossRef] [PubMed] [Green Version]
- Cruz-Jentoft, A.J.; Bahat, G.; Bauer, J.; Boirie, Y.; Bruyère, O.; Cederholm, T.; Cooper, C.; Landi, F.; Rolland, Y.; Sayer, A.A.; et al. Sarcopenia: Revised European Consensus on Definition and Diagnosis. Age Ageing 2019, 48, 16–31. [Google Scholar] [CrossRef] [Green Version]
- Mühlberg, W.; Sieber, C. Sarcopenia and Frailty in Geriatric Patients: Implications for Training and Prevention. Z. Für Gerontol. Und Geriatr. 2004, 37, 2–8. [Google Scholar] [CrossRef]
- Schöne, D.; Freiberger, E.; Sieber, C. Influence of Skeletal Muscles on the Risk of Falling in Old Age. Der Internist 2017, 58, 359–370. [Google Scholar] [CrossRef]
- König, N.; Taylor, W.; Armbrecht, G.; Dietzel, R.; Singh, N. Identification of Functional Parameters for the Classification of Older Female Fallers and Prediction of ‘First-Time’Fallers. J. R. Soc. Interface 2014, 11, 20140353. [Google Scholar] [CrossRef] [PubMed]
- Podsiadlo, D.; Richardson, S. The Timed “Up & Go”: A Test of Basic Functional Mobility for Frail Elderly Persons. J. Am. Geriatr. Soc. 1991, 39, 142–148. [Google Scholar]
- Savva, G.M.; Donoghue, O.A.; Horgan, F.; O’Regan, C.; Cronin, H.; Kenny, R.A. Using Timed Up-and-Go to Identify Frail Members of the Older Population. J. Gerontol. Ser. A Biomed. Sci. Med. Sci. 2013, 68, 441–446. [Google Scholar] [CrossRef] [PubMed]
- Filippin, L.I.; Miraglia, F.; Leite, J.C.C.; Chakr, R.; Oliveira, N.C.; Berwanger, D.D. Identifying Frailty Syndrome with TUG Test in Home-Dwelling Elderly. Geriatr. Gerontol. Aging 2017, 11, 80–87. [Google Scholar] [CrossRef] [Green Version]
- Greene, B.R.; Doheny, E.P.; O’Halloran, A.; Anne Kenny, R. Frailty Status Can Be Accurately Assessed Using Inertial Sensors and the TUG Test. Age Ageing 2014, 43, 406–411. [Google Scholar] [CrossRef] [Green Version]
- Barry, E.; Galvin, R.; Keogh, C.; Horgan, F.; Fahey, T. Is the Timed Up and Go Test a Useful Predictor of Risk of Falls in Community Dwelling Older Adults: A Systematic Review and Meta-Analysis. BMC Geriatr. 2014, 14, 14. [Google Scholar] [CrossRef]
- Beauchet, O.; Fantino, B.; Allali, G.; Muir, S.; Montero-Odasso, M.; Annweiler, C. Timed Up and Go Test and Risk of Falls in Older Adults: A Systematic Review. J. Nutr. Health Aging 2011, 15, 933–938. [Google Scholar] [CrossRef] [PubMed]
- Ansai, J.H.; Farche, A.C.S.; Rossi, P.G.; de Andrade, L.P.; Nakagawa, T.H.; de Medeiros Takahashi, A.C. Performance of Different Timed up and Go Subtasks in Frailty Syndrome. J. Geriatr. Phys. Ther. 2019, 42, 287–293. [Google Scholar] [CrossRef]
- Ansai, J.H.; de Andrade, L.P.; Nakagawa, T.H.; Rebelatto, J.R. Performances on the Timed Up and Go Test and Subtasks between Fallers and Non-Fallers in Older Adults with Cognitive Impairment. Arq. De Neuro-Psiquiatr. 2018, 76, 381–386. [Google Scholar] [CrossRef]
- Li, T.; Chen, J.; Hu, C.; Ma, Y.; Wu, Z.; Wan, W.; Huang, Y.; Jia, F.; Gong, C.; Wan, S.; et al. Automatic Timed Up-and-Go Sub-Task Segmentation for Parkinson’s Disease Patients Using Video-Based Activity Classification. IEEE Trans. Neural Syst. Rehabil. Eng. 2018, 26, 2189–2199. [Google Scholar] [CrossRef] [PubMed]
- Mirelman, A.; Weiss, A.; Buchman, A.S.; Bennett, D.A.; Giladi, N.; Hausdorff, J.M. Association between Performance on Timed Up and Go Subtasks and Mild Cognitive Impairment: Further Insights into the Links between Cognitive and Motor Function. J. Am. Geriatr. Soc. 2014, 62, 673–678. [Google Scholar] [CrossRef] [PubMed]
- Hsieh, C.-Y.; Huang, H.-Y.; Liu, K.-C.; Chen, K.-H.; Hsu, S.J.-P.; Chan, C.-T. Subtask Segmentation of Timed Up and Go Test for Mobility Assessment of Perioperative Total Knee Arthroplasty. Sensors 2020, 20, 6302. [Google Scholar] [CrossRef] [PubMed]
- Moreland, J.D.; Richardson, J.A.; Goldsmith, C.H.; Clase, C.M. Muscle Weakness and Falls in Older Adults: A Systematic Review and Meta-Analysis. J. Am. Geriatr. Soc. 2004, 52, 1121–1129. [Google Scholar] [CrossRef] [PubMed]
- Simunic, B.; Degens, H.; Rittweger, J.; Narici, M.; Mekjavic, I.; Pisot, R. Noninvasive Estimation of Myosin Heavy Chain Composition in Human Skeletal Muscle. Med. Sci. Sports Exerc. 2011, 43, 1619–1625. [Google Scholar] [CrossRef] [Green Version]
- Loturco, I.; Pereira, L.A.; Kobal, R.; Kitamura, K.; Ramírez-Campillo, R.; Zanetti, V.; Abad, C.C.C.; Nakamura, F.Y. Muscle Contraction Velocity: A Suitable Approach to Analyze the Functional Adaptations in Elite Soccer Players. J. Sports Sci. Med. 2016, 15, 483. [Google Scholar]
- Macgregor, L.J.; Hunter, A.M.; Orizio, C.; Fairweather, M.M.; Ditroilo, M. Assessment of Skeletal Muscle Contractile Properties by Radial Displacement: The Case for Tensiomyography. Sports Med. 2018, 48, 1607–1620. [Google Scholar] [CrossRef] [Green Version]
- García-Manso, J.M.; Rodríguez-Ruiz, D.; Rodríguez-Matoso, D.; de Saa, Y.; Sarmiento, S.; Quiroga, M. Assessment of Muscle Fatigue after an Ultra-Endurance Triathlon Using Tensiomyography (TMG). J. Sports Sci. 2011, 29, 619–625. [Google Scholar] [CrossRef]
- Pišot, R.; Narici, M.V.; Šimunič, B.; De Boer, M.; Seynnes, O.; Jurdana, M.; Biolo, G.; Mekjavić, I.B. Whole Muscle Contractile Parameters and Thickness Loss during 35-Day Bed Rest. Eur. J. Appl. Physiol. 2008, 104, 409–414. [Google Scholar] [CrossRef]
- Šimunič, B.; Koren, K.; Rittweger, J.; Lazzer, S.; Reggiani, C.; Rejc, E.; Pišot, R.; Narici, M.; Degens, H. Tensiomyography Detects Early Hallmarks of Bed-Rest-Induced Atrophy before Changes in Muscle Architecture. J. Appl. Physiol. 2019, 126, 815–822. [Google Scholar] [CrossRef] [Green Version]
- Rodríguez-Ruiz, D.; García-Manso, J.M.; Rodríguez-Matoso, D.; Sarmiento, S.; Da Silva-Grigoletto, M.; Pisot, R. Effects of Age and Physical Activity on Response Speed in Knee Flexor and Extensor Muscles. Eur. Rev. Aging Phys. Act. 2013, 10, 127–132. [Google Scholar] [CrossRef] [Green Version]
- Martinez, B.P.; Gomes, I.B.; de Oliveira, C.S.; Ramos, I.R.; Rocha, M.D.M.; Forgiarini, L.A.; Camelier, F.W.R.; Camelier, A.A. Accuracy of the Timed Up and Go Test for Predicting Sarcopenia in Elderly Hospitalized Patients. Clinics 2015, 70, 369–372. [Google Scholar] [CrossRef]
- Filippin, L.I.; Miraglia, F.; Teixeira, V.N.O.; Boniatti, M.M. Timed Up and Go Test as a Sarcopenia Screening Tool in Home-Dwelling Elderly Persons. Rev. Bras. De Geriatr. E Gerontol. 2017, 20, 556–561. [Google Scholar] [CrossRef] [Green Version]
- Paravlic, A.H.; Pisot, R.; Simunic, B. Muscle-Specific Changes of Lower Extremities in the Early Period after Total Knee Arthroplasty: Insight from Tensiomyography. J. Musculoskelet. Neuronal Interact. 2020, 20, 390. [Google Scholar]
- Ziegl, A.; Hayn, D.; Kastner, P.; Löffler, K.; Weidinger, L.; Brix, B.; Goswami, N.; Schreier, G. Quantitative Falls Risk Assessment in Elderly People: Results from a Clinical Study with Distance Based Timed up-and-Go Test Recordings. Physiol. Meas. 2020, 41, 115006. [Google Scholar] [CrossRef]
- Fabiani, E.; Herc, M.; Šimunič, B.; Brix, B.; Löffler, K.; Weidinger, L.; Ziegl, A.; Kastner, P.; Kapel, A.; Goswami, N. Correlation between Timed up and Go Test and Skeletal Muscle Tensiomyography in Female Nursing Home Residents. J. Musculoskelet. Neuronal Interact. 2021, 21, 247. [Google Scholar]
- Ziegl, A.; Modre-Osprian, R.; Sánchez, A.; Falgenhauer, M.; Kastner, P.; Schreier, G. Timed Up-and-Go Device for Unsupervised Functional Assessment of Elderly Patients. In Proceedings of the eHealth, Vienna, Austria, 23–24 May 2017; pp. 298–304. [Google Scholar]
- Ziegl, A.; Kastner, P.; Modre-Osprian, R.; Schreier, G. Automated Measurement and Subtask Analysis of the Timed Up-and-Go Test in the Field of Geriatrics. In Proceedings of the 2018 40th Annual International Conference of the IEEE Engineering in Medicine and Biology Society (EMBC), Honolulu, HI, USA, 17–21 July 2018; pp. 1526–1529. [Google Scholar]
- Šimunič, B. Two-Dimensional Spatial Error Distribution of Key Tensiomyographic Parameters. J. Biomech. 2019, 92, 92–97. [Google Scholar] [CrossRef] [PubMed]
- Hayn, D.; Veeranki, S.; Kropf, M.; Eggerth, A.; Kreiner, K.; Kramer, D.; Schreier, G. Predictive Analytics for Data Driven Decision Support in Health and Care. It-Inf. Technol. 2018, 60, 183–194. [Google Scholar] [CrossRef]
- Hamrick, M.W.; McGee-Lawrence, M.E.; Frechette, D.M. Fatty Infiltration of Skeletal Muscle: Mechanisms and Comparisons with Bone Marrow Adiposity. Front. Endocrinol. 2016, 7, 69. [Google Scholar] [CrossRef] [PubMed] [Green Version]
- Blanpied, P.; Smidt, G.L. The Difference in Stiffness of the Active Plantarflexors between Young and Elderly Human Females. J. Gerontol. 1993, 48, M58–M63. [Google Scholar] [CrossRef] [PubMed]
- Marcucci, L.; Reggiani, C. Increase of Resting Muscle Stiffness, a Less Considered Component of Age-Related Skeletal Muscle Impairment. Eur. J. Transl. Myol. 2020, 30, 8982. [Google Scholar] [CrossRef] [PubMed]
- Cobo, A.; Villalba-Mora, E.; Pérez-Rodríguez, R.; Ferre, X.; Escalante, W.; Moral, C.; Rodriguez-Mañas, L. Automatic and Real-Time Computation of the 30-Seconds Chair-Stand Test without Professional Supervision for Community-Dwelling Older Adults. Sensors 2020, 20, 5813. [Google Scholar] [CrossRef] [PubMed]
- Fudickar, S.; Kiselev, J.; Stolle, C.; Frenken, T.; Steinhagen-Thiessen, E.; Wegel, S.; Hein, A. Validation of a Laser Ranged Scanner-Based Detection of Spatio-Temporal Gait Parameters Using the ATUG Chair. Sensors 2021, 21, 1343. [Google Scholar] [CrossRef] [PubMed]
- Weiss, A.; Mirelman, A.; Giladi, N.; Barnes, L.L.; Bennett, D.A.; Buchman, A.S.; Hausdorff, J.M. Transition between the Timed Up and Go Turn to Sit Subtasks: Is Timing Everything? J. Am. Med. Dir. Assoc. 2016, 17, 864.e9–864.e15. [Google Scholar] [CrossRef] [PubMed] [Green Version]


| Mean ± Std | Min | Max | |
|---|---|---|---|
| Age, years | 86.74 ± 7.88 | 67 | 99 |
| Body height, cm | 160.40 ± 10.10 | 148.0 | 188.0 |
| Body mass, kg | 64.84 ± 12.97 | 50.0 | 96.70 |
| Body mass index, kg/m2 | 25.10 ± 3.60 | 18.61 | 34.67 |
| Mean ± Std | Min | Max | |
|---|---|---|---|
| Tensiomyography Results | |||
| Biceps femoris Tc, ms | 40.79 ± 8.79 | 26.46 | 71.83 |
| Biceps femoris Td, ms | 30.43 ± 5.09 | 21.96 | 44.28 |
| Biceps femoris Dm, mm | 4.43 ± 2.62 | 0.58 | 10.79 |
| Gastrocnemius medialis Tc, ms | 31.60 ± 6.67 | 19.02 | 47.95 |
| Gastrocnemius medialis Td, ms | 25.82 ± 3.72 | 20.02 | 34.04 |
| Gastrocnemius medialis Dm, mm | 2.49 ± 1.33 | 0.67 | 7.47 |
| Vastus lateralis Tc, ms | 29.94 ± 8.07 | 21.12 | 68.28 |
| Vastus lateralis Td, ms | 28.08 ± 3.50 | 20.79 | 38.00 |
| Vastus lateralis Dm, mm | 3.74 ± 1.68 | 0.53 | 8.36 |
| Vastus Medialis Tc, ms | 47.22 ± 12.16 | 23.61 | 70.64 |
| Vastus Medialis Td, ms | 29.07 ± 3.33 | 21.44 | 34.11 |
| Vastus Medialis Dm, mm | 5.84 ± 2.42 | 1.41 | 11.20 |
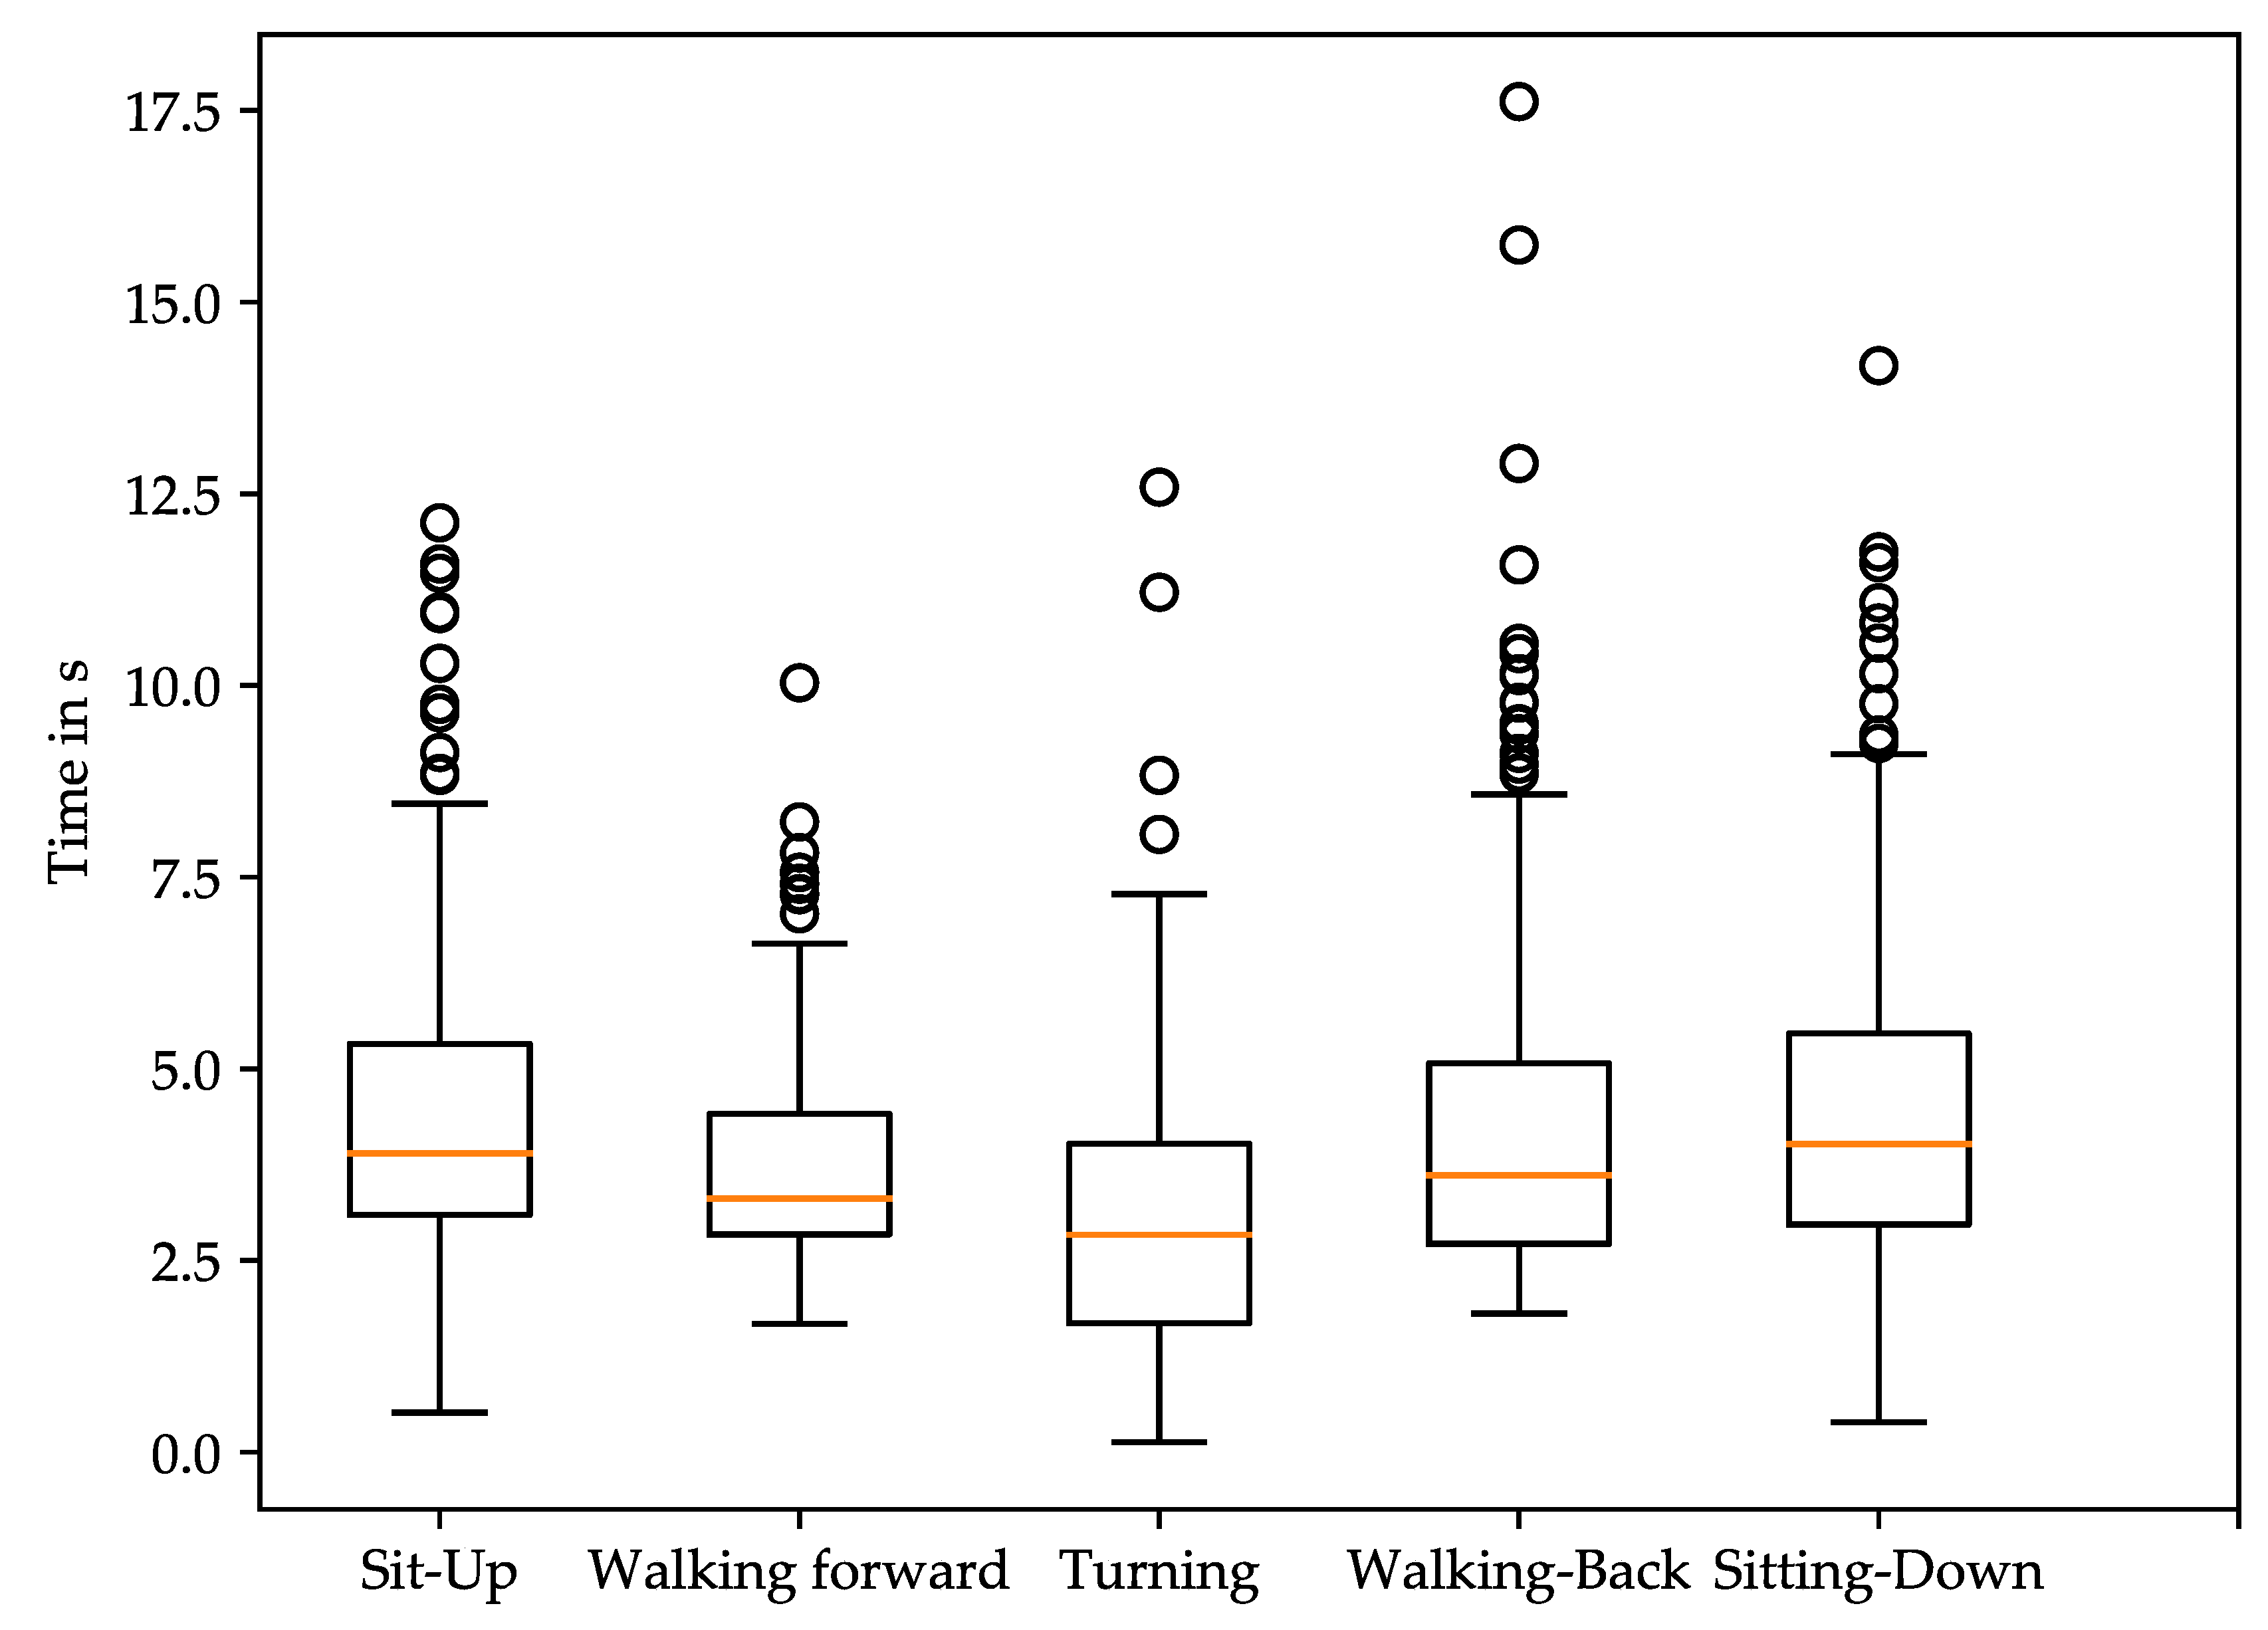
| Timed Up-and-Go test results | |||
| Timed up and go time, s | 20.30 ± 7.07 | 9.76 | 48.67 |
| Sit-up, s | 4.51 ± 2.12 | 0.52 | 12.12 |
| Sit-down, s | 4.59 ± 2.34 | 0.39 | 14.17 |
| Turnaround, s | 3.00 ± 2.00 | 0.13 | 17.61 |
| Walk-forward, s | 3.78 ± 1.46 | 1.67 | 10.03 |
| Walk-back, s | 4.41 ± 2.58 | 1.81 | 17.61 |
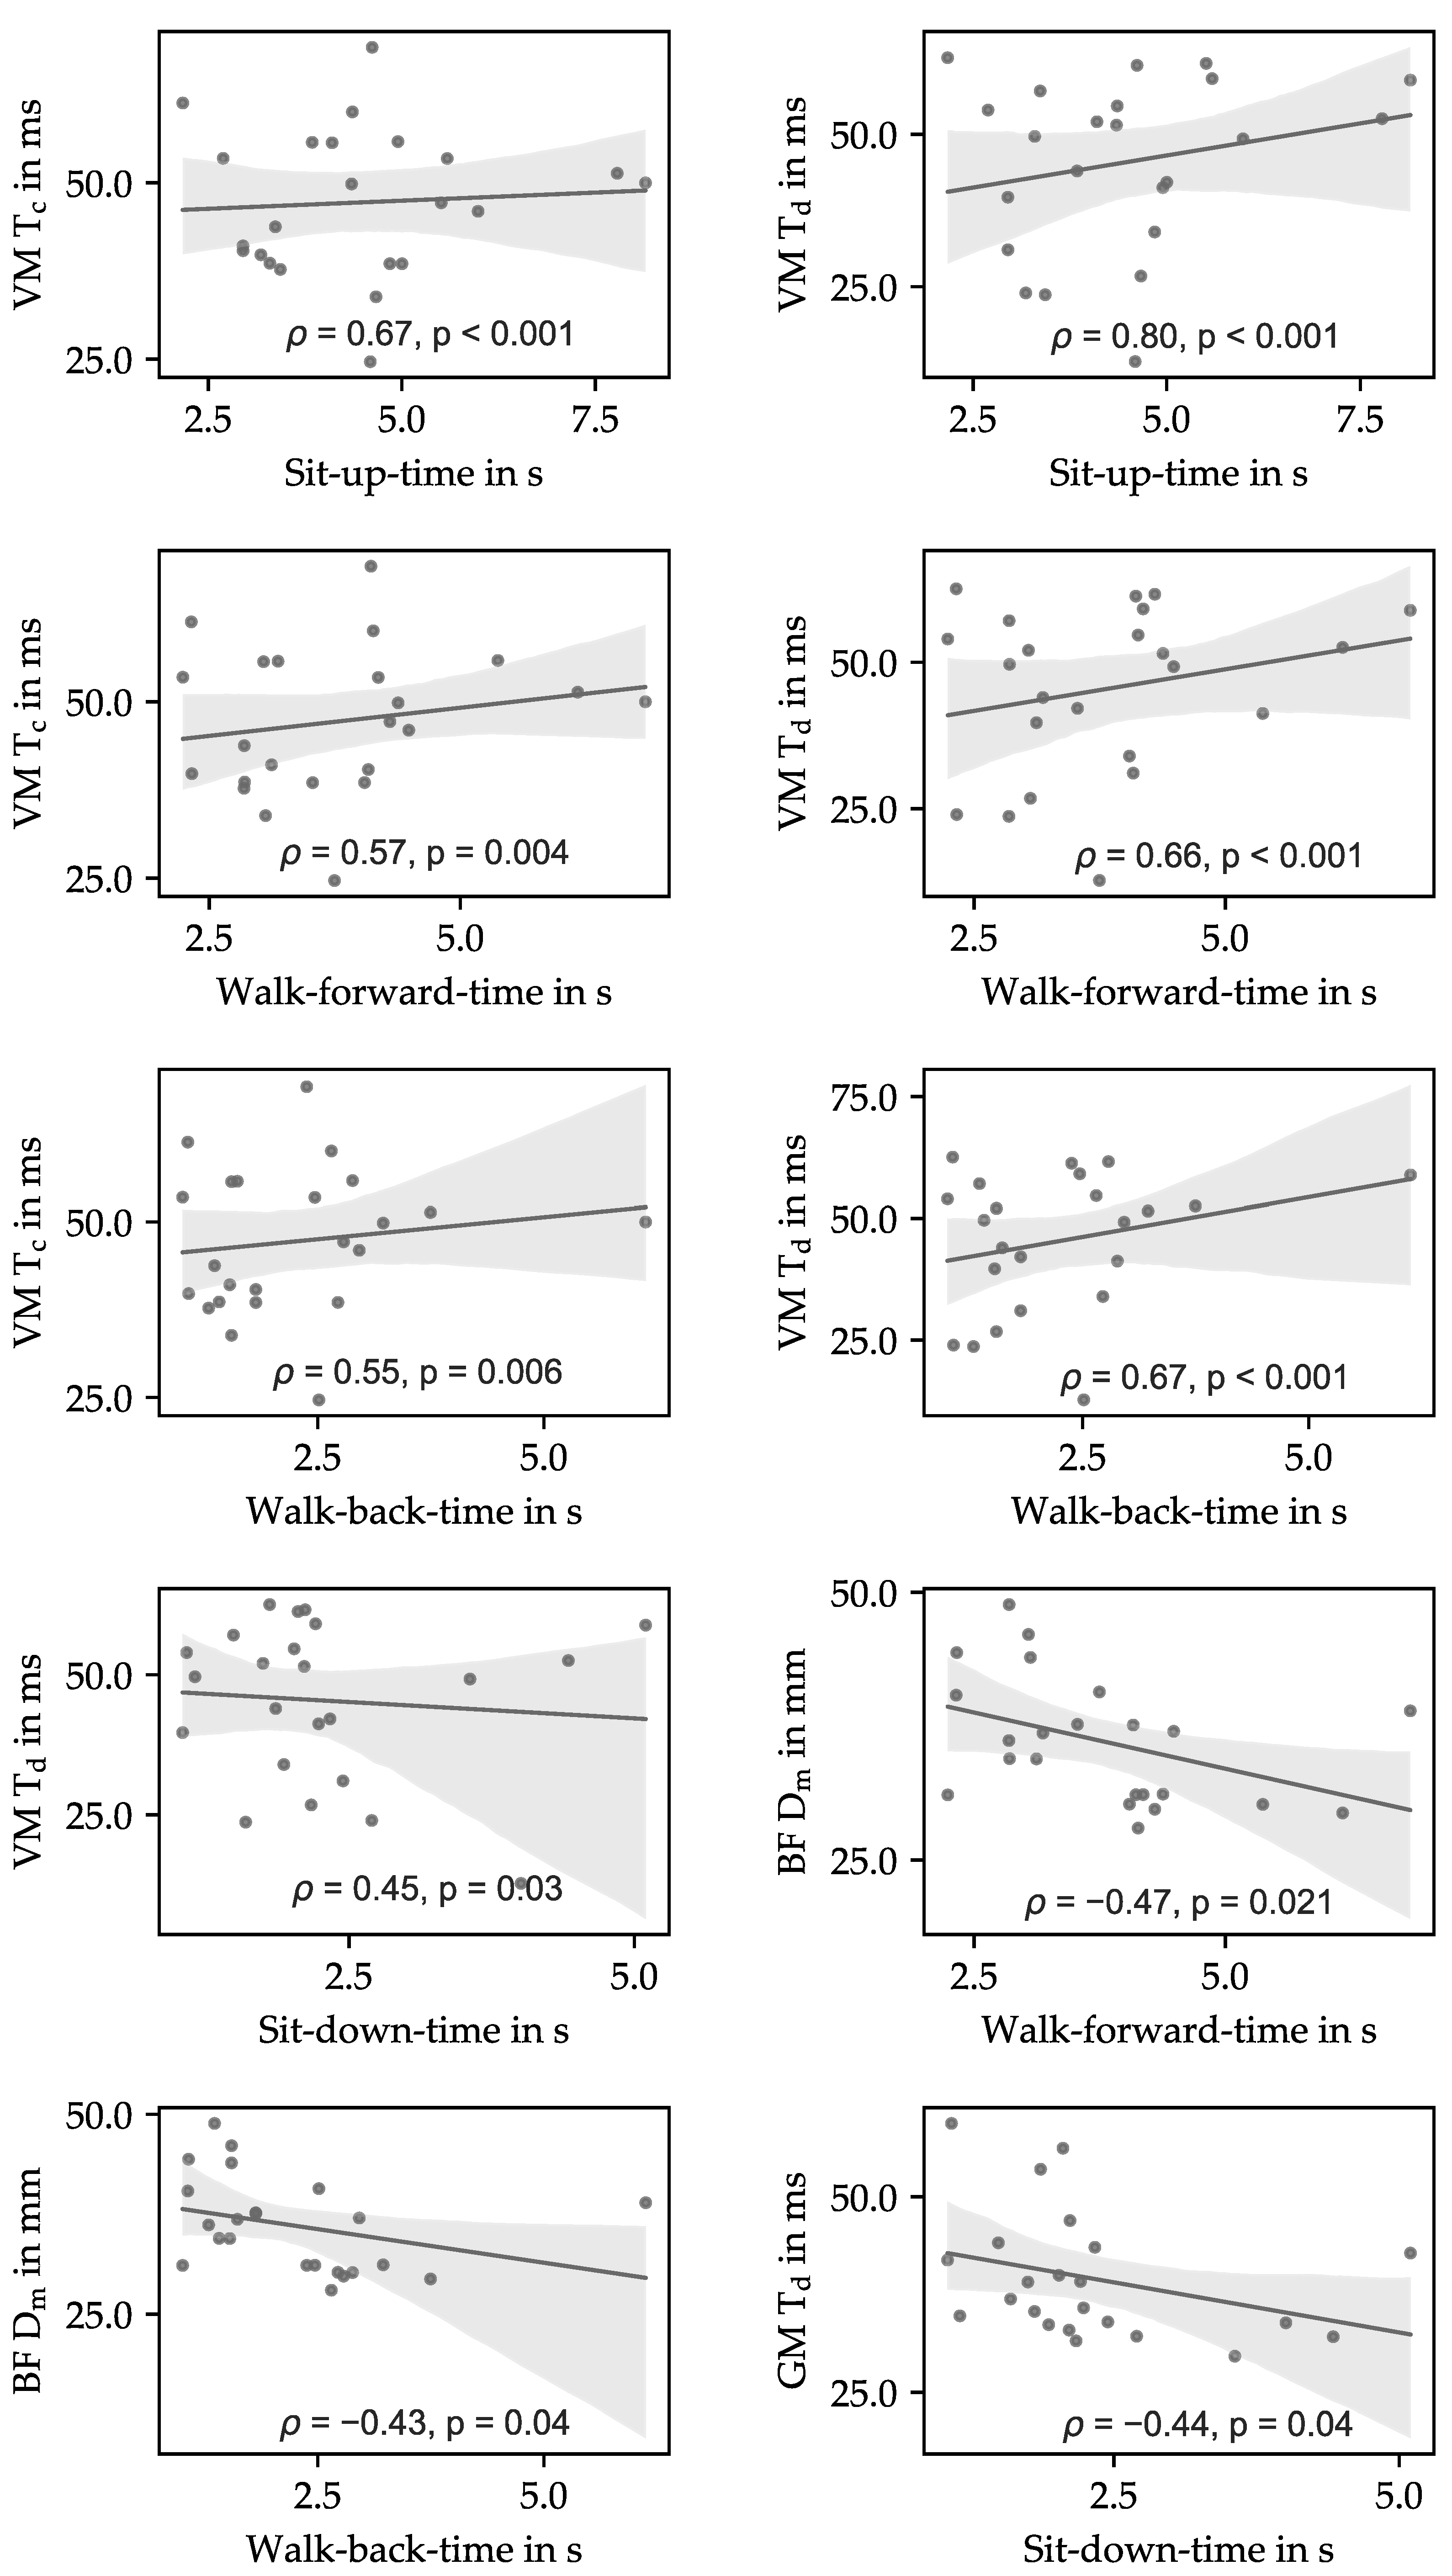
| TUG Time | ||||||||||||
|---|---|---|---|---|---|---|---|---|---|---|---|---|
| Sit-Up | Walking-Forward | Turning | Walking-Back | Sit-Down | Complete TUG Test | |||||||
| ρ | p | ρ | p | ρ | p | ρ | p | ρ | p | ρ | p | |
| BF Tc | −0.30 | 0.17 | −0.3 | 0.16 | −0.12 | 0.60 | −0.33 | 0.12 | −0.15 | 0.48 | −0.31 | 0.16 |
| BF Td | −0.06 | 0.80 | −0.17 | 0.43 | 0.07 | 0.76 | −0.17 | 0.44 | 0.05 | 0.81 | −0.00 | 0.99 |
| BF Dm | −0.29 | 0.19 | −0.47 | 0.021 | 0.09 | 0.70 | −0.43 | 0.04 | 0.05 | 0.81 | −0.28 | 0.20 |
| GM Tc | −0.13 | 0.55 | −0.05 | 0.81 | −0.03 | 0.89 | −0.12 | 0.58 | −0.23 | 0.29 | −0.14 | 0.54 |
| GM Td | −0.14 | 0.52 | −0.15 | 0.48 | −0.06 | 0.80 | −0.22 | 0.32 | −0.44 | 0.04 | −0.25 | 0.26 |
| GM Dm | −0.18 | 0.4 | −0.29 | 0.18 | 0.39 | 0.07 | −0.26 | 0.24 | 0.03 | 0.90 | −0.13 | 0.55 |
| VL Tc | 0.00 | 0.99 | 0.22 | 0.31 | −0.24 | 0.28 | 0.13 | 0.54 | −0.13 | 0.54 | 0.02 | 0.94 |
| VL Td | 0.17 | 0.45 | 0.20 | 0.35 | 0.26 | 0.23 | 0.15 | 0.50 | −0.14 | 0.53 | 0.08 | 0.72 |
| VL Dm | −0.31 | 0.13 | 0.16 | 0.46 | −0.08 | 0.71 | −0.19 | 0.38 | −0.24 | 0.27 | −0.31 | 0.14 |
| VM Tc | 0.67 | <0.001 * | 0.57 | 0.004 * | −0.13 | 0.55 | 0.55 | 0.006 | 0.33 | 0.12 | 0.54 | 0.008 |
| VM Td | 0.80 | <0.001 * | 0.66 | <0.001 * | −0.04 | 0.85 | 0.67 | <0.001 * | 0.45 | 0.03 | 0.70 | <0.001 |
| VM Dm | −0.28 | 0.19 | −0.27 | 0.20 | 0.06 | 0.78 | −0.26 | 0.23 | −0.05 | 0.83 | −0.27 | 0.21 |
Publisher’s Note: MDPI stays neutral with regard to jurisdictional claims in published maps and institutional affiliations. |
© 2021 by the authors. Licensee MDPI, Basel, Switzerland. This article is an open access article distributed under the terms and conditions of the Creative Commons Attribution (CC BY) license (https://creativecommons.org/licenses/by/4.0/).
Share and Cite
Ziegl, A.; Hayn, D.; Kastner, P.; Fabiani, E.; Šimunič, B.; Löffler, K.; Weidinger, L.; Brix, B.; Goswami, N.; Günter, S. Quantification of the Link between Timed Up-and-Go Test Subtasks and Contractile Muscle Properties. Sensors 2021, 21, 6539. https://doi.org/10.3390/s21196539
Ziegl A, Hayn D, Kastner P, Fabiani E, Šimunič B, Löffler K, Weidinger L, Brix B, Goswami N, Günter S. Quantification of the Link between Timed Up-and-Go Test Subtasks and Contractile Muscle Properties. Sensors. 2021; 21(19):6539. https://doi.org/10.3390/s21196539
Chicago/Turabian StyleZiegl, Andreas, Dieter Hayn, Peter Kastner, Ester Fabiani, Boštjan Šimunič, Kerstin Löffler, Lisa Weidinger, Bianca Brix, Nandu Goswami, and Schreier Günter. 2021. "Quantification of the Link between Timed Up-and-Go Test Subtasks and Contractile Muscle Properties" Sensors 21, no. 19: 6539. https://doi.org/10.3390/s21196539