
Influence of Nickel on Niobium Nitride Formation in As-Cast Stainless Steels


1
Institute of Metals and Technology, Lepi pot 11, 1000 Ljubljana, Slovenia
2
Faculty of Natural Sciences and Engineering, University of Ljubljana, Aškerčeva Cesta 12, 1000 Ljubljana, Slovenia
*
Author to whom correspondence should be addressed.
Metals 2022, 12(4), 609; https://doi.org/10.3390/met12040609
Submission received: 3 March 2022
/
Revised: 25 March 2022
/
Accepted: 30 March 2022
/
Published: 31 March 2022
Abstract
:The influence of the nickel content and cooling rate on niobium nitride precipitation in as-cast stainless steels were analysed. Niobium microalloying is important for mechanical properties and the prevention of intergranular corrosion in stainless steels. However, coarse precipitates can negatively affect steel properties. The precipitation of NbN depends on thermodynamic conditions, which are dictated by the chemical composition and temperature. The thermodynamic computations were used to estimate niobium nitride precipitation. Additionally, segregation models were used to predict precipitation. Three steel batches with different nickel contents (9 wt.%, 4.7 wt.%, and 0.16 wt.%) were prepared in an induction furnace and cast into sand moulds. The polished and etched samples were examined with an optical microscope, followed by a more detailed examination using a scanning electron microscope. An automatic scanning electron microscope analysis of the niobium particles was performed to obtain particle number and size distribution. Primary niobium carbonitrides, eutectic phases, and heterogenous nucleations on MnS inclusions were observed. As the proportion of nickel in the solution decreased, the solubility of nitrogen in the melt increased, which is manifested by a lower formation of primary and eutectic niobium carbonitrides, while MnS non-metallic inclusions played an important role in the heterogeneous nucleation.
1. Introduction
Stainless steels (SS) are highly resistant to corrosion, which is why they are widely used in a wide range of various areas [1]. Chromium is the most important alloying element as it forms a passive oxide layer. However, to achieve specific properties, SS can also be alloyed with elements such as niobium and nitrogen. Niobium is a strong ferrite-forming element and favours the solidification of delta ferrite It is added to improve creep resistance, increase hardness, and retain grain growth in ferritic and martensitic stainless steels (FSS and MSS). Niobium acts as a strong carbide- and nitride-forming element. The stabilization of austenitic stainless steel (ASS) means that niobium binds with carbon and prevents the formation of chromium carbides that cause intergranular corrosion. Meanwhile, niobium in FSS and MSS binds with nitrogen and carbon to form carbides, nitrides, and carbonitrides that improve the mechanical properties. The niobium carbides, nitrides, and carbonitrides inhibit the migration of dislocations and grain boundaries. These precipitates are stable at high temperatures, which allows the use of steels at elevated temperatures, and, also, slow down recrystallization, i.e., the growth of crystal grains during thermomechanical processes [2,3,4,5].
While nitrogen usually represents an impurity in steels, it is sometimes employed as an austenite-forming element in SS (it can partially replace nickel). Nitrogen is dissolved as an interstitial element and increases the strength and hardness. In duplex stainless steels, nitrogen is added to improve pitting corrosion resistance. However, excessive nitrogen causes gas formation, in the form of blowholes and gas porosity, or primary nitride and carbonitride particles [6,7,8,9].
The presence of both nitrogen and niobium in SS can cause nitride formation during solidification and the subsequent cooling. It is important that the particles are fine and evenly distributed throughout the matrix as coarse particles deteriorate steel properties. Non-equilibrium phases may also precipitate during solidification; the formation of coarse primary nitrides can be classified in this group. The formation of primary nitrides is associated with the segregation of alloying elements, the nitrides are large and sharp edged, which negatively affects the impact toughness (cleavage fracture) and high-temperature creep resistance (a source of voids) [7]. The precipitation of coarse nitrides and carbonitrides are, therefore, deleterious to the mechanical properties of steel.
The formation of primary nitrides depends on the chemical activity of nitrogen and niobium in the steel melt and during solidification. The presence of nickel lowers the solubility of nitrogen in the steel melt [10]. Nickel is a common alloying element in SS; it is especially important in ASS, where the contents are around 10 wt.%. Furthermore, segregation of nitrogen and niobium atoms occurs during solidification, which leads to the non-equilibrium formation of primary coarse niobium nitrides.
In this study, the effect of nickel on the niobium nitrides and carbonitrides precipitation were analysed in an as-cast microstructure. Three different steels, 9 wt.%, 4.7 wt.%, and 0.16 wt.% Ni, were produced. Additionally, the effect of different cooling rates on the precipitation of the nitrides and their size distribution was studied. The cooling rate affects the kinetics of nucleation and diffusion processes, which are important for the growth of particles.
2. Materials and Methods
Three 5 kg batches with different chemical compositions, shown in Table 1, were prepared in an open induction furnace. A protective argon atmosphere was created above the steel-melt surface to reduce the oxidation of the steel melt. The melt of individual quality was cast into a sand mould made by a CO2 process, according to the shape of the model in Figure 1. The model was divided into three sections with diameters of 20, 35, and 70 mm, which allowed solidification at different cooling rates. The temperature of the steel melt was monitored using type B thermocouples (PtRh30–PtRh6). For the time dependence of the melt temperature, cooling curves were made for each quality, and cooling rates were determined for different cross-sections of the casting.
Samples for metallographical analysis were cut from the middle of the casting. The ground and polished samples were etched with Vilella’s reagent, followed by microstructural characterization with an optical microscope (OM), Microphot FXA, Nikon (Nikon, Minato City, Japan), with a 3CCD video camera, Hitachi HV-C20A (Hitachi, Ltd., Tokyo, Japan). The ferrite content in the as-cast samples was estimated with a ferrite meter, Fisher Feritscope MP3 (Fisher, Sindelfingen, Germany). Characterization and the size distribution of the nitride particles were performed by a scanning electron microscope (SEM), Zeiss CrossBeam 550 (Carl Zeiss AG, Oberkochen, Germany), with an Octane Elite EDAX EDS microanalyzer (AMETEK, Inc., Berwyn, IL, USA) for energy-dispersive X-ray spectroscopy (EDS).
Thermodynamic calculations were performed with the commercial software Thermo-Calc (Thermo-Calc 2017a, Thermo-Calc Software AB, Stockholm, Sweden). The Thermo-Calc software TCFE8 Steels/Fe-alloys database was used to obtain the thermodynamic data for the calculations with a phase diagram calculator and Scheil solidification simulation calculator.
3. Results
3.1. Nitrogen Solubility and Nitride Formation
The solubility of nitrogen in steel is highest in the melt, followed by the solubility in austenite, and is the lowest in ferrite [9]. Additionally, the solubility of nitrogen also depends on the temperature of the system as, with increasing temperature, the solubility of nitrogen increases. The solubility of nitrogen in liquid iron can be written as [7,9]:
where KN represents the equilibrium constant for reaction in Equation (1), aN is the activity of nitrogen, is the partial pressure of nitrogen gas, fN is the activity coefficient of nitrogen in 1 mass % standard state, [wt.% N] is the weight percent of dissolved nitrogen. According to Sieverts’ law, the concentration of diatomic gases in solid and liquid solutions is proportional to the square root of the partial pressure [9,11,12], which means that the pressure of nitrogen gas directly affects the solubility of nitrogen atoms.
In addition to the pressure, the nitrogen solubility in the system is also affected by the activity coefficient. A change in the chemical composition of the solution changes the Gibbs free energy of the system and the activity coefficient of the elements. The change of Gibbs free energy of the alloy due to nitrogen dissolution, , is provided by Equation (4) [10]:
where is the change of the enthalpy in the alloy due to nitrogen dissolution, is the change of the entropy in the alloy due to nitrogen dissolution, and T is the temperature in Kelvin. According to Wagner’s formalism, the activity coefficient of an element, in our case nitrogen, can be written as [10,11,12,13,14]:
where is the change in Gibbs free energy in the dissolution of nitrogen in the iron melt, R is the general gas constant, is the activity coefficient of nitrogen in dilute iron solution, and and are the first- and second-order interaction parameters of element i on nitrogen, respectively; represents the second-order cross-interaction parameter of element i with j on nitrogen. Table 2 and Table 3 summarize the values of and for selected elements at 1873 K [13]. In Table 4, Table 5 and Table 6 are listed the values of , and for the Fe-Cr-Ni-Nb system [10].
In the case of exceeded nitrogen solubility in the molten steel, gas bubbles or nitrides are formed [7]. Equation (6) describes the reaction of nitride formation between dissolved niobium and nitrogen [7,13,15,16]:
ΔG°NbN = −221,557.9 + 102.1 ∗ T (J/mol)
Equation (9) gives the expression for the change of Gibbs free energy:
At equilibrium, ΔG is zero. By the combining of Equations (8) and (9), the term for the equilibrium solubility product of nitride-forming elements can be written as:
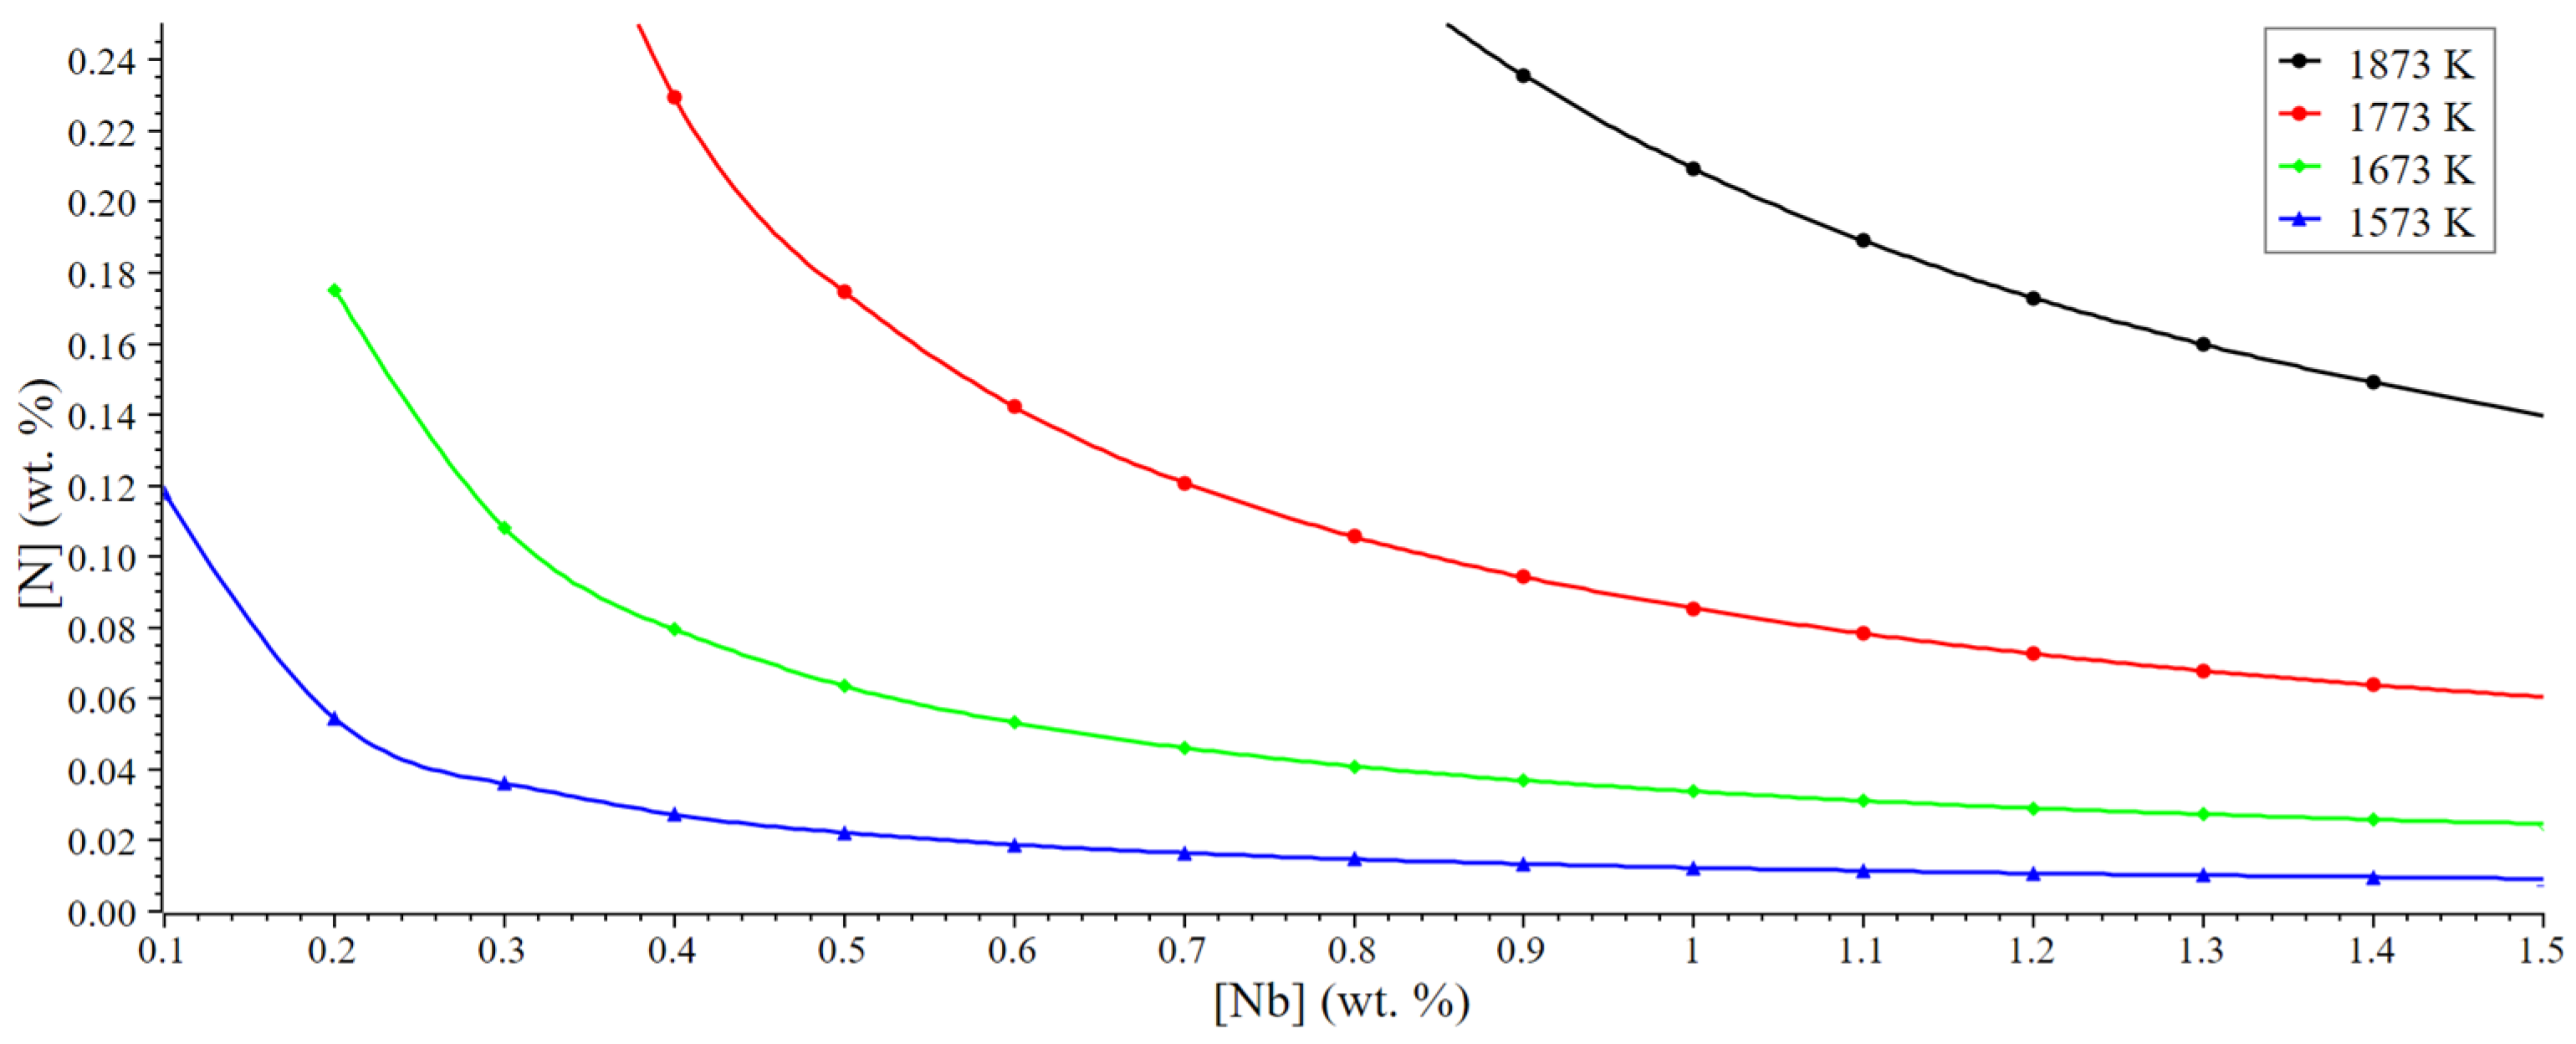
The temperature dependence of nitrogen and niobium solubility in the steel melt was calculated according to Equation (11); the results are shown in Figure 2. As the temperature decreases, the solubility of niobium and nitrogen decreases, and the Gibbs free energy of NbN formation decreases, leading to nitride precipitation. Nitride formation occurs when the concentration of the elements is above the equilibrium solubility product curve [10].
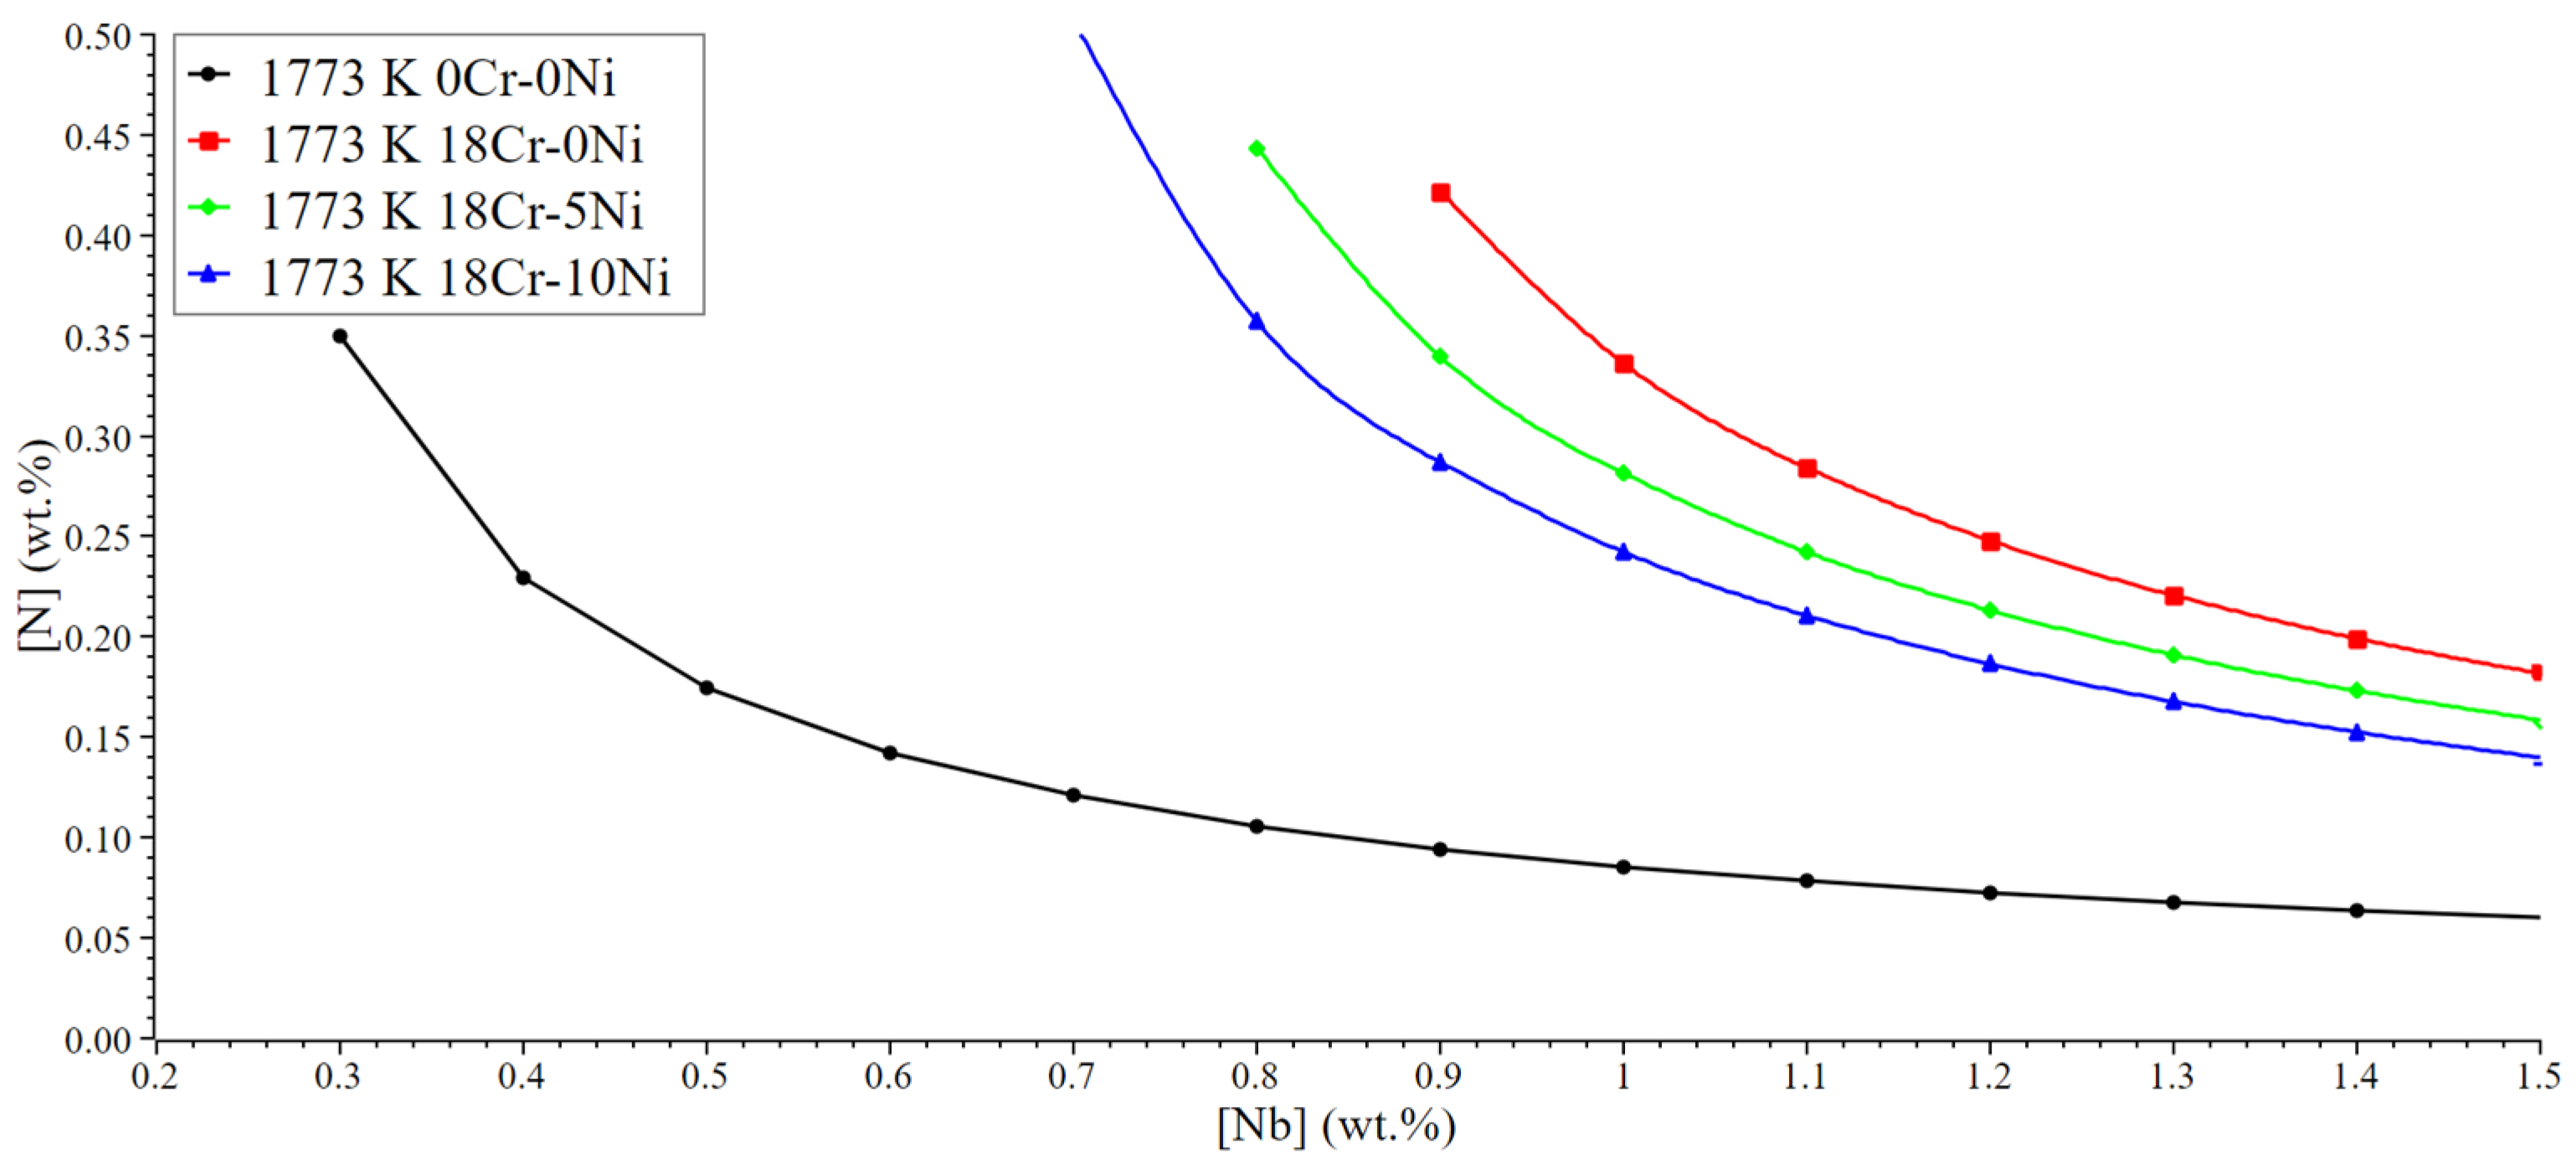
According to Equation (12), the effect of chromium and nickel addition on the solubility product of niobium and nitrogen in the steel alloy at 1773 K was calculated, 1773 K being in the range of the liquidus and solidus temperatures of the investigated stainless steels. The results are shown in Figure 3. Chromium addition increases the solubility of nitrogen in steel melt; consequently, the solubility product of NbN increases. On the other hand, the addition of nickel decreases nitrogen solubility, causing the decrease in the NbN solubility product.
3.2. Microsegregations of Niobium and Nitrogen
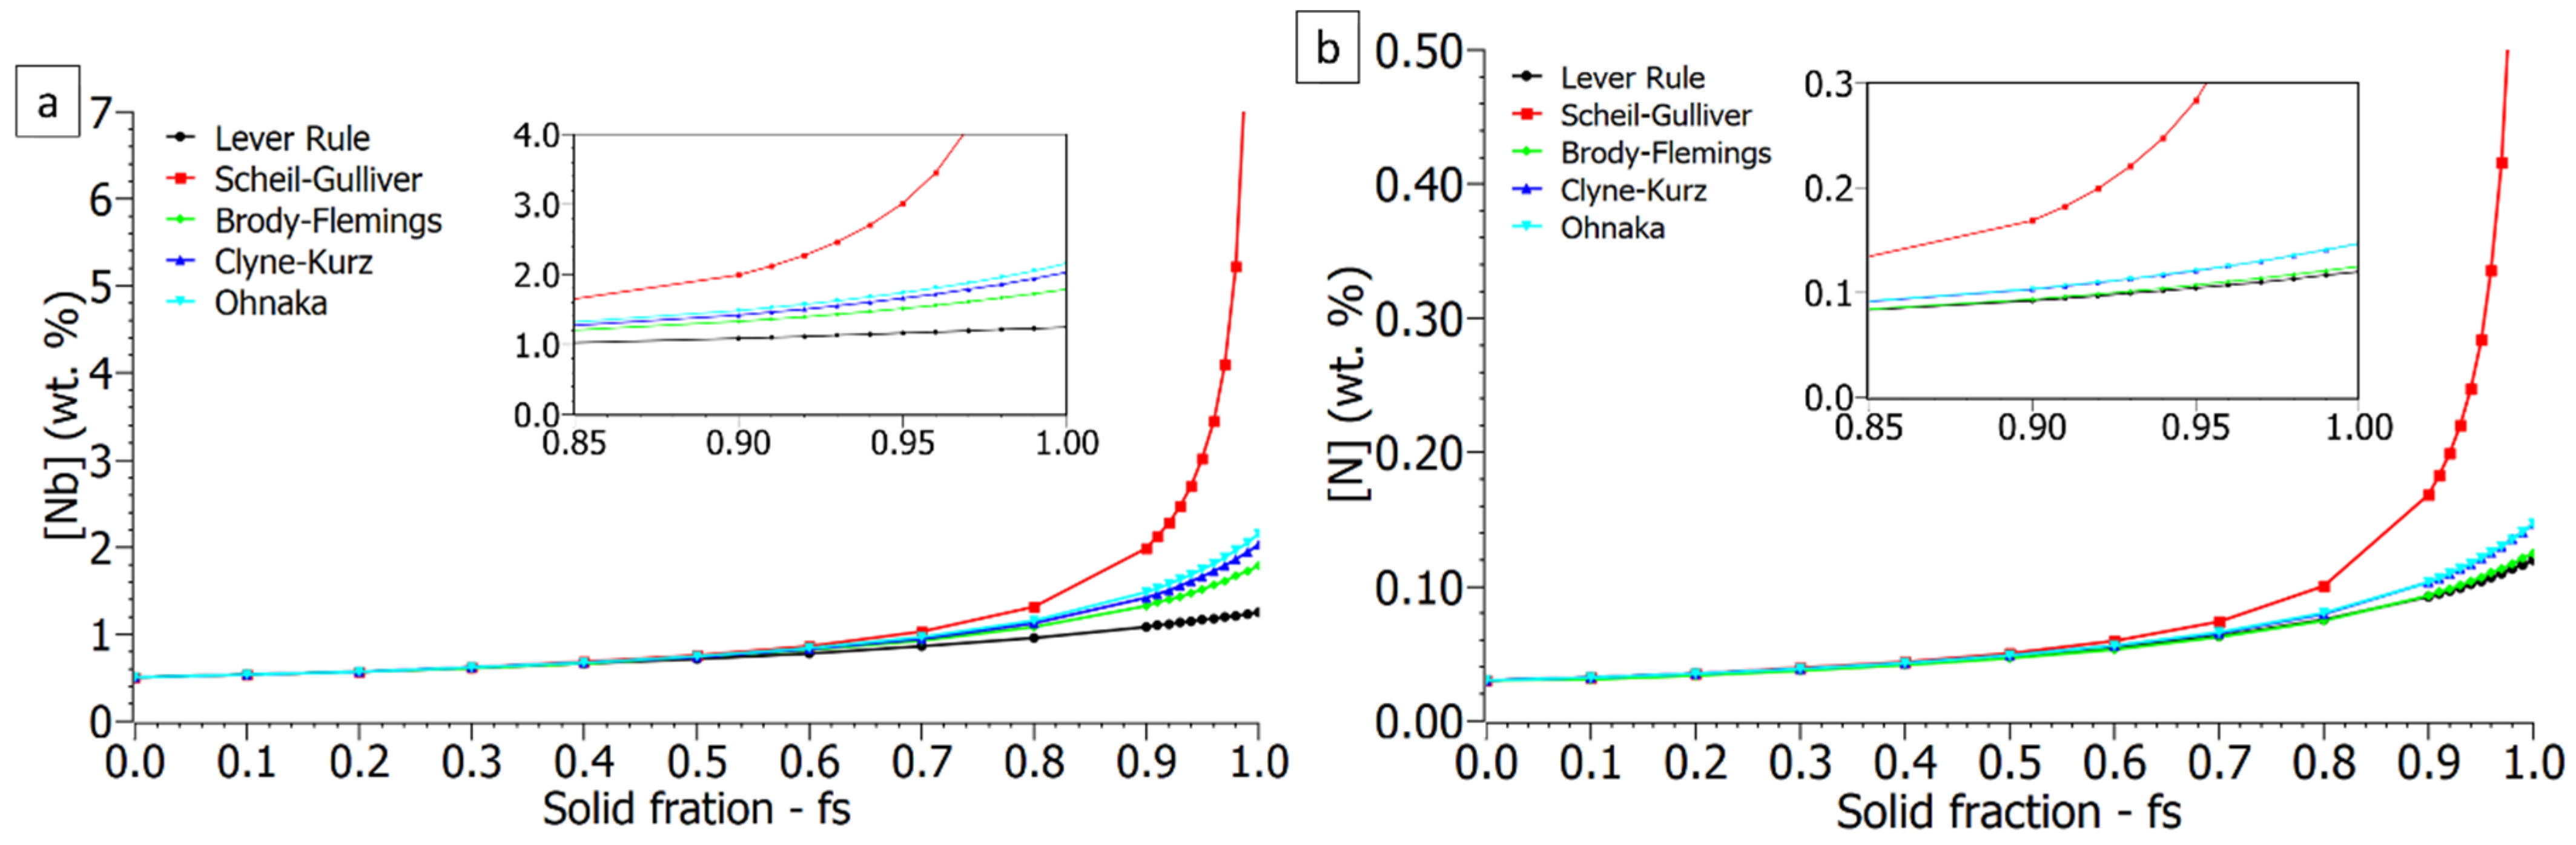
Assuming that, in reality, solidification is non-equilibrium, there are differences in the chemical composition and, consequently, non-equilibrium microstructural phases form. Models, described in Table 7, were used to calculate niobium and nitrogen segregations during solidification. CL−i represents the concentration of the alloying element i in the liquid at solid–liquid interface, C0−i is the initial concentration of the alloying element i, kiδ/L is the equilibrium distribution coefficient of the alloying element between the solid and liquid steel phase, fs is the fraction solid, and αi is the back-diffusion parameter and can be written as [15,17,18]:
where Diδ represents the diffusion coefficient of the alloying element i in ferrite (δ). TL and TS are liquidus and solidus temperatures, respectively, and were determined using Thermo-Calc program. Rc is the local cooling rate, λS is the secondary dendrite arm spacing defined by Won and Thomas [19], and βi is modified back-diffusion parameter by Clyne and Kurz [20]. They proposed the following Equation (14):
Niobium and nitrogen, like most of alloying elements in iron solution, are characterized by positive segregations. The first solidified dendritic grains have a low concentration of alloying elements, and the melt is enriched with alloying elements. At the end of the solidification process, the melt in the interdendritic spaces is saturated with alloying elements, which can lead to the formation of non-equilibrium phases. The parameters in Table 8 were used for the calculation of niobium and nitrogen microsegregations [15,17,18].
Figure 4a–c show the results for the variation of [Nb] × [N] segregations in the interdendritic liquid with the progress of solidification (fS) for an iron solution of 18 wt.% Cr, 0.5 wt.% Nb and 0.03 wt.% N. The lever-rule model assumes complete diffusion of all the alloying elements in both the liquid and solid phases. The concentration of the solubility product of niobium and nitrogen calculated according to this model increases the slowest. The Scheil–Gulliver model, on the other hand, assumes complete diffusion of elements into the liquid phase and no diffusion in the solid phase; therefore, the concentration increases the fastest. The Brody–Flemings, Clyne–Kurz, and Ohnaka models cover situations between the described models and assume complete diffusion of elements in the liquid phase and partial diffusion in the solid phase. The concentration of niobium and nitrogen, in these cases, increase at moderate rates.
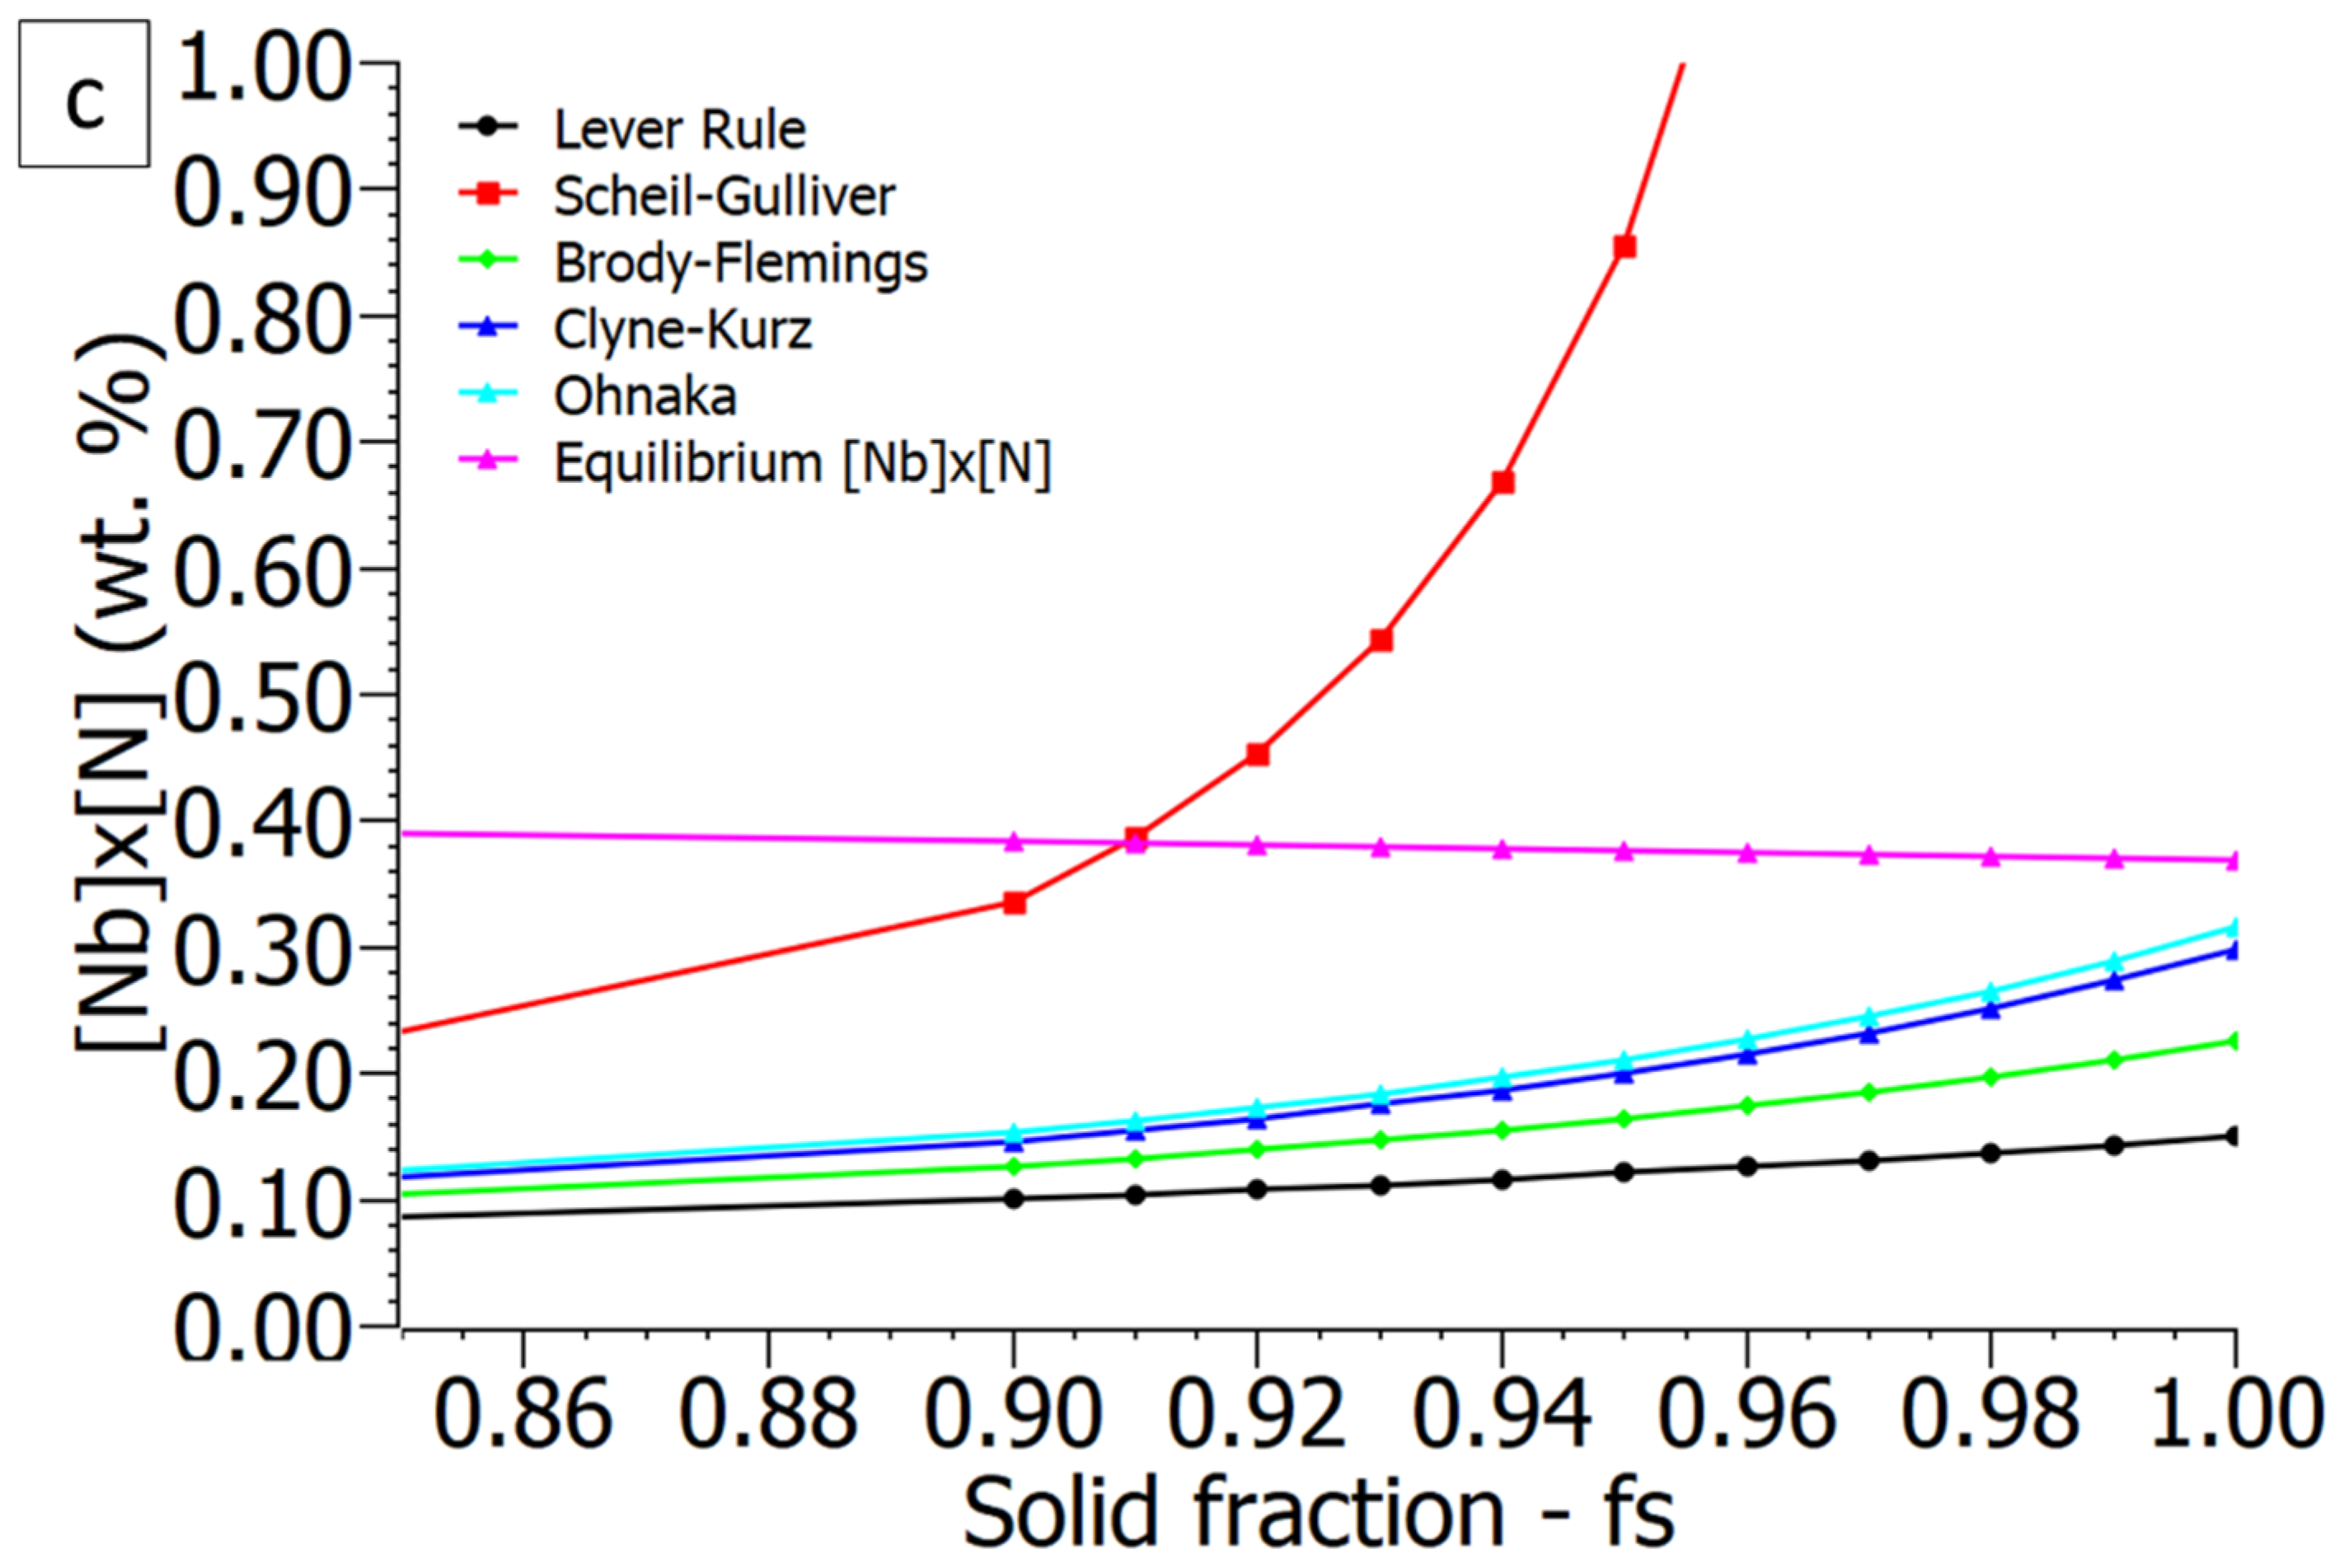
The equilibrium curve of the solubility product of niobium and nitrogen is plotted in Figure 4c. The equilibrium curve was calculated based on the interpolated temperatures and the corresponding solubilities of the mentioned elements (niobium and nitrogen). Equation (12) was used to calculate the equilibrium curve (violet) in Figure 4c. This equation is indirectly linked to the fraction solid phase (fs); as the temperature falls the solubility product lowers. Meanwhile, the temperature is calculated by fs. It can be seen that only in case of the Scheil–Gulliver model does the equilibrium curve intersect, which gives the possibility of NbN formation. This means that only the Scheil–Gulliver model predicts NbN formation, while others do not. Knowing this, we must bear in mind that the Scheil–Gulliver model is the simplest among used models. However, it is also used by commercial software such as Thermo-Calc (described later on). The equilibrium curve is intersected when solid fraction reaches 0.91. Above the equilibrium solubility curve, the concentration of alloying elements in the solution is locally supersaturated. As the system temperature decreases, the solubility product decreases, which further increases the saturation of alloying elements in the steel melt and reduces the stability of the system. For the growth of a new phase, in this case NbN, the nucleation of a new phase must take place. When the radius of nucleus particles is above the critical value, the volume energy of the system is greater than the surface energy; particles continue to grow by diffusing and attaching atoms.
3.3. Thermo-Calc Calculations
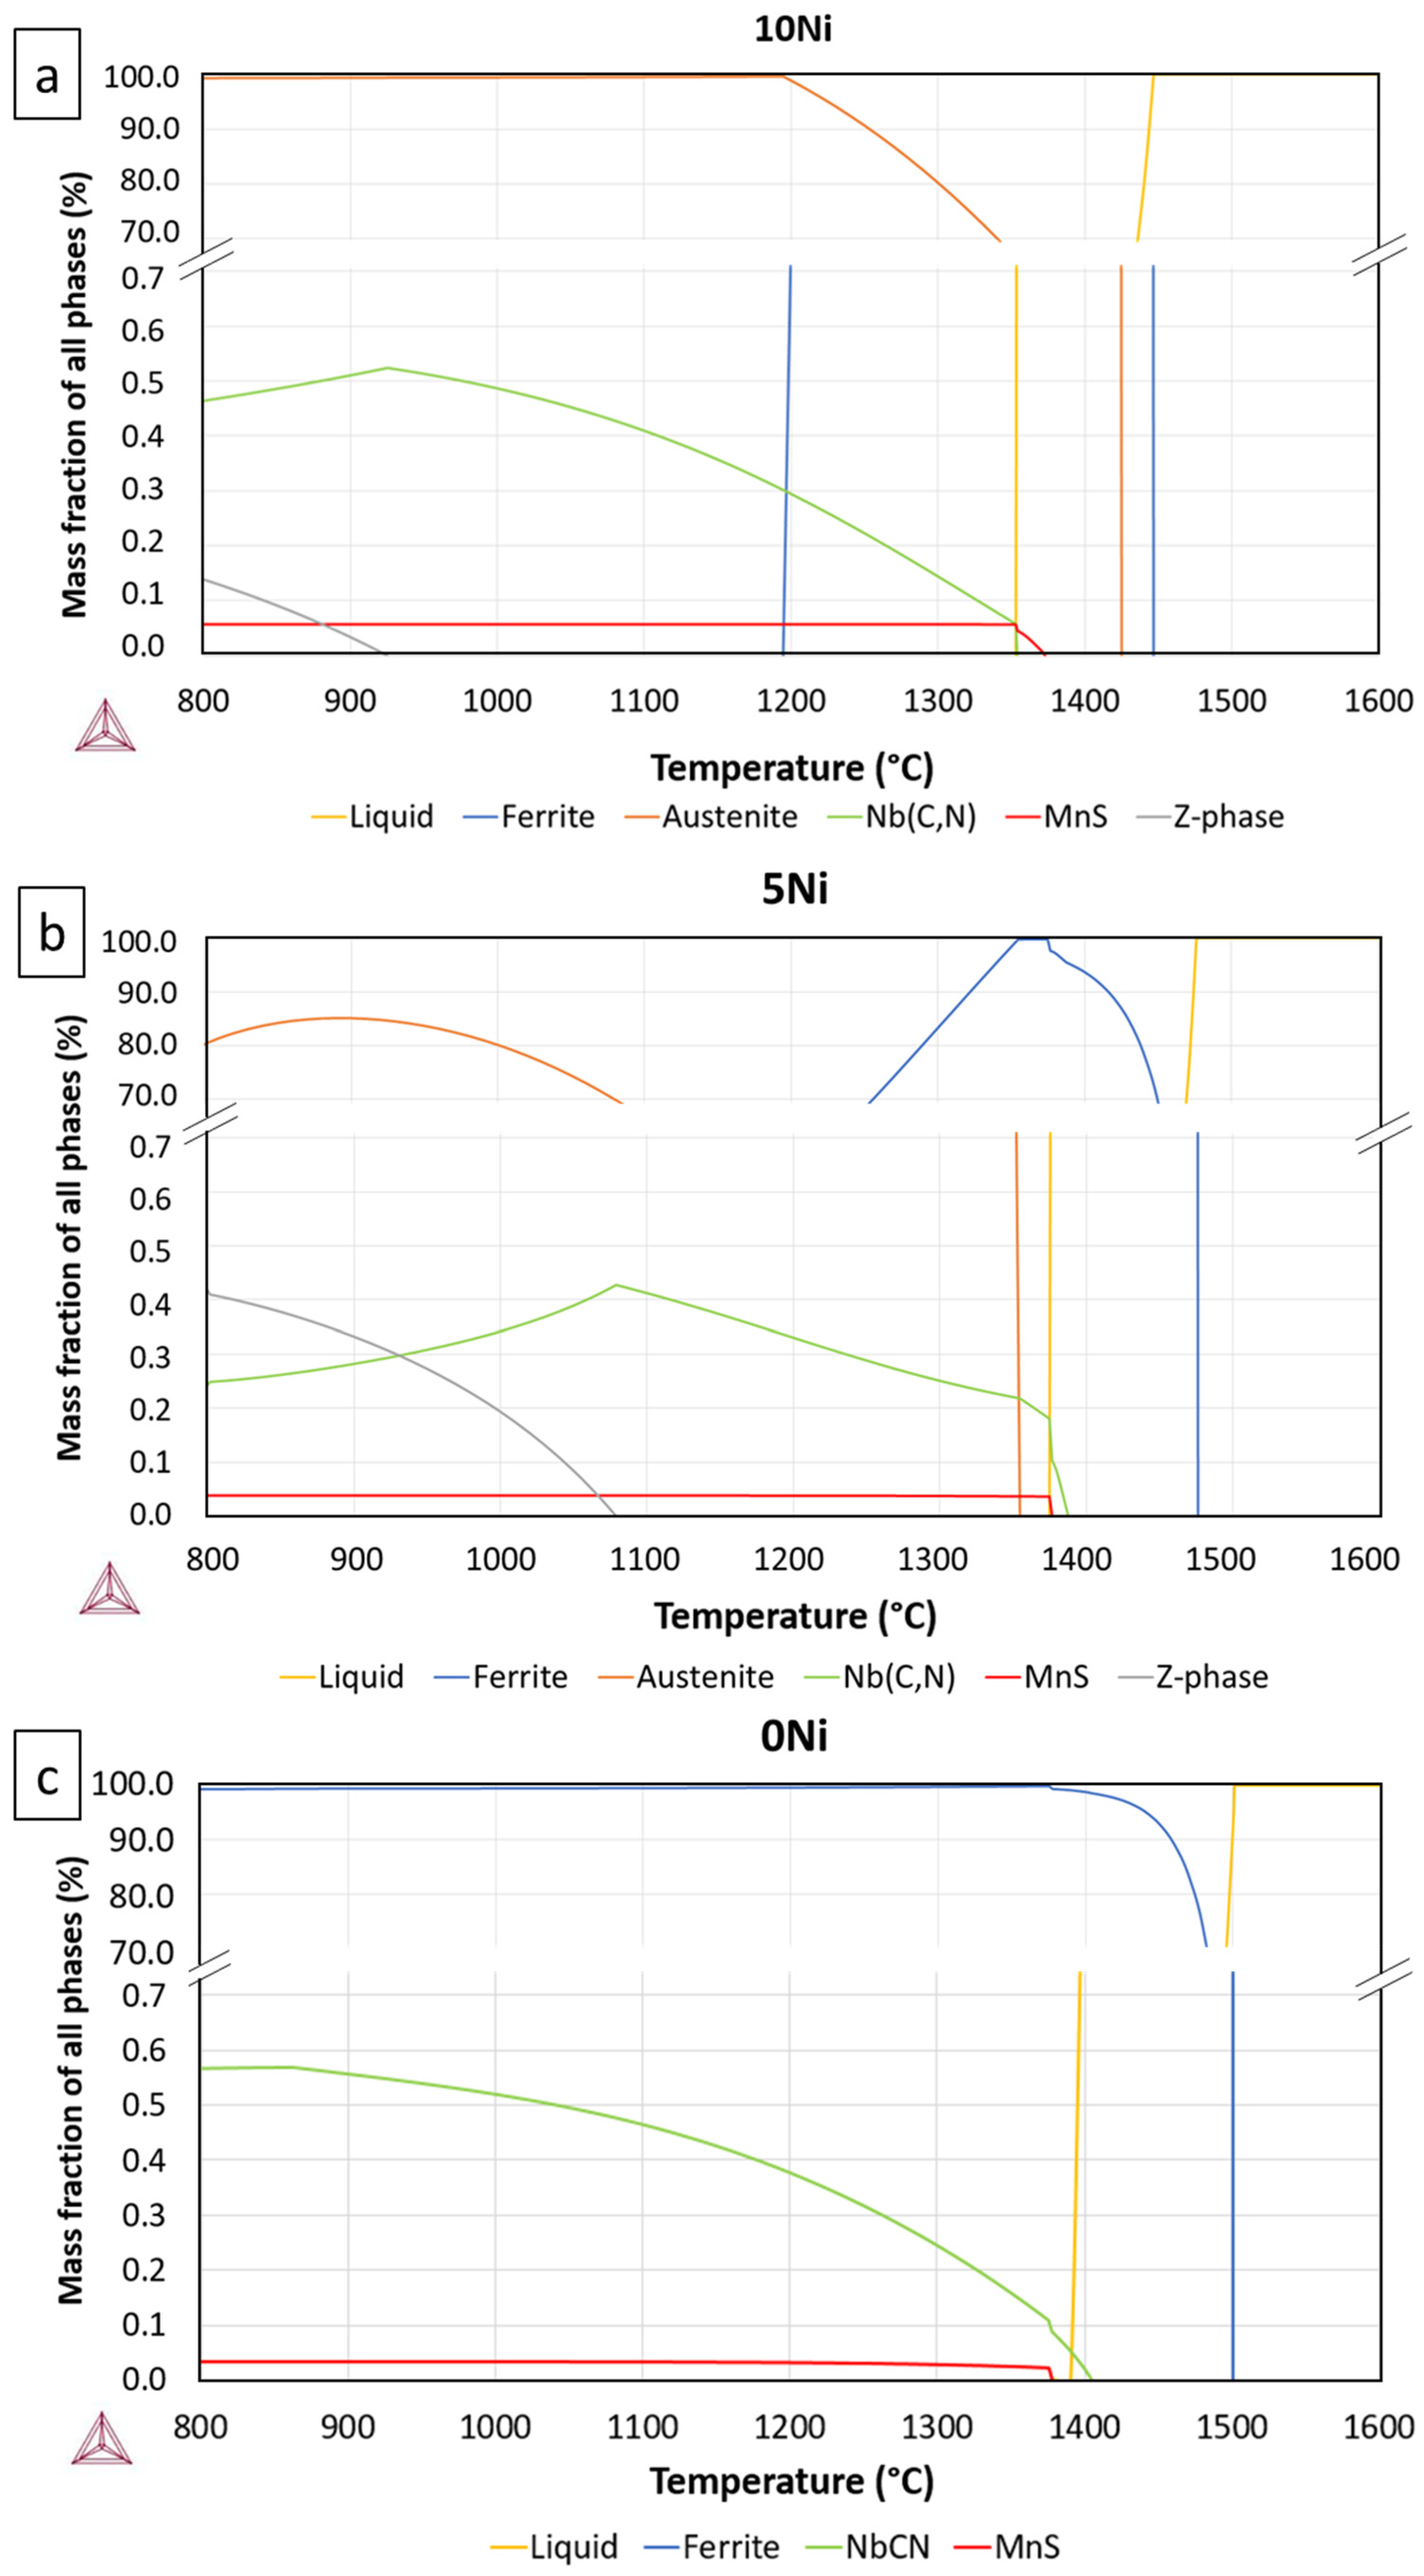
Based on the chemical compositions shown in Table 1, calculations of equilibrium phase compositions were performed using the Thermo-Calc program. Equilibrium solidification of 10Ni steel starts at 1447 °C, with the formation of primary delta-ferrite grains. Austenite begins to form around the temperature of 1420 °C after a peritectic reaction. The results of equilibrium solidification calculations, also, indicate that MnS inclusions and carbonitrides are formed at the end of solidification, and their formation continues even in the solid state. As stated by You et al. [21], Shu et al. [22], and Diederich et al. [23] MnS non-metallic inclusions also form at the end of solidification as a result of the positive segregations of Mn and S in interdendritic areas. The sulphides are formed at the end of the solidification process, while the size and distribution are influenced by the cooling rate and the sulphur content in the solution. The solidification of the steel is completed at 1354 °C. Delta ferrite is completely transformed into the austenitic phase at 1200 °C. Despite the low carbon concentration, the proportion is large enough to form niobium carbonitrides (Nb(C,N)). Niobium carbonitrides start transforming into Z–phase (CrNbN) at 925 °C. As the nickel content of the solution decreases, the liquidus and solidus temperatures increase. Therefore, 5Ni steel begins the solidification at 1476 °C, and delta-ferrite grains are formed throughout the solidification range, completed at 1375 °C. Furthermore, in this steel, the formation of MnS and carbonitrides occurs at the end of solidification, with further precipitation in the solid. The formation of Z–phase starts at 1079 °C. The solidifying of 0Ni steel takes place in the temperature range 1500–1390 °C; in that case, only delta-ferrite grains are formed. Due to the low concentration of gamma elements, the transformation into austenite does not take place. The formation of carbonitrides and MnS inclusions takes place in a similar way at the end of solidification. Figure 5a–c show equilibrium phase compositions for stainless steels 10Ni, 5Ni, and 0Ni, respectively, extreme mass fraction values are presented in each diagram, above the crack 70% or more and below the crack 0.7% and less.
Figure 6 shows the solidification process of steels, according to the Scheil method calculated using the Thermo-Calc program. Due to the positive segregations, the melt is enriched with alloying elements, so carbonitrides (FCC_A1#2) and non-metallic MnS inclusions (MNS) are formed at the end of the solidification process. The formation of carbonitrides begins at a solid phase fraction of 0.91, similar to the calculated segregations by the Scheil–Gulliver model.
3.4. Optical Microscopy and Ferrite Fraction
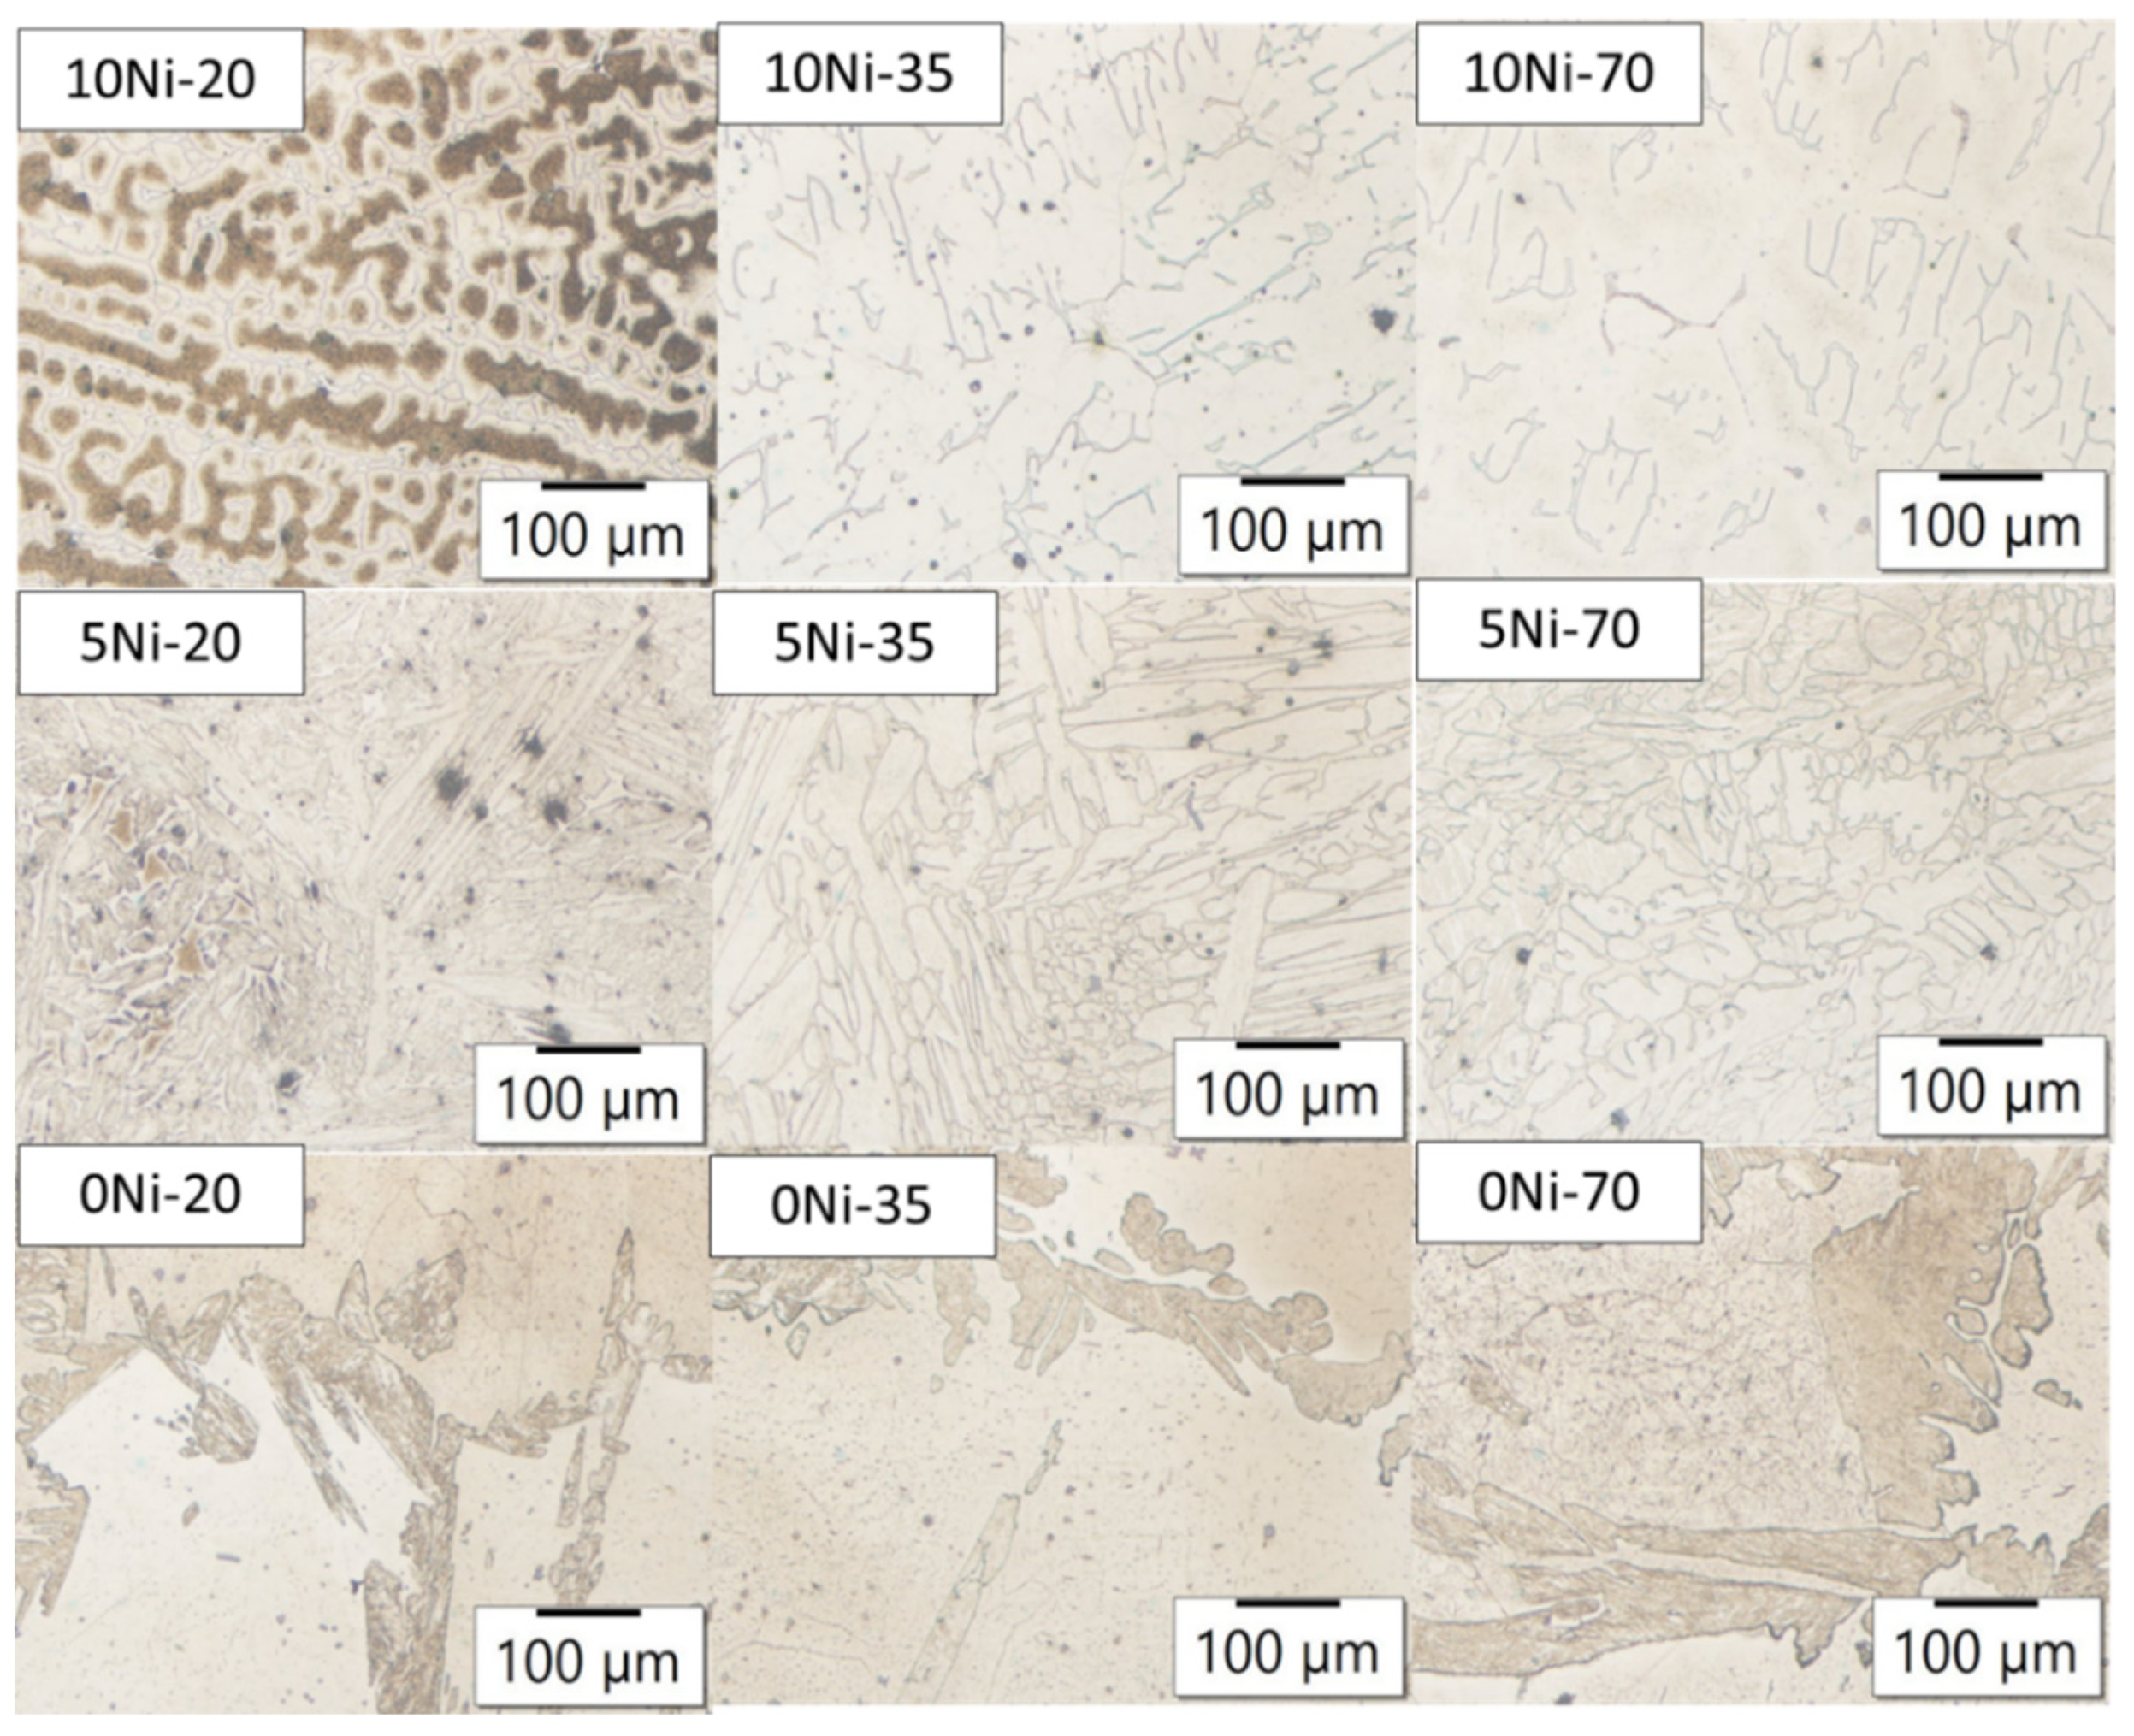
Figure 7 shows microstructural images of etched as-cast samples taken with a light microscope at 100× magnification. Marks 20, 35, and 70 represent the diameters of the sections from which the samples were taken. As the diameter of the section increases, the cooling rate decreases, which affects the increase in crystal grain size. The cooling rates determined from the cooling curves are summarized in Table 9. Austenitic grains are predominantly present in 10Ni steel samples, and traces of primary delta ferrite are visible between the grains. By lowering the nickel content in the solution, the austenite range is limited, which affects the increase in ferrite content in the microstructure. The 5Ni steel samples have an austenite–ferrite, two-phase microstructure which is characteristic of duplex stainless steels. The 0Ni steel samples have a ferritic microstructure.
The fractions of ferrite in the samples of stainless steels were also determined. The results are summarized in Table 10. As the proportion of nickel in the solution increases, the proportion of ferrite is expected to decrease. The 10Ni steel samples contain between 5.9 and 7.1% delta ferrite, 5Ni steel samples contain between 63.7 and 65.5%, and 0Ni steel samples contain between 89.7 and 90.5% ferrite. The cooling rate had no special effect on the ferrite content in microstructure.
3.5. Scanning Electron Microscopy
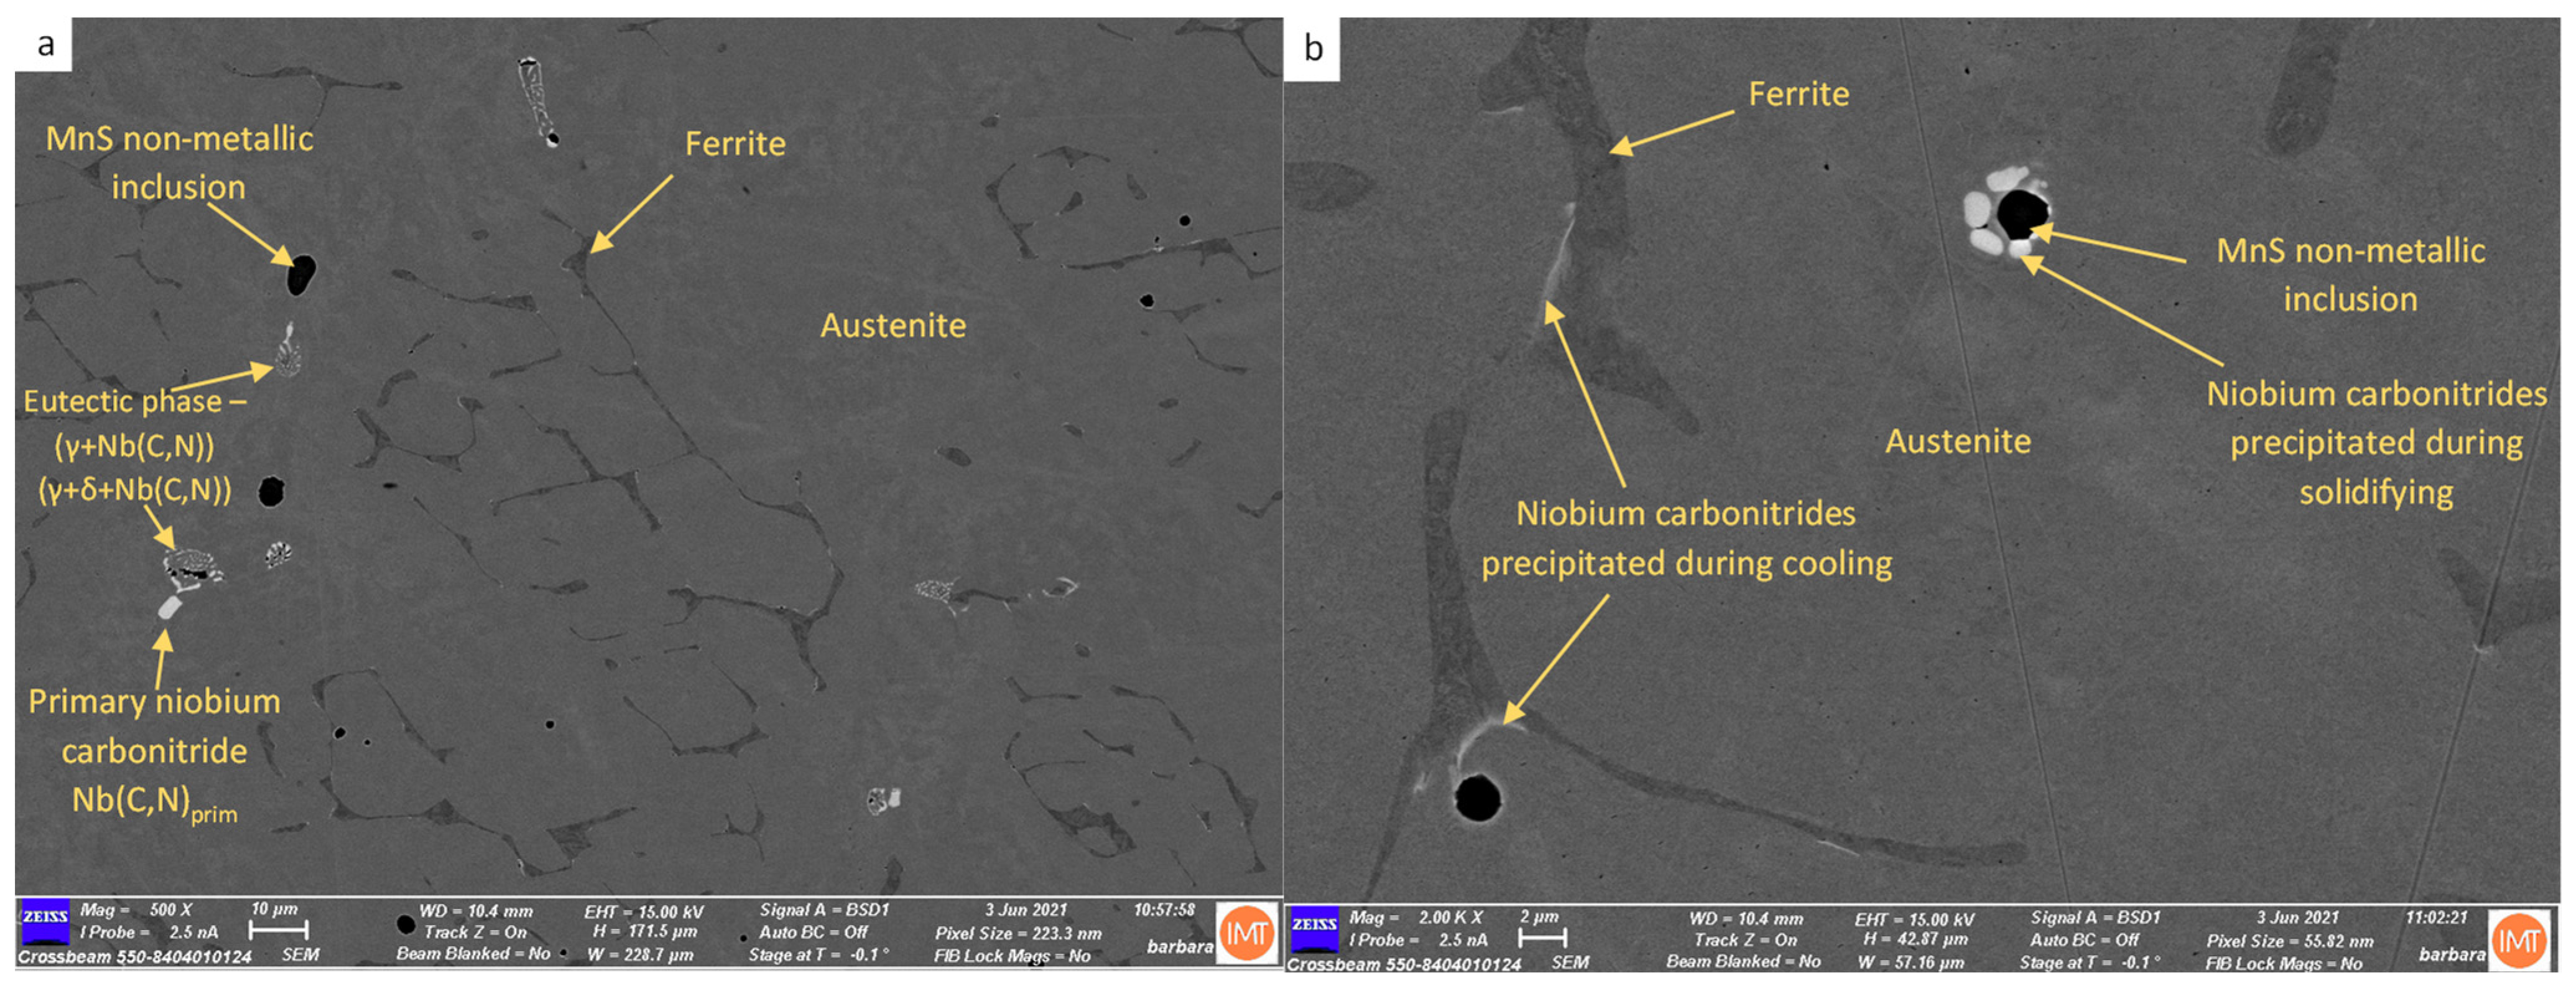
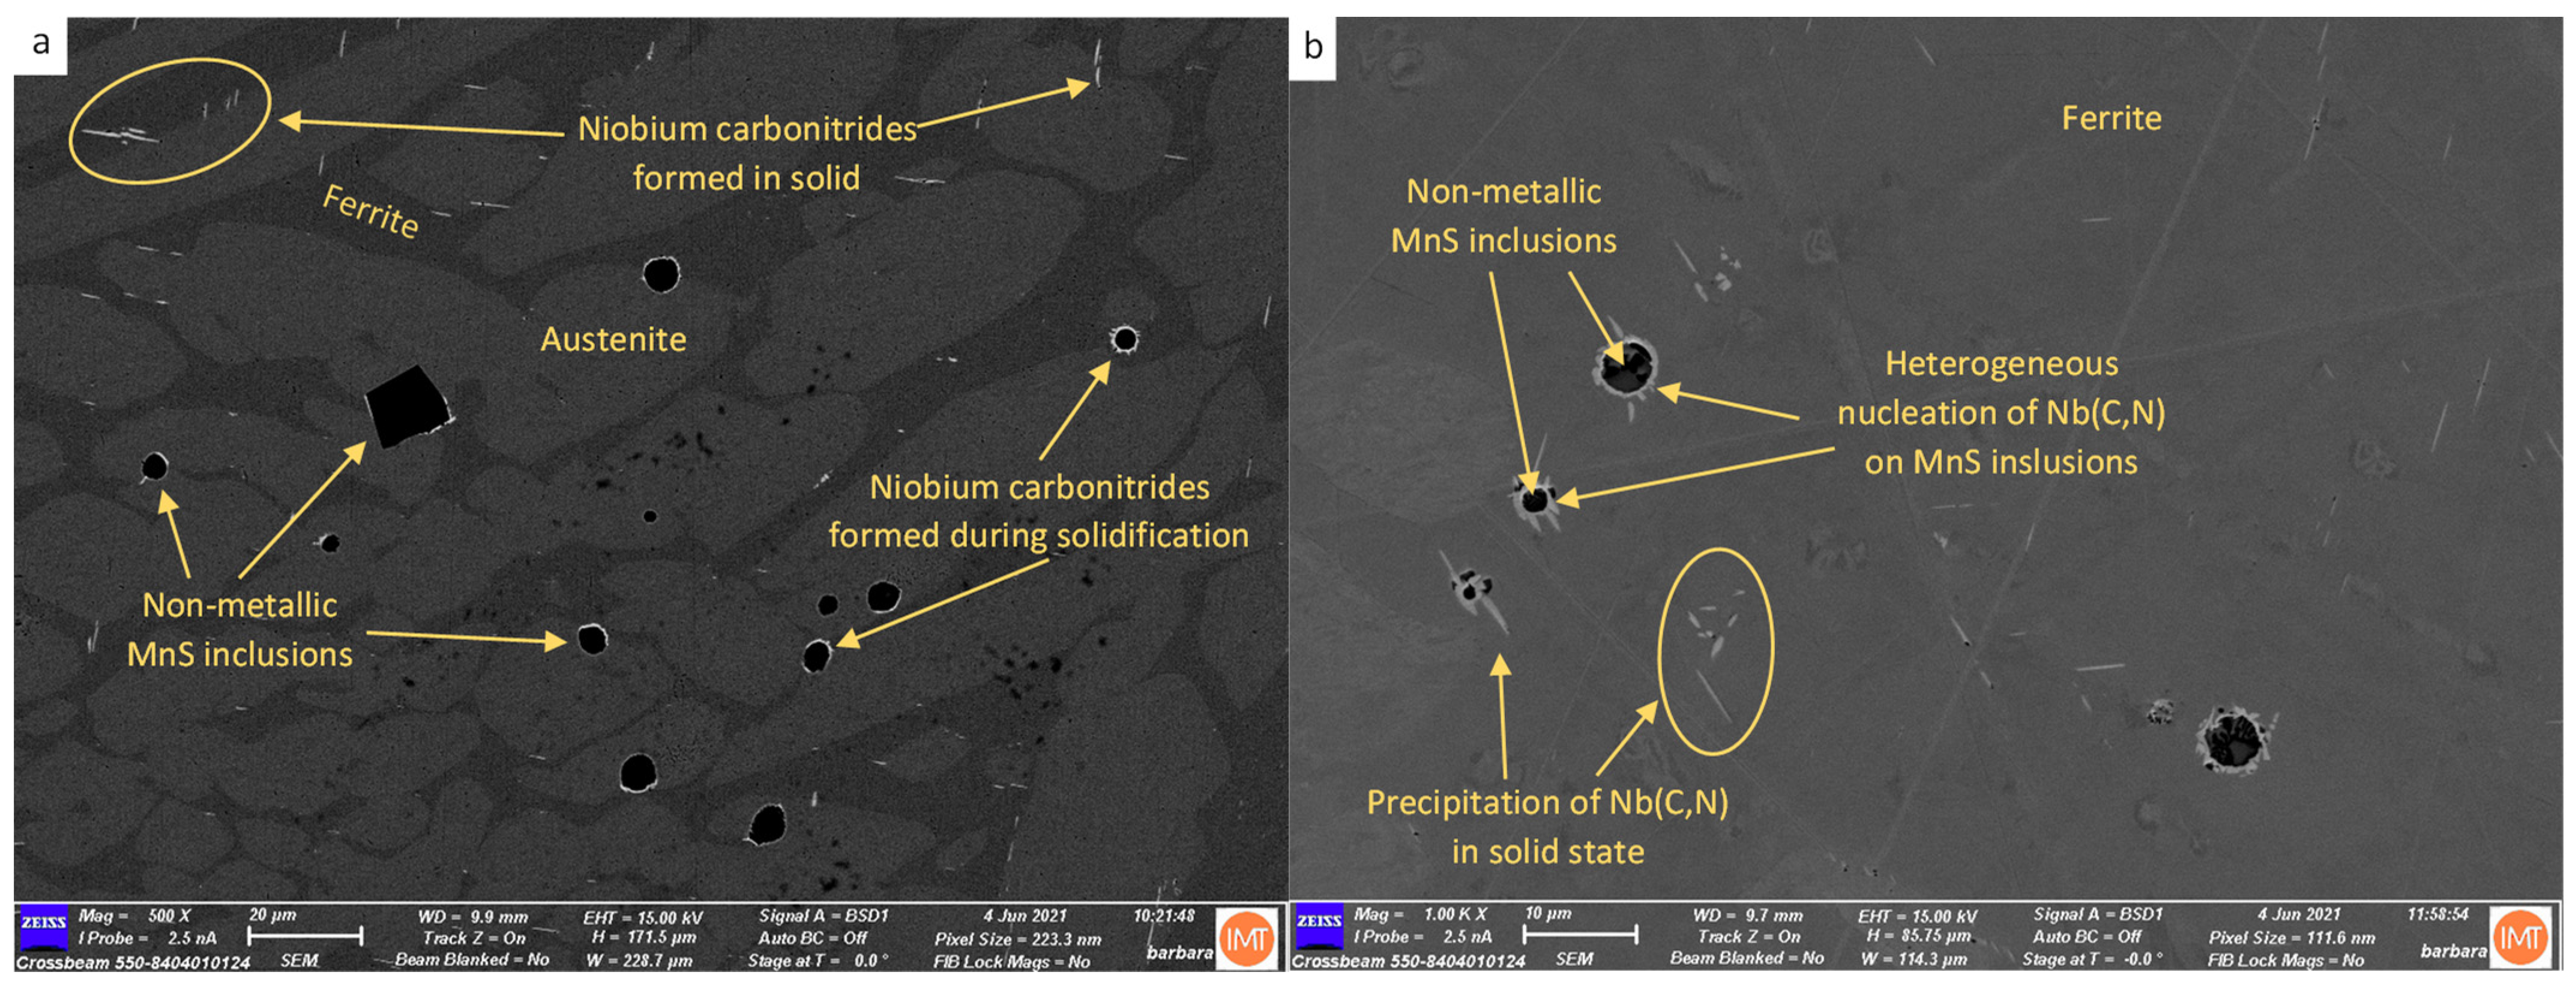
Figure 8a shows the microstructure of 10Ni-20 steel, imaged with a scanning electron microscope. The darker areas represent delta ferrite, while the matrix are austenitic crystal grains. Along the boundaries of the austenite grains, dark MnS non-metallic inclusions and light-coloured niobium carbonitrides were observed. Larger cuboid particles represent the primary niobium carbonitrides formed by homogeneous nucleation in the interdendritic liquid at the end of the solidification process. At the phase boundary between austenite and delta ferrite, the precipitation in the solid phase of niobium carbonitrides occurred during cooling, as shown in Figure 8b.
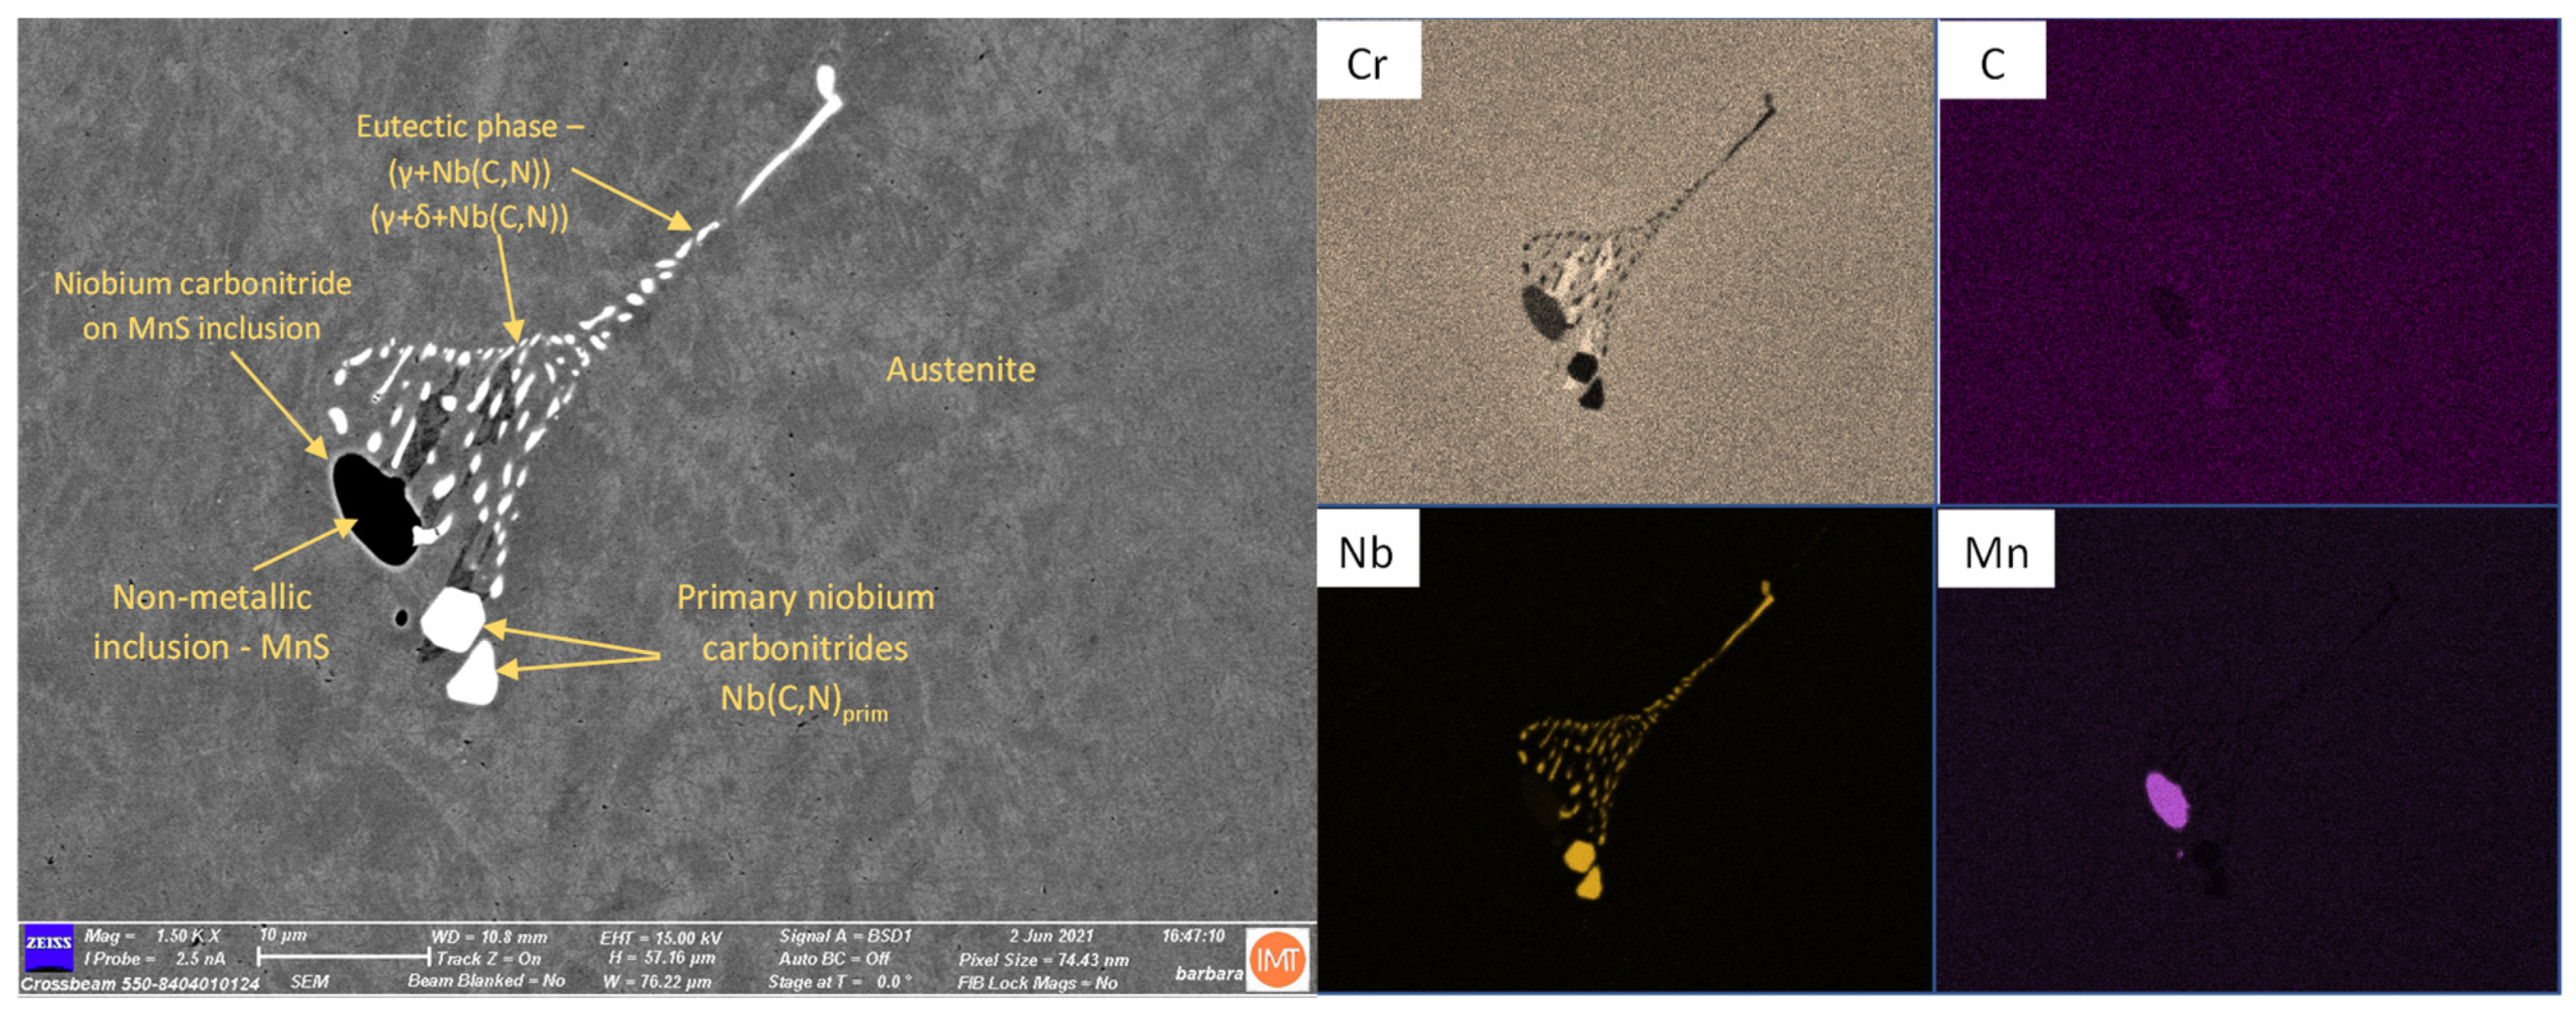
Figure 9 shows an electron image and EDS elemental mapping of the agglomerate of MnS non-metallic inclusion, niobium carbonitrides, and eutectic phase in the austenite matrix in 10Ni-70 sample at 1500× magnification. The white-stained belt formed on larger MnS non-metallic inclusion represents the primary Nb(C,N) phase, precipitated by heterogeneous nucleation between solidifying. In the immediate vicinity of the MnS, the cuboid primary Nb(C,N) and ternary eutectic phase (γ + δ + Nb(C,N)) could be identified.
Figure 10 shows the EDS elemental mapping of complex MnS non-metallic inclusion. Small niobium nitrides precipitated near the δ/γ grain boundaries. As mentioned before, the white-stained belt of niobium nitride heterogeneously nucleated on MnS inclusion.
As presented in Figure 11a,b, the formation of primary niobium carbonitrides in 5Ni and 0Ni steels is associated with MnS inclusions. Carbonitrides formed in the liquid, nucleate on MnS, and are visible as a thin layer on MnS non-metallic inclusions. The number of homogeneously nucleated primary carbonitrides and eutectic phases is negligibly small. Due to the lower content of nickel in the solution, the solubility of nitrogen is higher, and the precipitation of carbonitrides is more pronounced in the solid state. The precipitation of thin needle-shaped carbonitrides takes place along the boundaries of the ferrite and austenite grains. There are less δ/γ grain boundaries in the 0Ni steel microstructure (Figure 11b). Therefore, the precipitation of carbonitrides in the solid state is more pronounced on carbonitrides at MnS non-metallic inclusions.
3.6. Automatic Image Analysis of Carbonitrides
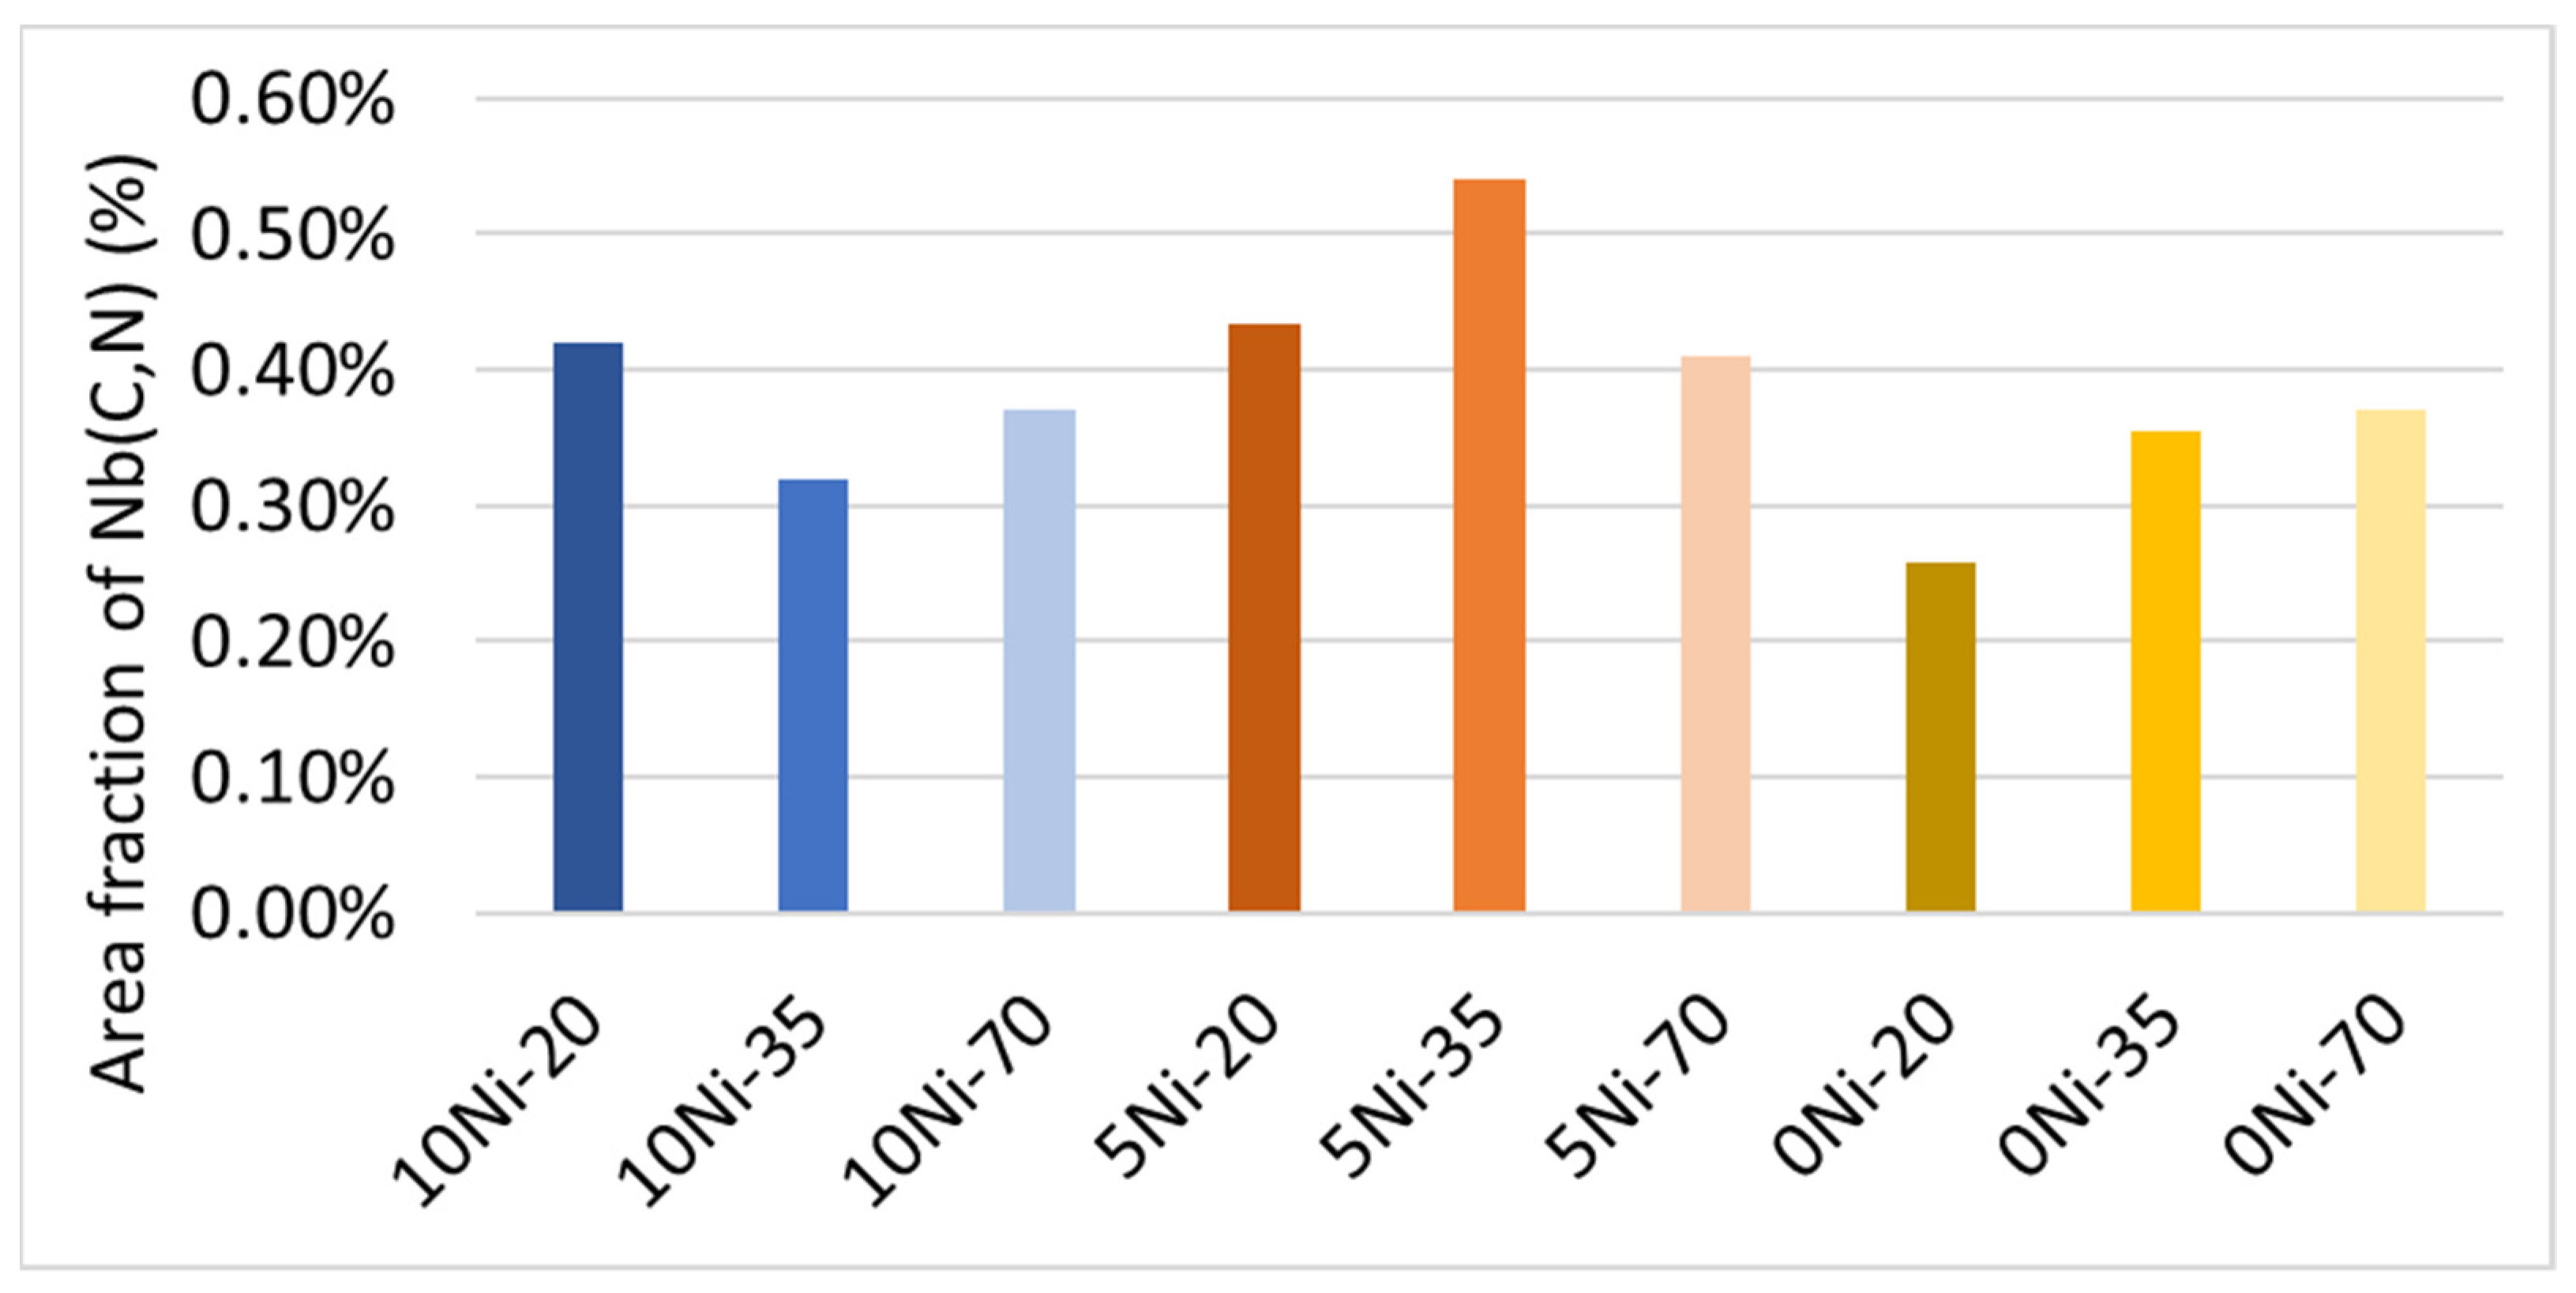
The size, number, and size distribution of carbonitrides were evaluated by the SEM-based automatic image analysis. Based on the measurements, the influence of cooling rate and nickel content on the size distribution of the carbonitrides were estimated. The diagram in Figure 12 shows the area fraction of the carbonitrides for the analysed samples. The lowest values are reached by the 0Ni steel samples. The samples of the other two steels are comparable with the slightly higher fraction in the 5Ni samples. The analysis does not indicate the direct influence of cooling rate on the amount of carbonitrides as described by Capurro et al. [24] and Perez et al. [25]. The results of the analysis do not indicate an increase in particle formation with increasing nickel content as a whole, but only in the liquid, as was initially predicted. The nickel content affects the morphology of the carbonitrides. At a concentration of 10 wt.% Ni, the most primary carbonitrides and eutectic phases form. In 5Ni and 0Ni steels, however, the precipitation of carbonitrides in the solid state increases.
4. Conclusions
In the present work, niobium nitrides and carbonitrides were characterized in the as-cast microstructure of stainless steels with 18 wt.% Cr. The development of nitride particles was analysed with respect to nickel content in steel melt and different cooling rates. The conclusions can be summarized as follows:
- As the temperature decreases, the solubility product of niobium nitrides in steel melt decreases, and the content of niobium and nitrogen increases due to segregation during solidification. Calculations of solubility products have shown that increasing nickel content in the melt decreases the solubility of nitrogen, which promotes precipitation of niobium nitrides from the melt.
- With the Scheil–Gulliver segregation model in steel melt with 18 wt.% Cr, 0.5 wt.% Nb, and 0.03 wt.% N, it was determined that the concentration of niobium and nitrogen content exceeds the equilibrium solubility product above 0.91 fraction solid. The equilibrium solubility product is exceeded locally in the interdendritic liquid at a late solidification process. Formation of nitrides above the fraction solid 0.91 was also confirmed by Thermo-Calc calculations.
- In as-cast microstructure samples, the presence of primary carbonitrides due to segregations and reduced solubility during the cooling and solidification of steel melt was confirmed. In addition to carbonitride particles, MnS non-metallic inclusions formed during solidification in segregated areas were also analysed in the microstructure. MnS non-metallic inclusions serve as favourable sites for the heterogeneous nucleation of niobium carbonitrides in liquid. The segregated areas between the grains represent the sites of the last solidification region, and eutectic phases (γ + δ + Nb(C,N)) were also observed at these sites. Due to cooling and phase transformations, the solubility of alloying elements decreases, which leads to the precipitation of niobium carbonitrides in the solid. The precipitated particles nucleate and grow at δ/γ grain boundaries and at already formed carbonitrides on MnS.
- The decrease in nickel content had no effect on the area fraction of carbonitrides. With a higher proportion of nickel (10Ni), the formation of carbonitrides in liquid was more pronounced. From the melt, niobium carbonitrides were formed as homogeneously nucleated primary carbonitrides, eutectic phases, and heterogeneously nucleated carbonitrides on MnS non-metallic inclusions. In samples with a lower nickel content (5Ni and 0Ni), the precipitation of carbonitrides in solid state is more favourable. The cooling rate affected mainly the crystal grain size, and the effect of the cooling rate on the carbonitrides content was negligible.
Author Contributions
Conceptualization and writing, A.B. and J.B.; original draft preparation, A.B. and J.B.; methodology and formal analysis, A.B., B.Š.B. and J.B.; validation and formal analysis, A.B., B.Š.B. and J.B.; supervision, J.M. All authors have read and agreed to the published version of the manuscript.
Funding
This research is co-financed by the Republic of Slovenia and the European Union from the European Social Fund/European Regional Development Fund/Cohesion Fund, Ga No. C3330-18-952013. Funding was provided by the Slovenian Research Agency ARRS program P2-0050 (C). This research was made as a part of the ČMRLJ research project co-financed by the Republic of Slovenia and the European Union under the European Regional Development Fund.
Data Availability Statement
Not applicable.
Conflicts of Interest
The authors declare no conflict of interest.
References
- Properties of Stainless Steel. Available online: https://www.thyssenkrupp-materials.co.uk/properties-of-stainless-steel (accessed on 18 February 2022).
- DeArdo, A.J. Niobium in modern steels. Int. Mater. Rev. 2003, 48, 371–402. [Google Scholar] [CrossRef]
- Hiramatsu, N. Niobium in Ferritic and Martensitic Stainless Steels. In Proceedings of the International Symposium Niobium 2001, Orlando, FL, USA, 2–5 December 2001. [Google Scholar]
- Dulieu, D. The Role of Niobium in Austenitic and Duplex Stainless Steels. In Proceedings of the International Symposium Niobium 2001, Orlando, FL, USA, 2–5 December 2001. [Google Scholar]
- Poročnik, M. Effect of Niobium Addition on Mechanical Properties and Microstructure of X20CrMoV11-1. Master’s Thesis, University of Ljubljana, Ljubljana, Slovenia, 2020. [Google Scholar]
- Reed, R.P. Nitrogen in austenitic stainless steels. JOM 1989, 41, 16–21. [Google Scholar] [CrossRef]
- Burja, J.; Koležnik, M.; Župerl, Š.; Klančnik, G. Nitrogen and nitride non-metallic inclusions in steel. Mater. Tehnol. 2019, 53, 919–928. [Google Scholar] [CrossRef]
- Losertová, M. Biocompatible Materials. In Advanced Materials, 1st ed.; VŠB—Technical University of Ostrava: Ostrava, Czech Republic, 2014; pp. 108–119. [Google Scholar]
- Turkdogan, E.T. Physicochemical Properties of Steel. In Fundamentals of Steelmaking, 1st ed.; Maney Publishing: Leeds, UK, 2010; pp. 91–131. [Google Scholar]
- Qian, K.; Chen, B.; Zhao, P.; Zhang, M.; Liu, K. Solubility of Nitrogen in Liquid Ni, Ni–Nb, Ni–Cr–Nb, Ni–Fe–Nb, and Ni–Cr–Fe–Nb Systems. ISIJ Int. 2019, 59, 2220–2227. [Google Scholar] [CrossRef] [Green Version]
- Lee, S.-B.; Jung, M.-C.; Song, H.; Rhee, C.-H. Effect of Niobium on Nitrogen Solubility in High Chromium Steel. ISIJ Int. 2002, 42, 603–608. [Google Scholar] [CrossRef]
- Yang, S.; Li, H.; Feng, H.; Li, X.; Jiang, Z.; He, T. Nitrogen Solubility in Liquid Fe–Nb, Fe–Cr–Nb, Fe–Ni–Nb and Fe–Cr–Ni–Nb Alloys. ISIJ Int. 2021, 61, 1498–1505. [Google Scholar] [CrossRef]
- Sigworth, G.K.; Elliott, J.F. The Thermodynamics of Liquid Dilute Iron Alloys. Met. Sci. 1974, 8, 298–310. [Google Scholar] [CrossRef]
- Kim, W.-Y.; Lee, C.-O.; Yun, C.-W.; Pak, J.-J. Effect of Chromium on Nitrogen Solubility in Liquid Fe–Cr Alloys Containing 30 mass% Cr. ISIJ Int. 2009, 49, 1668–1672. [Google Scholar] [CrossRef] [Green Version]
- Qu, T.-P.; Tian, J.; Chen, K.-L.; Xu, Z.; Wang, D.-Y. Precipitation behaviour of TiN in Nb-Ti containing alloyed steel during the solidification process. Ironmak. Steelmak. 2019, 46, 353–358. [Google Scholar] [CrossRef]
- You, D.; Michelic, S.K.; Presoly, P.; Liu, J.; Bernhard, C. Modeling Inclusion Formation during Solidification of Steel: A Review. Metals 2017, 7, 460. [Google Scholar] [CrossRef] [Green Version]
- You, D. Modeling Microsegregation and Nonmetallic Inclusion Formation Based on Thermodynamic Databases. Ph.D. Thesis, Montanuniversität Leoben, Leoben, Austria, 2016. [Google Scholar]
- Choudhary, S.K.; Ghosh, A. Mathematical Model for Prediction of Composition of Inclusions Formed during Solidification of Liquid Steel. ISIJ Int. 2009, 49, 1819–1827. [Google Scholar] [CrossRef] [Green Version]
- Won, Y.-M.; Thomas, B. Simple model of microsegregation during solidification of steels. Met. Mater. Trans. A 2001, 32, 1755–1767. [Google Scholar] [CrossRef]
- Clyne, T.W.; Kurz, W. Solute redistribution during solidification with rapid solid state diffusion. Met. Mater. Trans. A 1981, 12, 965–971. [Google Scholar] [CrossRef]
- You, D.; Michelic, S.; Wieser, G.; Bernhard, C. Modeling of manganese sulfide formation during the solidification of steel. J. Mater. Sci. 2017, 52, 1797–1812. [Google Scholar] [CrossRef] [Green Version]
- Shu, Q.; Visuri, V.-V.; Alatarvas, T.; Fabritius, T. Model for Inclusion Precipitation Kinetics During Solidification of Steel Applications in MnS and TiN Inclusions. Met. Mater. Trans. A 2020, 51, 2905–2916. [Google Scholar] [CrossRef]
- Diederichs, R.; Bülte, R.; Pariser, G.; Bleck, W. Modelling of Manganese Sulphide Formation during Solidification, Part II: Correlation of Solidification and MnS Formation. Steel Res. Int. 2006, 77, 256–264. [Google Scholar] [CrossRef]
- Capurro, C.; Cicutti, C. Analysis of titanium nitrides precipitated during medium carbon steels solidification. J. Mater. Res. Technol. 2018, 7, 342–349. [Google Scholar] [CrossRef]
- Perez, M.; Courtois, E.; Acevedo, D.; Epicier, T.; Maugis, P. Precipitation of niobium carbonitrides in ferrite: Chemical composition measurements and thermodynamic modelling. Philos. Mag. Lett. 2007, 87, 645–656. [Google Scholar] [CrossRef] [Green Version]
Figure 1.
A 3D drawing—model of the casting.

Figure 2.
Temperature dependence of the equilibrium solubility product of niobium and nitrogen in liquid steel melt.
Figure 2.
Temperature dependence of the equilibrium solubility product of niobium and nitrogen in liquid steel melt.

Figure 3.
Effect of chromium and nickel addition on equilibrium solubility product of niobium and nitrogen in steel melt at 1773 K.
Figure 3.
Effect of chromium and nickel addition on equilibrium solubility product of niobium and nitrogen in steel melt at 1773 K.

Figure 4.
Effect of solid fraction on (a) niobium, (b) nitrogen, and (c) niobium–nitrogen solubility product content under different microsegregation models.
Figure 4.
Effect of solid fraction on (a) niobium, (b) nitrogen, and (c) niobium–nitrogen solubility product content under different microsegregation models.


Figure 5.
Equilibrium phase composition of steels (a) 10Ni, (b) 5Ni, and (c) 0Ni.

Figure 6.
Equilibrium solidification curve according to the Scheil method above 0.8 fraction solid.

Figure 7.
Optical microscopy of the as-cast microstructures of 10Ni, 5Ni, and 0Ni steels at different section diameters, etched with Vilella.
Figure 7.
Optical microscopy of the as-cast microstructures of 10Ni, 5Ni, and 0Ni steels at different section diameters, etched with Vilella.

Figure 8.
Backscattered electron images of the as-cast 10Ni-20 steel sample (a) lower magnification, (b) higher magnification.
Figure 8.
Backscattered electron images of the as-cast 10Ni-20 steel sample (a) lower magnification, (b) higher magnification.

Figure 9.
Backscattered electron image of MnS inclusion, niobium carbonitrides, and eutectic phase agglomerate in the austenite matrix in the 10Ni-70 steel sample, and EDS of Cr, C, Nb, and Mn.
Figure 9.
Backscattered electron image of MnS inclusion, niobium carbonitrides, and eutectic phase agglomerate in the austenite matrix in the 10Ni-70 steel sample, and EDS of Cr, C, Nb, and Mn.

Figure 10.
EDS elemental mapping of C, Cr, Nb, Mn, and O of complex inclusion.

Figure 11.
Backscattered electron image of (a) 5Ni-70 steel sample and (b) 0Ni-70.

Figure 12.
Influence of cooling rate and nickel content in as-cast samples on area fraction of carbonitrides.
Figure 12.
Influence of cooling rate and nickel content in as-cast samples on area fraction of carbonitrides.


Table 1.
Chemical compositions of as-cast samples expressed in percent by weight.
| Sample | C | Si | Mn | S | Cr | Ni | Nb | N | Fe |
|---|---|---|---|---|---|---|---|---|---|
| 10Ni | 0.042 | 0.32 | 0.78 | 0.021 | 18.19 | 9.00 | 0.49 | 0.039 | bal. |
| 5Ni | 0.035 | 0.24 | 0.77 | 0.014 | 18.70 | 4.70 | 0.45 | 0.040 | bal. |
| 0Ni | 0.041 | 0.24 | 0.65 | 0.013 | 18.36 | 0.16 | 0.47 | 0.030 | bal. |
Table 2.
First-order interaction parameter in dilute liquid iron for selected elements at 1873 K. Data from [13].
Table 2.
First-order interaction parameter in dilute liquid iron for selected elements at 1873 K. Data from [13].
| j | ||||||
|---|---|---|---|---|---|---|
| N | Cr | Ni | Nb | C | ||
| i | N | 0 | −0.047 | 0.01 | −0.06 | 0.13 |
| Cr | −0.19 | −0.0003 | 0.0002 | 0 | −0.12 | |
| Ni | 0.028 | −0.0003 | 0.0009 | 0 | 0.042 | |
| Nb | −0.83 | 0 | 0 | 0 | −0.49 | |
| C | 0.11 | −0.024 | −0.044 | −0.06 | 0.14 | |
Table 3.
Second-order interaction parameter in dilute liquid iron for selected elements at 1873 K. Data from [13].
Table 3.
Second-order interaction parameter in dilute liquid iron for selected elements at 1873 K. Data from [13].
| j | ||||||
|---|---|---|---|---|---|---|
| N | Cr | Ni | Nb | C | ||
| i | N | 0 | −0.0004 | 0 | 0 | 0 |
| Cr | 0 | 0 | 0 | 0 | 0 | |
| Ni | 0 | 0 | 0 | 0 | 0 | |
| Nb | 0 | 0 | 0 | 0 | 0 | |
| C | 0 | 0 | 0 | 0 | 0.0074 | |
Table 4.
First-order interaction parameter in liquid Fe-Cr-Ni-Nb system. Data from [10].
Table 4.
First-order interaction parameter in liquid Fe-Cr-Ni-Nb system. Data from [10].
| j | |||||
|---|---|---|---|---|---|
| N | Cr | Ni | Nb | ||
| i | N | 0 | −164/T + 0.0415 | 8.33/T + 0.0019 | −375.6/T + 0.133 |
Table 5.
Second-order interaction parameter in liquid Fe-Cr-Ni-Nb system. Data from [10].
Table 5.
Second-order interaction parameter in liquid Fe-Cr-Ni-Nb system. Data from [10].
| j | |||||
|---|---|---|---|---|---|
| N | Cr | Ni | Nb | ||
| i | N | 0 | 1.685/T − 0.0006 | −1.835/T + 0.00105 | 0 |
Table 6.
Second-order cross-interaction parameter in liquid Fe-Cr-Ni-Nb system. Data from [10].
Table 6.
Second-order cross-interaction parameter in liquid Fe-Cr-Ni-Nb system. Data from [10].
| j | ||||
|---|---|---|---|---|
| Cr | Ni | Nb | ||
| i | Cr | 0 | 1.6/T − 0.0009 | 36.2/T − 0.01728 |
| Ni | 0 | 0 | 4.59/T − 0.00187 | |
| Nb | 0 | 0 | 0 | |
| Model | |
|---|---|
| Lever rule | |
| Scheil–Gulliver | |
| Brodey–Flemings | |
| Clyne–Kurz | |
| Ohnaka | |
| Parameter | Nb | N |
|---|---|---|
| C0, i (wt.%) | 0.5 | 0.03 |
| kiδ/L | 0.4 | 0.25 |
| Diδ (m2/s) | 5 × 10⁻³ × e(−251960/RT) | 8 × 10⁻⁷ × e(−79078/RT) |
| TL (K) | 1780 | |
| TS (K) | 1749 | |
| Rc (K/s) | 0.5 | |
| λS (m) | 3.194 × 10⁻⁴ × Rc−0.378 | |
Table 9.
Sample cooling rates (K/s).
| Sample | Section Diameter (mm) | ||
|---|---|---|---|
| 20 | 35 | 70 | |
| 10Ni | 2.73 | 0.63 | 0.40 |
| 5Ni | 3.08 | 0.78 | 0.47 |
| 0Ni | 2.51 | 0.67 | 0.44 |
Table 10.
Ferrite fraction in steel samples (%).
| Sample | Section Diameter (mm) | ||
|---|---|---|---|
| 20 | 35 | 70 | |
| 10Ni | 7.1 ± 0.6 | 5.9 ± 0.5 | 6.7 ± 0.6 |
| 5Ni | 63.7 ± 1.2 | 64.6 ± 1.5 | 65.5 ± 1.4 |
| 0Ni | 90.0 ± 2.0 | 90.5 ± 2.0 | 89.7 ± 2.0 |
Publisher’s Note: MDPI stays neutral with regard to jurisdictional claims in published maps and institutional affiliations. |
© 2022 by the authors. Licensee MDPI, Basel, Switzerland. This article is an open access article distributed under the terms and conditions of the Creative Commons Attribution (CC BY) license (https://creativecommons.org/licenses/by/4.0/).
Share and Cite
MDPI and ACS Style
Bajželj, A.; Šetina Batič, B.; Medved, J.; Burja, J. Influence of Nickel on Niobium Nitride Formation in As-Cast Stainless Steels. Metals 2022, 12, 609. https://doi.org/10.3390/met12040609
AMA Style
Bajželj A, Šetina Batič B, Medved J, Burja J. Influence of Nickel on Niobium Nitride Formation in As-Cast Stainless Steels. Metals. 2022; 12(4):609. https://doi.org/10.3390/met12040609
Chicago/Turabian StyleBajželj, Anže, Barbara Šetina Batič, Jožef Medved, and Jaka Burja. 2022. "Influence of Nickel on Niobium Nitride Formation in As-Cast Stainless Steels" Metals 12, no. 4: 609. https://doi.org/10.3390/met12040609
Note that from the first issue of 2016, this journal uses article numbers instead of page numbers. See further details here.