Article

In-Depth Rheological Characterization of Tungsten Sol-Gel Inks for Inkjet Printing

by
Urša Opara Krašovec
1,
Tjaša Vidmar
1,
Marta Klanjšek Gunde
2,
Romana Cerc Korošec
3 and
Lidija Slemenik Perše
4,*
1
Faculty of Electrical Engineering, University of Ljubljana, Tržaška 25, 1000 Ljubljana, Slovenia
2
National Institute of Chemistry, Hajdrihova 19, 1000 Ljubljana, Slovenia
3
Faculty of Chemistry and Chemical Engineering, University of Ljubljana, Večna pot 113, 1000 Ljubljana, Slovenia
4
Faculty of Mechanical Engineering, University of Ljubljana, Aškerčeva cesta 6, 1000 Ljubljana, Slovenia
*
Author to whom correspondence should be addressed.
Coatings 2022, 12(2), 112; https://doi.org/10.3390/coatings12020112
Submission received: 30 December 2021 / Revised: 14 January 2022 / Accepted: 17 January 2022 / Published: 19 January 2022
(This article belongs to the Special Issue Polymer Thin Films: From Fundamentals to Applications)

Abstract

:
The inkjet printing of the functional materials prepared by the sol-gel route is gaining the attention for the production of the variety of the applications not limited to the printed boards, displays, smart labels, smart packaging, sensors and solar cells. However, due to the gelation process associated with the changes from Newtonian to non-Newtonian fluid the inkjet printing of the sol-gel inks is extremely complex. In this study we reveal in-depth rheological characterization of the WO3 sols in which we simulate the conditions of the inkjet printing process at different temperature of the cartridge (20–60 °C) by analyzing the structural and rheological changes taking place during the gelation of the tungsten oxide (WO3) ink. The results provide the information on the stability of the sol and a better insight on the effects of the temperature on the gelation time. Moreover, the information on the temperature and the time window at which the inkjet printing of the sol-gel inks could be performed without clogging were obtained. The WO3 ink was stable in a beaker and exhibited Newtonian flow behavior at room temperature over 3 weeks, while the gelation time decreased exponentially with increasing temperature down to 0.55 h at 60 °C.

1. Introduction

Functional materials are used in wide-ranging industrial fields including, but not limited to solar cells, energy storage devices, displays, smart windows, catalysts for chemical reactions and sensors [1]. Among them the tungsten oxide (WO3) represents an inorganic transition metal oxide with chromogenic and semiconductor properties, which enable its applicability in numerous applications mentioned above [2,3,4]. The WO3 layers can be produced with complex and expensive techniques (physical vapor deposition—PVD, chemical vapor deposition—CVD and electrodeposition) or by less expensive application from a solution phase (sol-gel, mixture of powder and different solvents) [5]. A variety of the sol-gel chromogenic devices enabling optical modulation of the interior light in the buildings [6,7], such as electrochromic [7,8], photoelectrochromic [9,10], photochromic [11,12,13] and gasochromic [14] have been prepared with the dip-coated WO3 layers from the corresponding sols. This publication focuses on the in-depth study of the rheological characteristics of the sol-gel derived WO3 inks suitable for inkjet printing [15].
The sol-gel process enables the fabrication of the variety of the functional materials [16]. The process involves the conversion of small molecules (monomers) into a colloidal solution (sol) that transforms to an integrated network (gel) in which the solvent is trapped. Further drying of the gel leads to the formation of a solvent free xerogel while annealing of the xerogel results in the powder. On the other hand, the printing is becoming more and more linked with the applications such as printed boards, displays, smart labels, smart packaging, and various printed electronic such as different sensors, solar cells, etc., which all require the availability of the functional materials in ink or paste form required for the planned printing technique [17,18,19,20]. Therefore, nowadays, functional sol-gel materials are entering the printing production, but the area is still new and underexplored. Every ink or paste should exhibit proper rheological properties, which are essential for every specific deposition process. The inkjet printing requires low viscosity of the inks (1–30 mPa.s) and surface tension around 30 mN/m, the ink typically contains a complex mixture of many solvents with high and low boiling points [18,20]. This allows proper drop generation, avoids nozzle clogging and provides optimal printing results. However, due to irreversible behavior of sol-gel material, inkjet printing of functional sol-gel materials is even more complex and requires a careful gelation control of inks, with necessary fine tuning of their rheological properties [15].
In 1997, Atkinson and coworkers reported one of the first examples of inkjet printouts using sol-gel inks [21]. Since then, the research interest in using sol-gel materials for inkjet printing production of metal oxides has increased, which is demonstrated by numerous scientific publications over the past decade [19,22,23,24,25]. Furthermore, the printability of the tungsten sol using inkjet printing has been successfully demonstrated [15]. The tungsten oxide—WO3 printouts with the thickness of around 300 nm were realized of very good optical quality and enabled the realization of the electrochromic devices [15]. The tungsten sol used as functional ink has been modified by using 2-propoxy propanol to match the inkjet printing requirements for proper drop generation (jetting characteristics), smooth ink transfer through printer and uniformity of deposited films [15].
Moreover, inkjet printing has complex drying behavior, therefore an appropriative solvent system, temperature modulation of printer vacuum plates (up to 60 °C) and also cartridge temperature (up to 70 °C) should be carefully chosen for each individual system and substrate in order to form uniform deposited films [18,20]. From this perspective, it is of paramount importance to perform a rheological study of inks by simulating the conditions in printing process. An in-depth study of the sol rheology could enable better insight of the sol-gel inks limitations as well as the control of the sol-gel material stability (sol-gel transition) which is required for continuous inkjet printing without clogging. The inks should have Newtonian behavior, which means that viscosity of fluid or ink is constant with applied shear rates. In the case of the sol-gel inks the transition of the sol to gel occurs therefore the ink changes from Newtonian to non-Newtonian fluid. In this regard printing of functional sol-gel materials is even more complex and requires a careful gelation control of the ink, with necessary understanding of its rheological properties.
To our knowledge, we are the first to reveal in-depth rheological characterization of the WO3 sols for inkjet printing in which we simulate the conditions of the printing process. Publication by Karimi-Nazarabad et al. [26] describes the rheological properties of nanofluids of tungsten oxide nanoparticles in ethylene glycol and glycerol. The authors don’t report on practical usage of studied nanofluids, neither on the rheological characteristics of the gelation process of the samples. Moreover, D. Tripkovic et al. [27] demonstrated tailoring of BaTiO4 sol-gel inks for inkjet printing. The most relevant publication [28], describes the study of rheological properties of TiO2 sol for direct write assembly in planar and 3D configuration.
The aim of this study is to characterize the sol to gel transition of the WO3 inks at various temperatures that the ink could be exposed to during the inkjet printing. The results were obtained by coupling two measurement techniques, IR spectroscopy and rheological characterization. Rheological study enabled the insight into the gelation process, while the IR spectroscopy shed the light on the changes of the chemical structure of the WO3 sols taking place during the transformation of the sol to the gel.

2. Materials and Methods

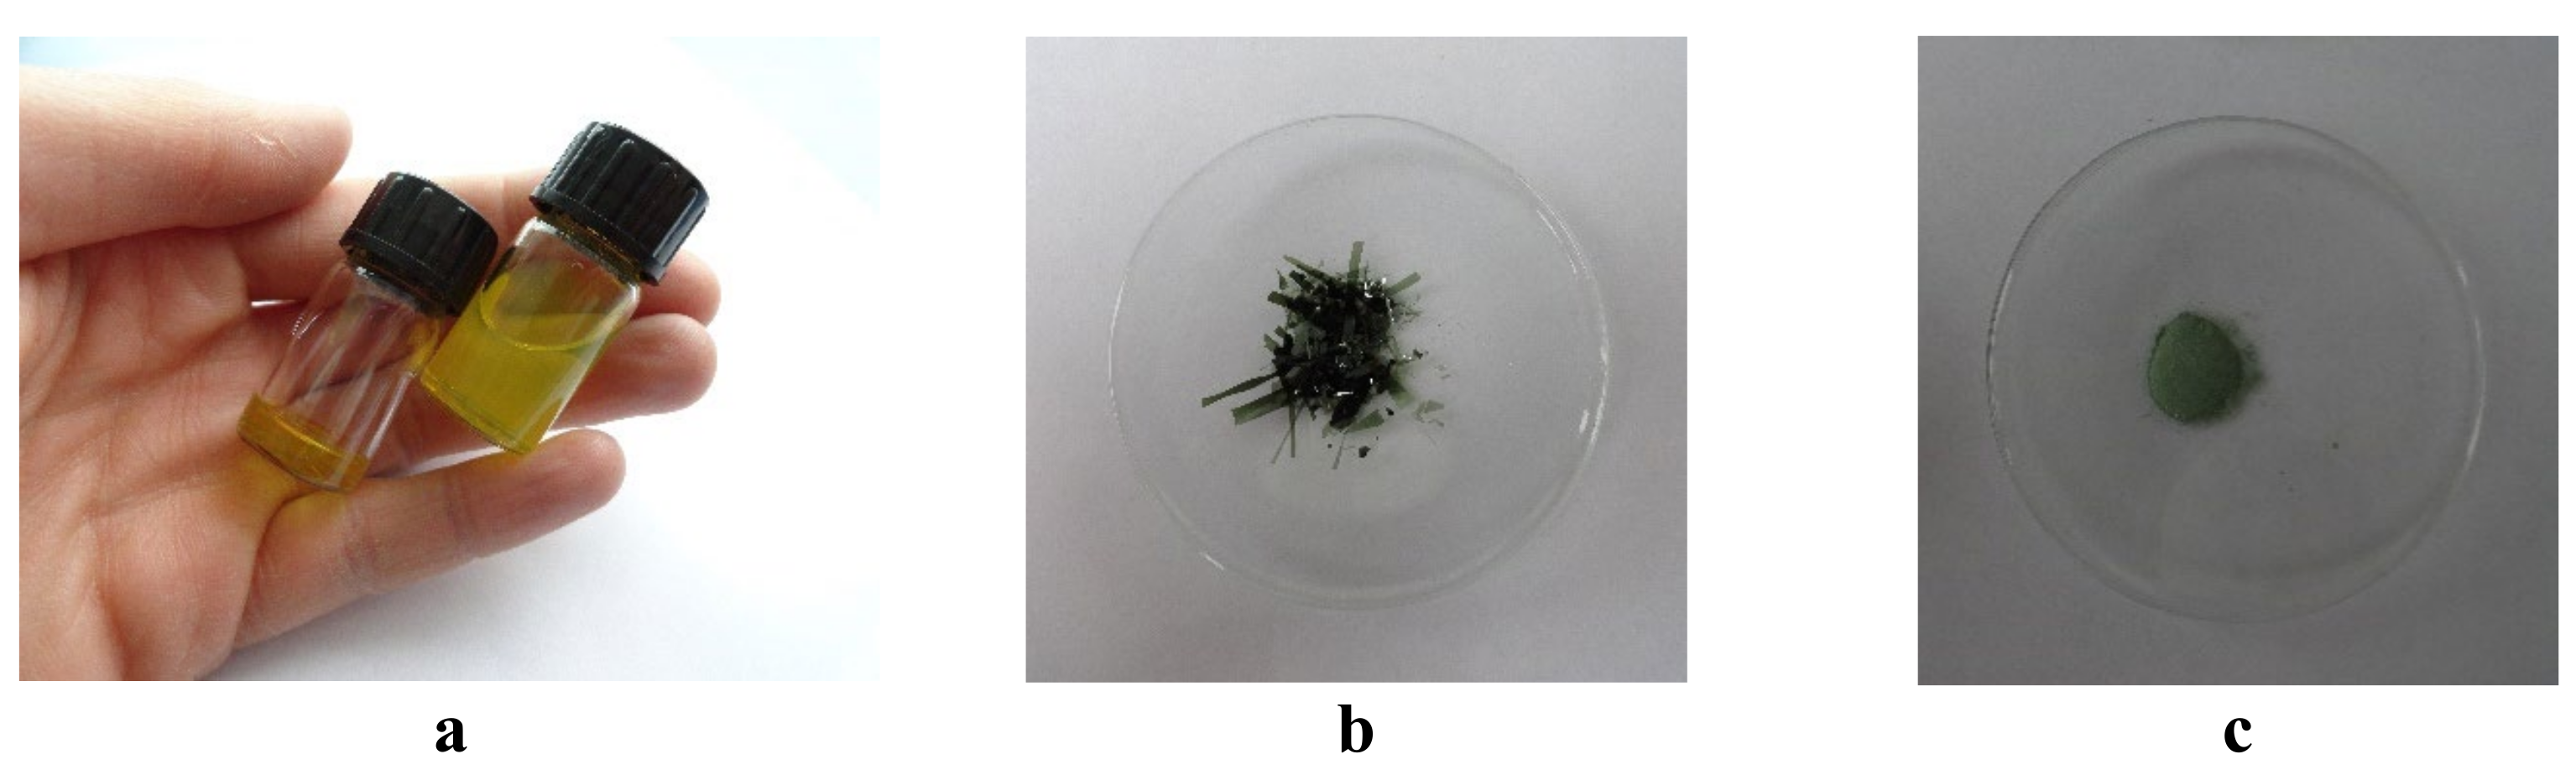
2.1. Preparation of the WO3 Sol

Step one involved the synthesis of a WO3 sol. First, peroxo-tungstic acid (PTA) was synthesized by reacting 5 g of tungsten monocrystalline powder (mean particle size < 1 micron, purity 99.95%, Sigma-Aldrich GmbH, Schneldorf, Germany) with 20 mL of hydrogen peroxide (30%, Belinka). This reaction is strongly exothermic. Sols where then prepared by adding solvent to the PTA solution at 120 °C. The addition of alcohol resulted in the formation of the W-ether that polymerizes to peroxopolytungstic acid (P-PTA) [29]. Solvent for inkjet printing ink should have boiling point higher than 100 °C, therefore WO3 sol used in this study as ink was prepared with a mixture of two solvents with different boiling points, i.e., 2-propanol (ACS reagent, Sigma-Aldrich GmbH, Schneldorf, Germany) and 2-propoxy ethanol (Puriss, Sigma-Aldrich, Schneldorf, Germany). The ink appeared slightly orange and contained 27.7 mmol of tungsten per 30 mL of sol. Figure 1 presents the WO3 sol and gel state—Figure 1a, the WO3 xerogel dried at RT—Figure 1b and the WO3 powder annealed for 1 h at 450 °C—Figure 1c. More details on the preparation of the sols could, also the ones based solely on ethanol and 2-propanol could be found in Ref [15].

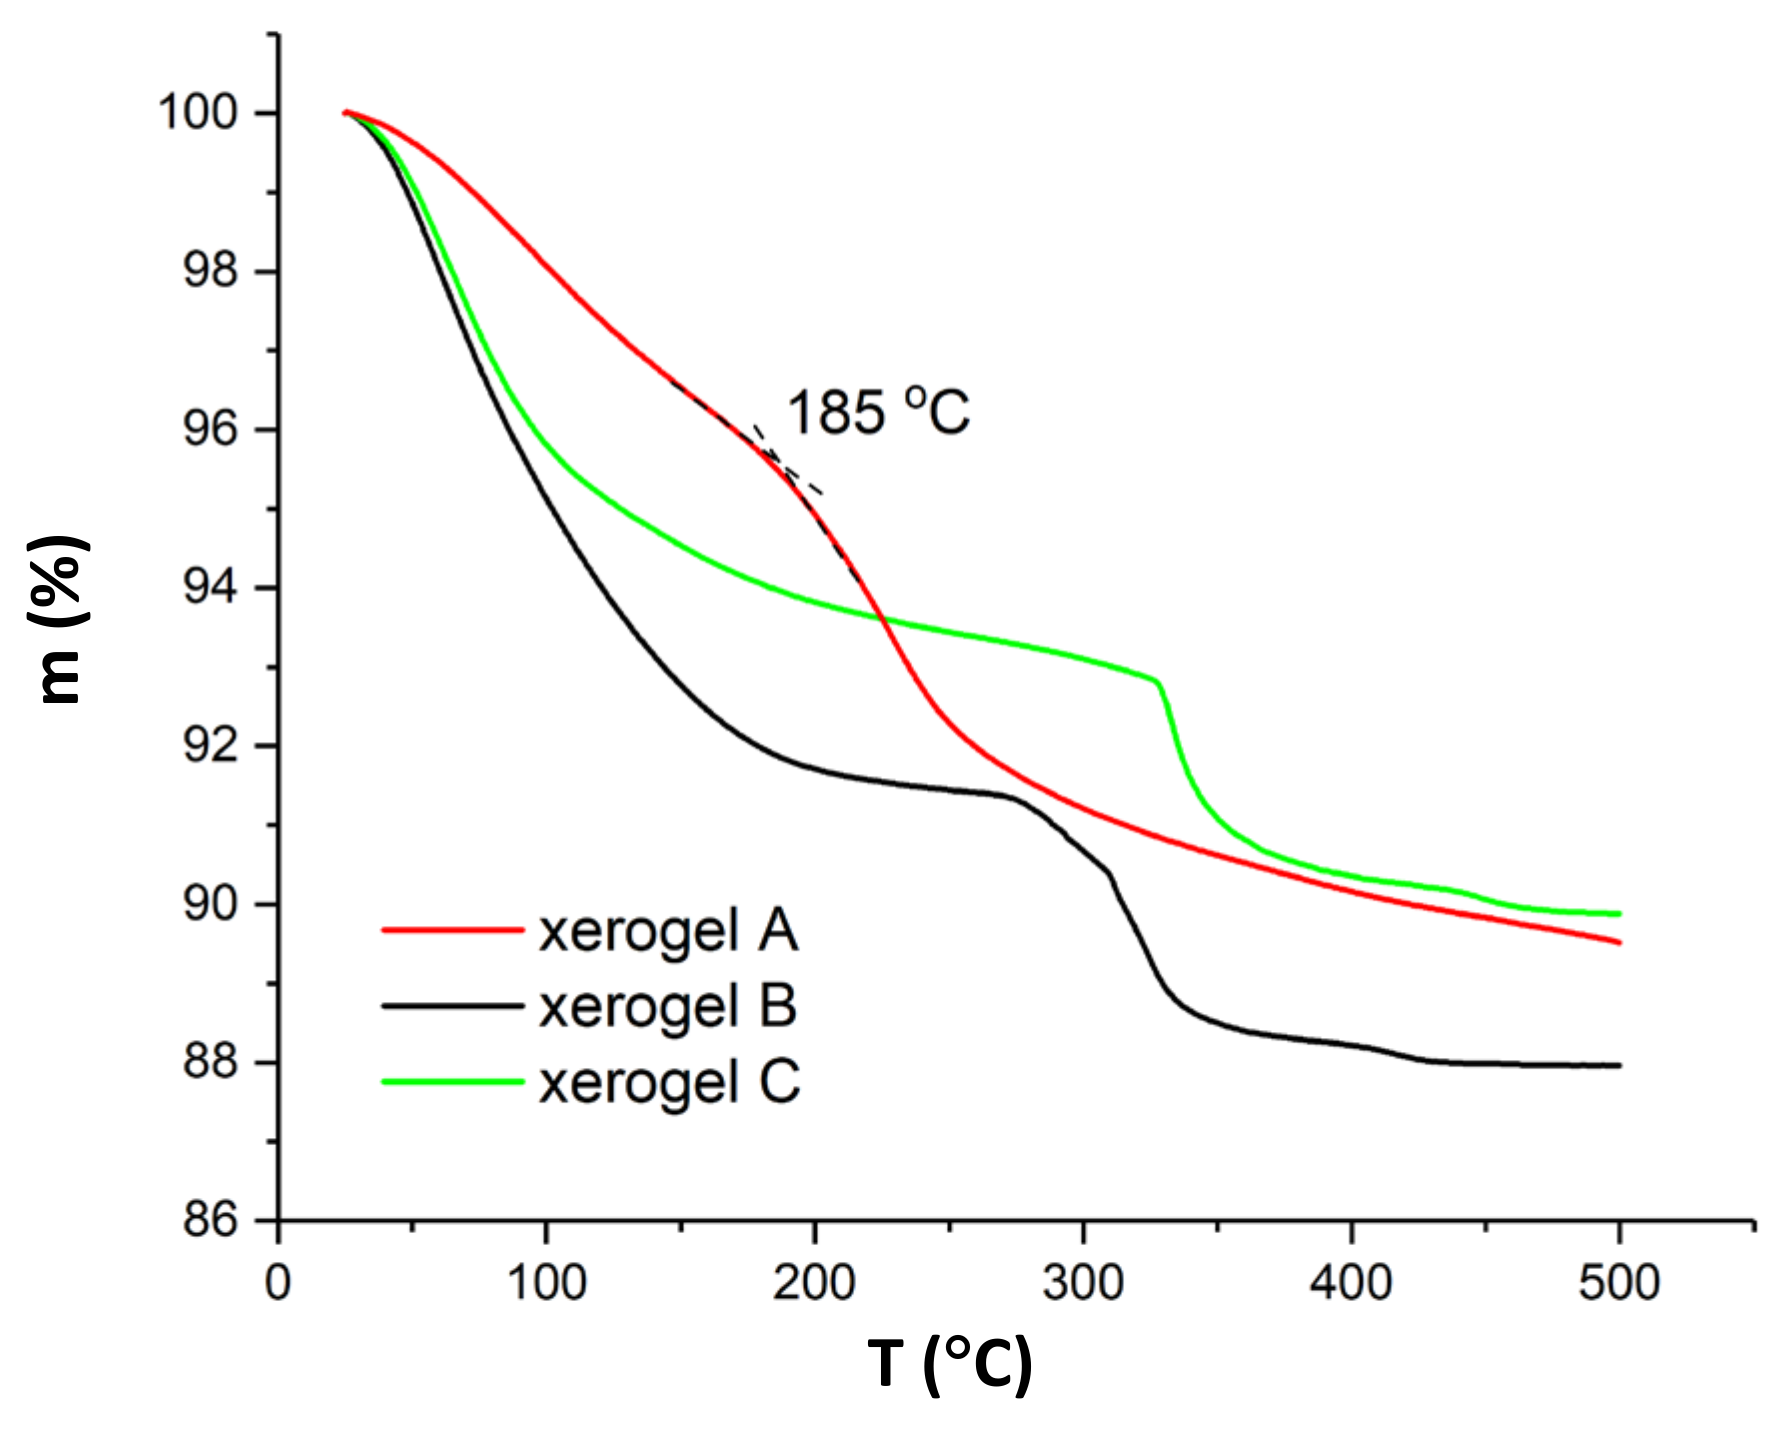
2.2. Thermogravimmetric Analysis of the WO3 Xerogles

Thermogravimetric (TG) measurements of WO3 sols, prepared with different solvents, were performed using Mettler Toledo TGA/DSC1 instrument (Mettler Toledo, Schwerzenbach, Switzerland). Samples were heated from room temperature to 500 °C with the hating rate of 5 K min‒1 under the dynamic air flow (100 mL min‒1). 75 μL of the prepared sol was pipetted into 150 μL platinum crucible and dried under air for 24 h. After drying, masses of the samples used for analyses were around 15 mg. The blank curve was subtracted.
Dynamic TG curves of all three samples are shown in Figure 2. The course of thermal decomposition is similar for xerogels B and C, where ethanol and 2-propanol were used as a solvent while the mass-loss curve has a different course in the case of xerogel A, where the solvent was a mixture of 2-propoxy ethanol and 2-propanol. We ascribe the first step, which takes place from room temperature to approximately 200 °C, to solvent evaporation. In this step mass-loss rate is higher in the case of xerogel B and C. Up to 185 °C, xerogel B losses 6.0% of the initial mass, while xerogel C 8.10% and xerogel A 4.5%, respectively. The second and the third step, where condensation reactions continue, are partially overlapped. For xerogel B mass loss is additional 3.0% in a temperature range from 270 °C to 350 °C and from 350 °C to 430 °C another 0.5%. Similar behavior is observed for xerogel C except that the second step begins at higher temperature, i.e., 325 °C. Successive reactions are much more overlapped in the case of xerogel A. Second step occurs in a temperature range from 185 °C to approximately 270 °C with a mass loss of 3.8% and turns then to the third step with a slower mass loss. Mass for the sample A is not constant even at 500 °C.

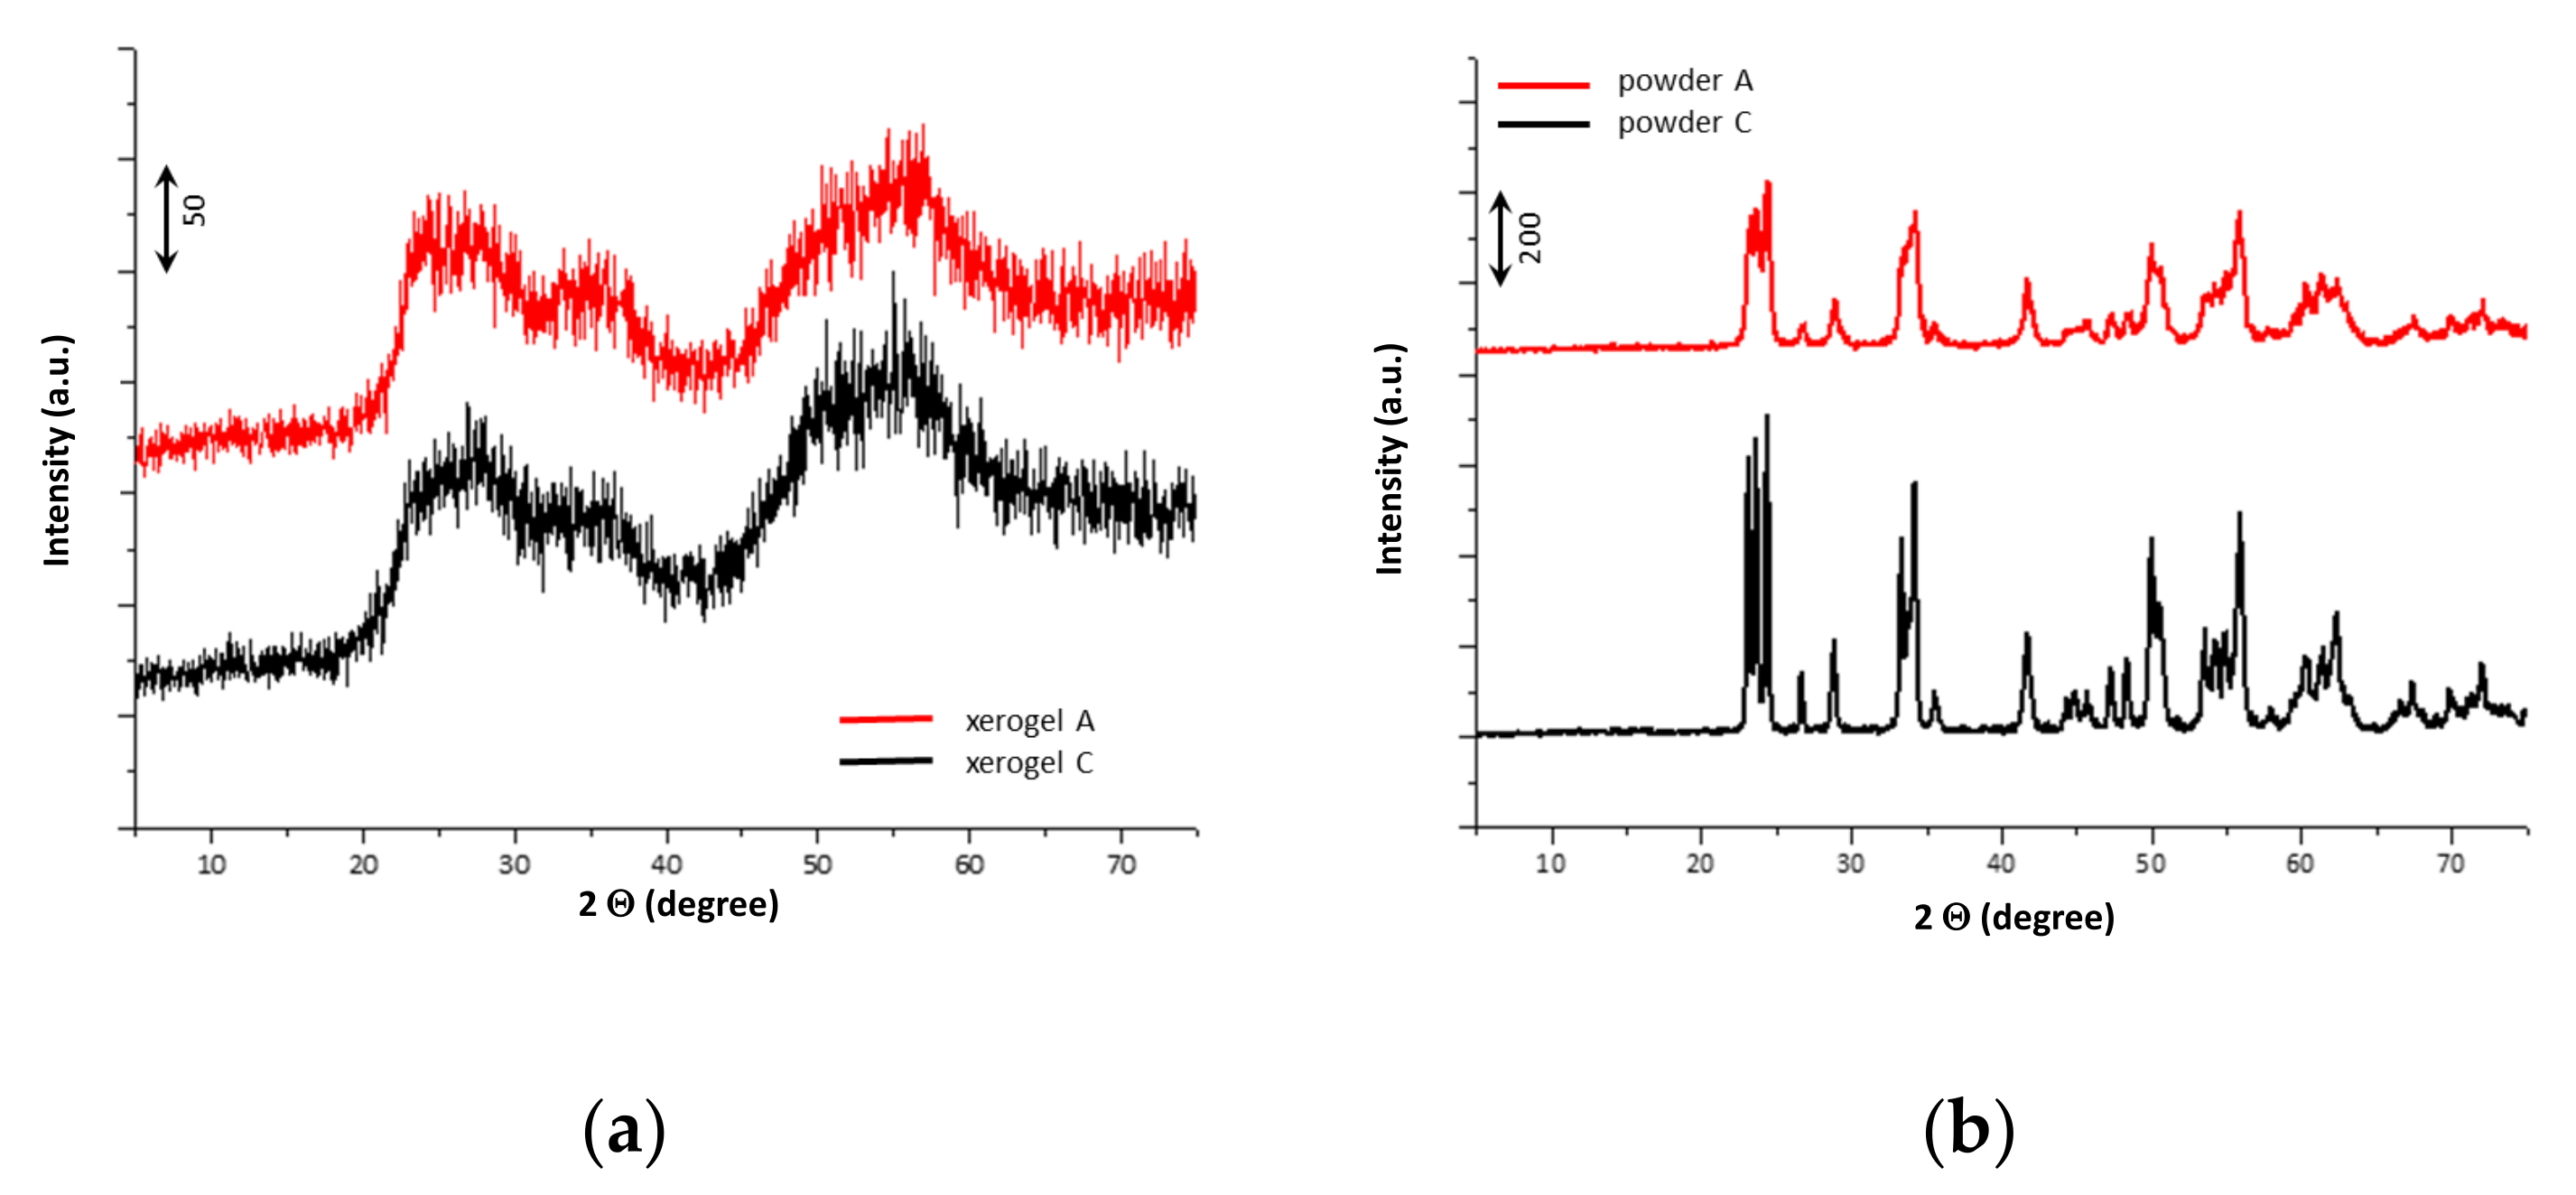
2.3. XRD Analysis of the WO3 Xerogles and Powders

The XRD measurements of the xerogels and powders were performed using a PW 1710 Philips X-ray diffractometer (Philips, Almelo, Netherlands). The XRD spectra of the WO3 xerogels prepared by either a mixture of 2-propoxy ethanol and 2-propanol or solely with 2-propanol are presented in Figure 3a, while the corresponding powders obtained after annealing of the xerogel at 450 °C for 1 h are shown in Figure 3b. The results confirmed that both WO3 xerogels, regardless on the solvent used for the sol preparation are amorphous while annealing of the xerogels leads to the crystallization. The analysis of the XRD spectra of the WO3 powders reveals the presence of the monoclinic phase, which is well in agreement with our previous results for the sample C [12].

2.4. Rheological Characterization

Rheological measurements were performed with a rotational controlled rate rheometer (Physica MCR302, Anton Paar, Graz, Austria), equipped with a cone and plate sensor system (CP 50/2°). Temperature of the measurements was controlled with a Peltier HOOD (Anton Paar, Graz, Austria).
All samples were tested under rotational and oscillatory shear conditions. Rotational flow tests were performed with a triangular method by changing the shear rate from 0–1000–0 s−1. Oscillatory stress sweep tests at constant frequency of oscillation (1 Hz) were used to determine the linear viscoelastic range (LVR). Frequency tests were performed at constant small deformation in LVR by decreasing the frequency from 20–0.01 Hz.

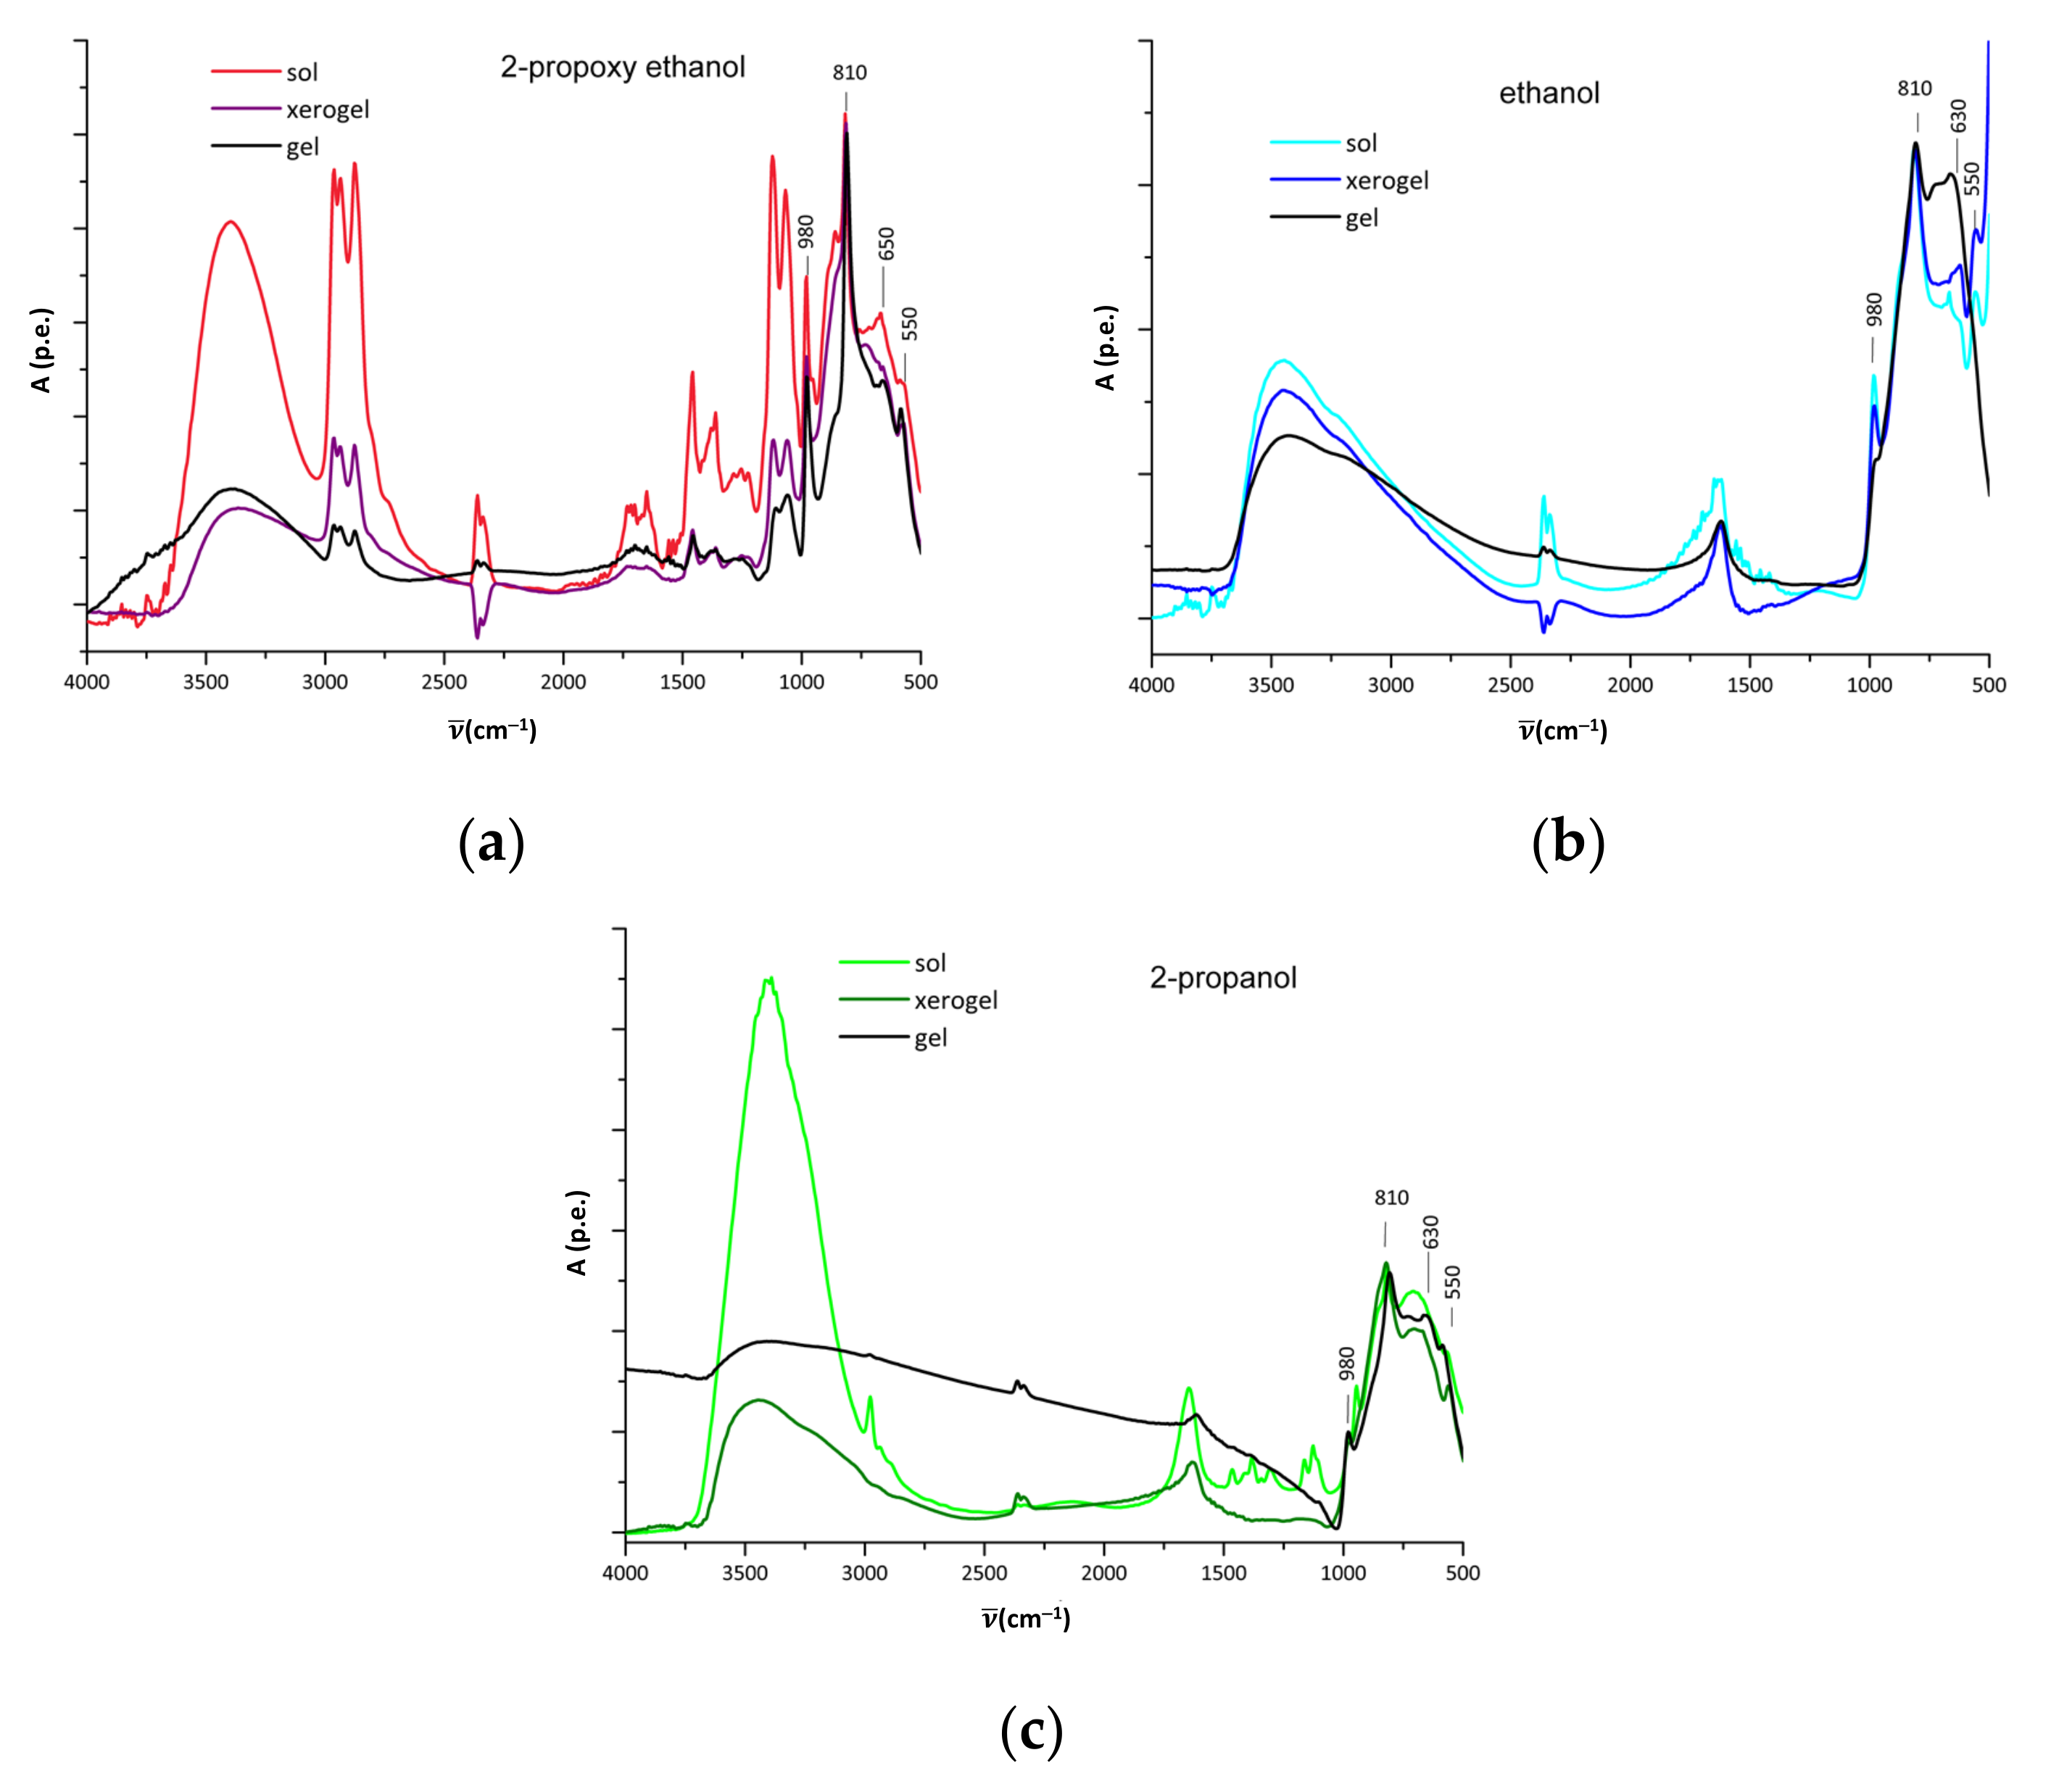
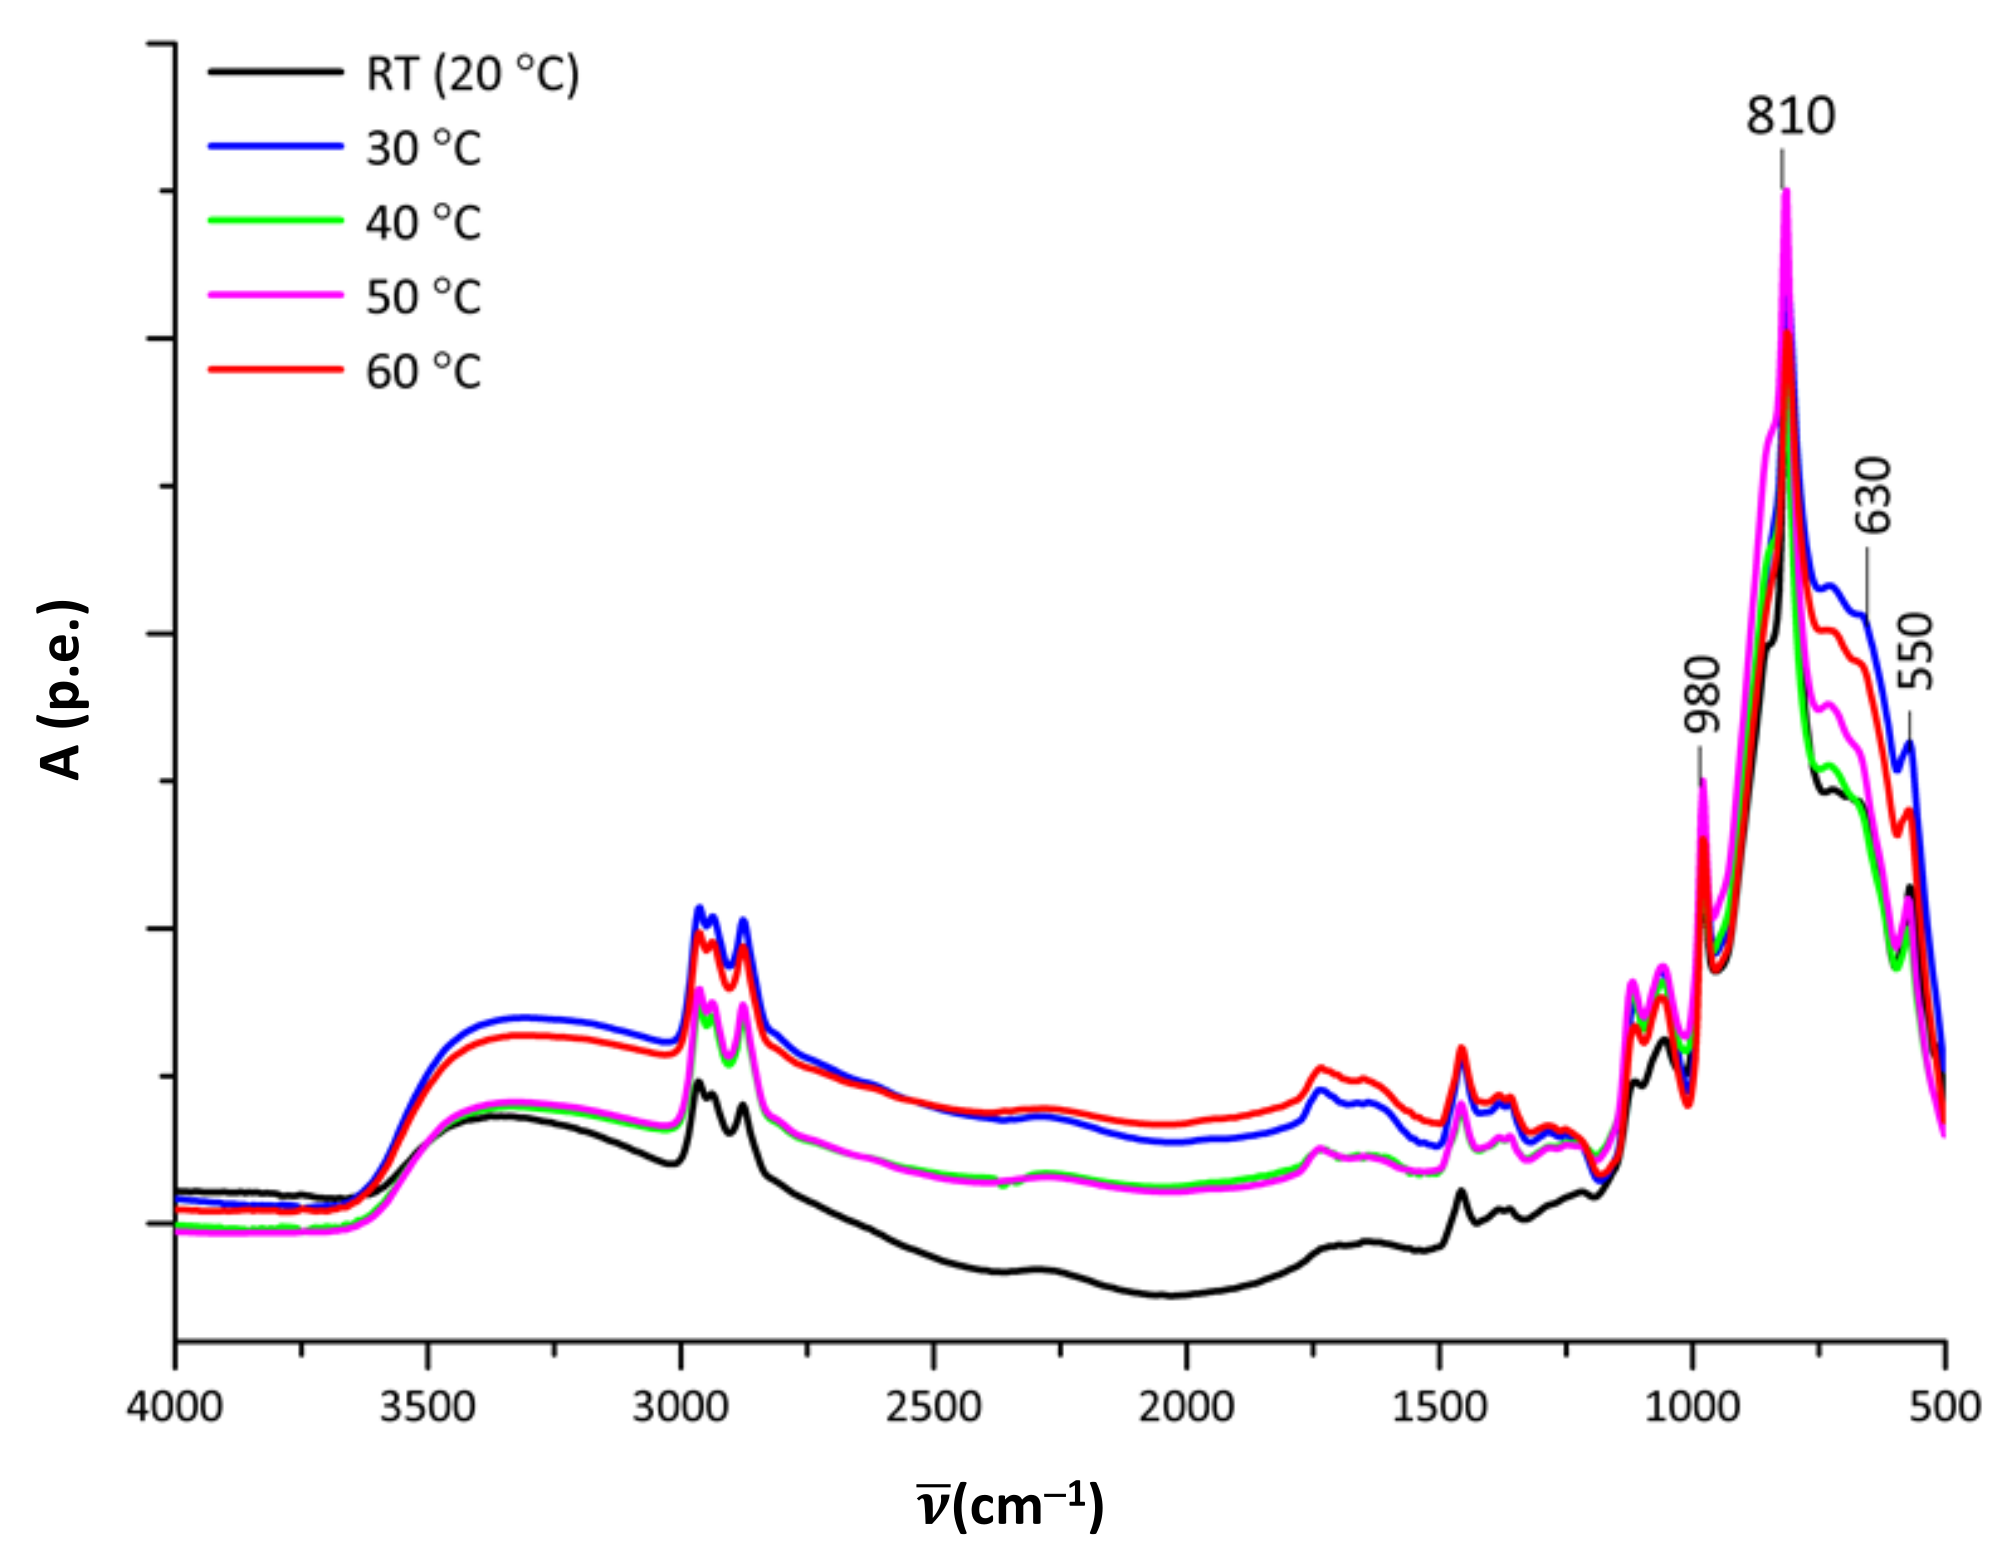
2.5. IR Spectroscopic Measurements

The IR spectra of the sols, xerogels and gels have been taken by FT-IR Perkin Elmer System 2000 spectrometer (PerkinElmer, Waltham, MA, USA). The samples have been deposited as thin layers on the double side polished Si-resin.

3. Results and Discussion

3.1. Structural Analysis of the Sols and Gels

A characteristic of a WO3 sol prepared by the peroxo sol-gel route is the presence of the peroxopolytungstic acid (P-PTA) clusters. The structure of the P-PTA was assessed in 1991 by Nanba et al. [29]. It is complex and consists of two edge-sharing 3-membered (W3O13) rings, located above and below the corner-shared 6-membered (WO7 pentagonal bipyramids) ring. The contact between these species is established via the H-bonds of water placed between them. The P-PTA structures transform during the sol preparation, drying and gelation process to the network of the tungsten polyhedra (WO6) connected via corners and edges. There are numerous factors influencing this transformation, among them are also the temperature and the alcohol used for the sol preparation.
For the IR spectrum of the WO3 sols a variety of the W-O bond oscillations are characteristic and the bands could be assigned to: the terminal bond, i.e., double bond between tungsten and oxygen, ν(W = O) at 980 cm−1, single W-O bond of tungsten polyhedra connected via corners, ν(W-O-W) at 630–650 cm−1 or via the edges, ν(W-O-W) at 700–720 cm−1. In addition, the peroxo bonds are characterized by the absorption peaks of the W-O-O-W and W-O-O oscillations at 800–830 cm–1 and 560 cm–1, respectively. The presence of water in the structure is evident from the broad band in the range 3000–3500 cm−1 (ν(O-H)) and a band at 1630 cm−1 (δ(H2O)) [30,31,32,33].
Figure 4 shows the IR spectra of the freshly deposited WO3 sols based on different alcohols, the xerogel of the sol that was dried in a recording chamber of the FTIR spectrophotometer and the WO3 gel. For the comparison of the influence of different solvents on the structure of the sols and gel formation we have analyzed beside the printable WO3 ink prepared by 2-propoxy ethanol (Figure 4a) also the IR spectra of the WO3 sols based on ethanol (Figure 4b) or 2-propanol (Figure 4c). It should be mentioned, that the WO3—ethanol and WO3—2-propanol sols have been found inappropriate for the inkjet printing [15] but are very suitable for dip-coating deposition of the active transparent WO3 layers used in chromogenic devices [7,9,10,11,12,14].
To compare how the temperature of the WO3 ink influences the cross-linking of the tungsten polyhedra and gel formation we have taken the IR spectra after the gelation of the WO3 sol in a rheometer at the temperatures (20 °C, 30 °C, 40 °C, 50 °C and 60 °C) at which the rheological properties of the sols were examined (Figure 5).
In the IR spectra of the wet sols prepared by different solvents (Figure 4) the bands characteristic for the –CH groups (2840–3000 cm−1) of the alcohol are present. The comparison of the IR spectra of the wet and dried sols-xerogels shows a noticeable difference in the intensity of the –CH bands. The results confirm that the alcohol entirely evaporates during drying of the sols at room temperature when the sols are prepared by ethanol or 2-propanol (Figure 4b,c), while it remains present when the 2-propoxy ethanol (Figure 4a) is used.
The IR spectra of the sols (Figure 4) show the presence of all the peaks characteristic for the P-PTA structure. However, the intensity of the peaks, characteristic for the crosslinking of the tungsten polyhedral, differs among the studied sols. The highest intensity of the band typical for peroxo groups (810 cm–1 and 560 cm−1) is characteristic for the fresh sol and the sol dried at RT (xerogel) prepared by 2-propoxy-ethanol (Figure 4a) which still contains some alcohol. While the intensity of the peroxo groups in the xerogel is much smaller in the case of ethanol and 2-propanol based WO3 xerogel that are solvent (alcohol) free. From these we conclude that the decomposition of the peroxo groups present in the P-PTA structure is associated with drying and evaporation of the solvent from the sol during the xerogel formation. The evaporation process is fast and complete for the sols prepared by ethanol and 2-propanol (Figure 4b,c). A slower decomposition of the peroxo groups has been found in the case of the sol containing 2-propoxy-ethanol (Figure 4a). The slower evaporation could have resulted also in slower gelation process, but the rheological studies showed the opposite. The rheological studies showed that the gelation is even faster in case of the WO3 sol prepared by 2-propoxy-ethanol. The reason for the faster gelation can be attributed to a different way of cross-linking of the WO3 polyhedra when different alcohols are used for the sol preparation which has been confirmed by the IR spectra analysis.
In addition to the IR spectra of dried sols, xerogel the spectra of the gels (Figure 4) confirmed that only in the case of the sol containing the 2-propoxy ethanol the alcohol remains trapped in the gel structure (Figure 4a). The results demonstrate a strong influence of the solvent on the cross-linking of the tungsten polyhedra. The analysis of the IR spectra of the gels prepared by ethanol and by 2-propanol reveals that the intensity of the band attributed to the terminal W = O bond (980 cm−1) strongly decreases during gelation, while the skeletal W-O bonds typical for the connection of the WO6 polyhedra at 630–650 cm−1 and 700–720 cm−1 increase in the intensity (Figure 4b,c). The results confirm also the lowest intensity of the terminal W = O bonds for the gels prepared with ethanol (Figure 4b) which implies that the strongest cross-linking of the tungsten polyhedra took place in the gel formed from the ethanol-based sol.
On the other hand, in the IR spectra of the gel formed from the sol based on 2-propoxy ethanol a peak characteristic for the terminal double W = O bond remains intensive as well as the bands characteristic for the peroxo groups (Figure 4a). This leads to the conclusion that in the WO3 gel based on 2-propoxy ethanol the P-PTA structure remains present to some degree, while the cross-linking of the tungsten polyhedra is hindered. In addition, the results confirmed the presence of the –CH bonds (peak at 2840–3000 cm−1) characteristic for the 2-propoxy ethanol meaning that the solvent remained trapped in the cross-linked WO3 gel structure (Figure 4a).
To summarize, the IR spectra analysis of the gels showed that the alcohol used for the WO3 sol preparation strongly influences the cross-linking process taking place in the gel formation. The WO3 gel based on 2-propoxy ethanol has the solvent kept in the gel structure, the structure of the P-PTA is to some extent preserved and the bonding of the tungsten polyhedra is not complete which results in a weaker and softer WO3 gels compared to the gels formed from the ethanol and 2-propanol tungsten sols (Figure 4).
In a further IR analysis, we followed the gelation of the WO3 sol based on 2-propoxy ethanol at different temperatures that the WO3 ink could be exposed during the inkjet processing while adjusting the printing parameters. The IR spectra of the WO3 gels were obtained after the gelation of the WO3 sol in a rheometer at 20, 30, 40, 50 and 60 °C (Figure 5). In the IR spectra of the gel a high intensity peaks characteristic for the peroxo bonds (peaks at 810 and 550 cm−1) were observed regardless of the temperature at which gelation took place. In addition, no significant difference of the skeletal W-O modes typical for corner or edge shared tungsten polyhedra has been noticed that might suggest different cross-linking mechanisms taking place at different temperature during the gel formation. Moreover, regardless of the temperature at which the gel has been formed the solvent, 2-propoxy ethanol remains trapped in the WO3 gel structure (Figure 5). The IR analysis shows no significant influence of the temperature, in the range between 20 and 60 °C, on the chemical structure of the WO3 gel.

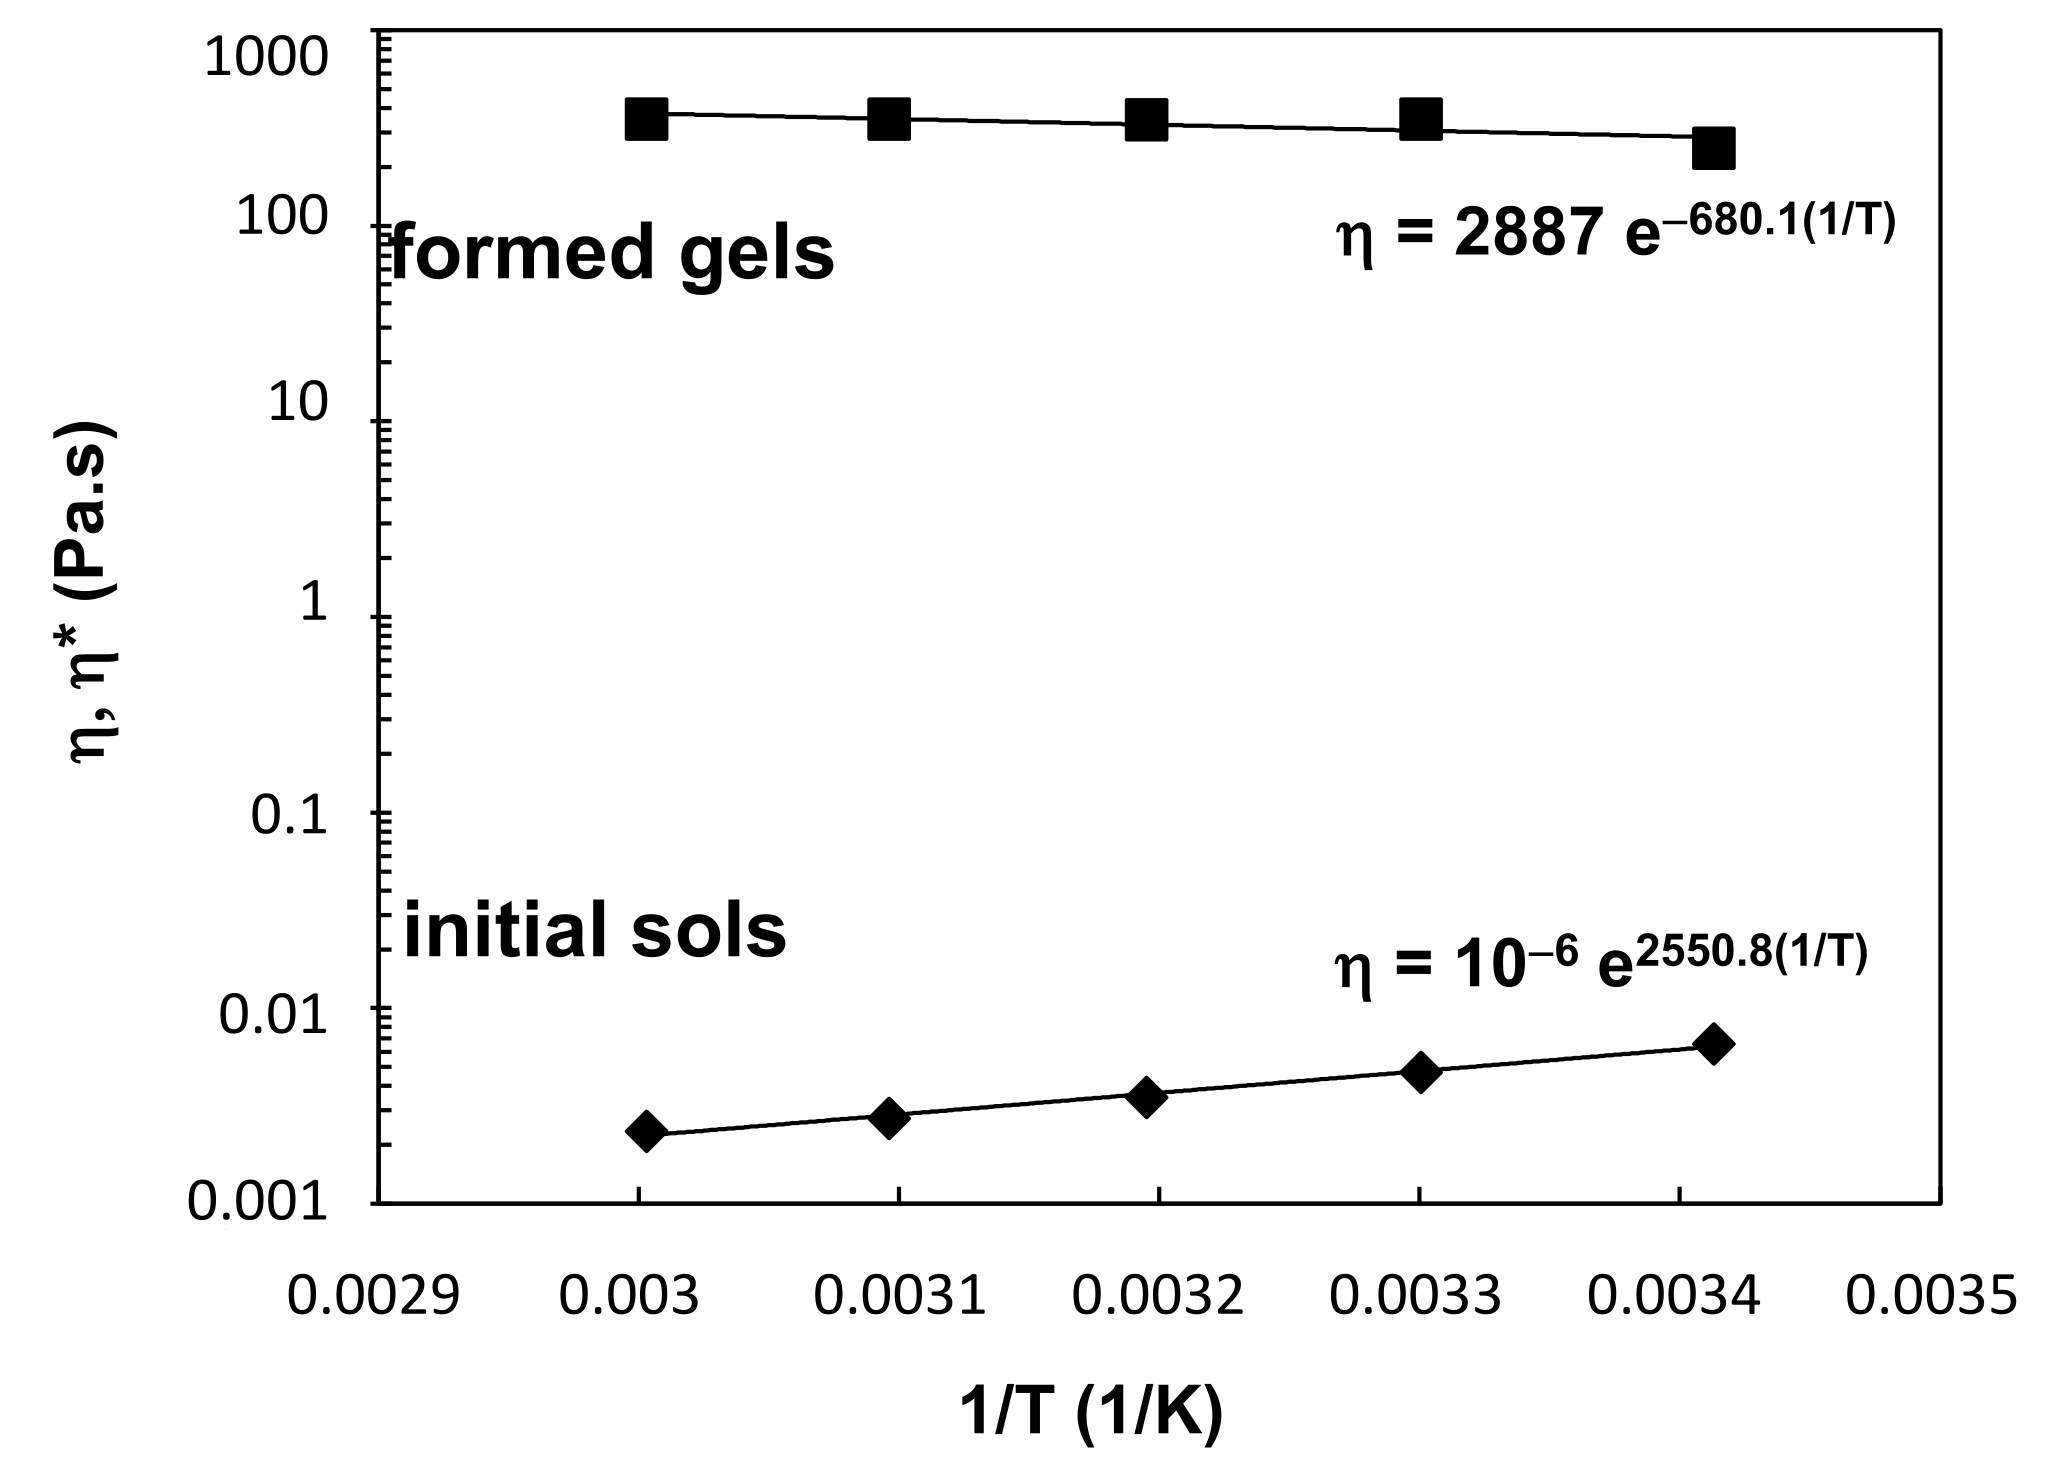
3.2. Viscosity of WO3 Sols

At all temperatures examined (20, 30, 40, 50 and 60 °C), the prepared WO3 sol exhibited Newtonian viscosity, which exponentially decreased with increasing temperature (Figure 6). However, after gelation process was finished, the viscosity of all gels, formed at different temperatures, was in the same range, regardless of the temperature at which the gelation took place. The formed gels exhibited similar complex viscosity with much higher values (η *~400 Pa.s) compared to the initial sols (η *~0.001–0.01 Pa.s) (Figure 6). This is well in agreement with the results of the IR analysis of the gels taken after the rheology study at different temperature (Figure 5). The dependencies of the viscosities on the temperature were for the initial sols as well as for the formed gels expressed by Arrhenius model:
η = η 0 e E R T
where T is temperature, η0 is a material constant, E is the activation energy and R is the universal gas constant [34].

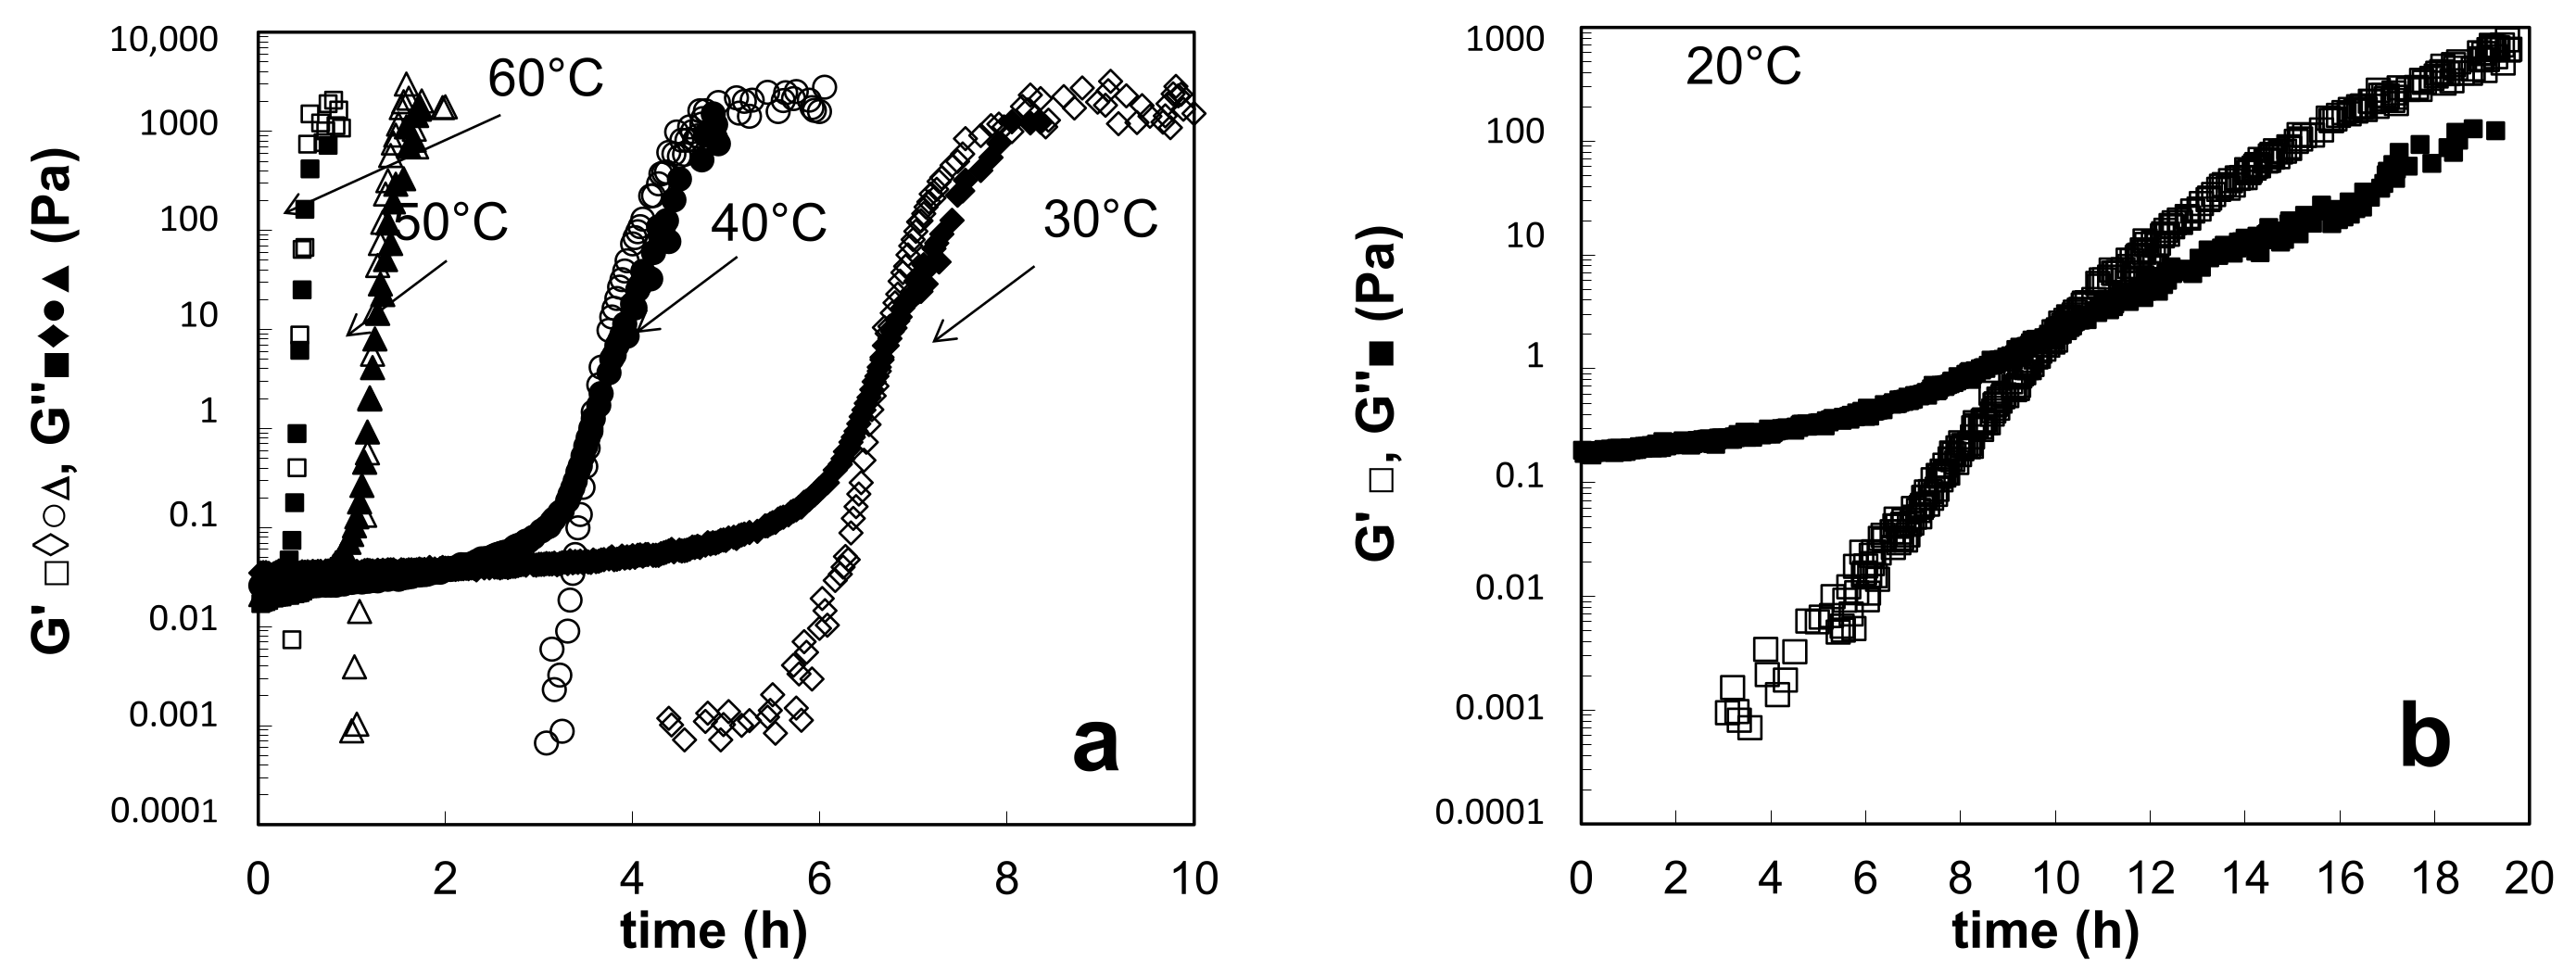
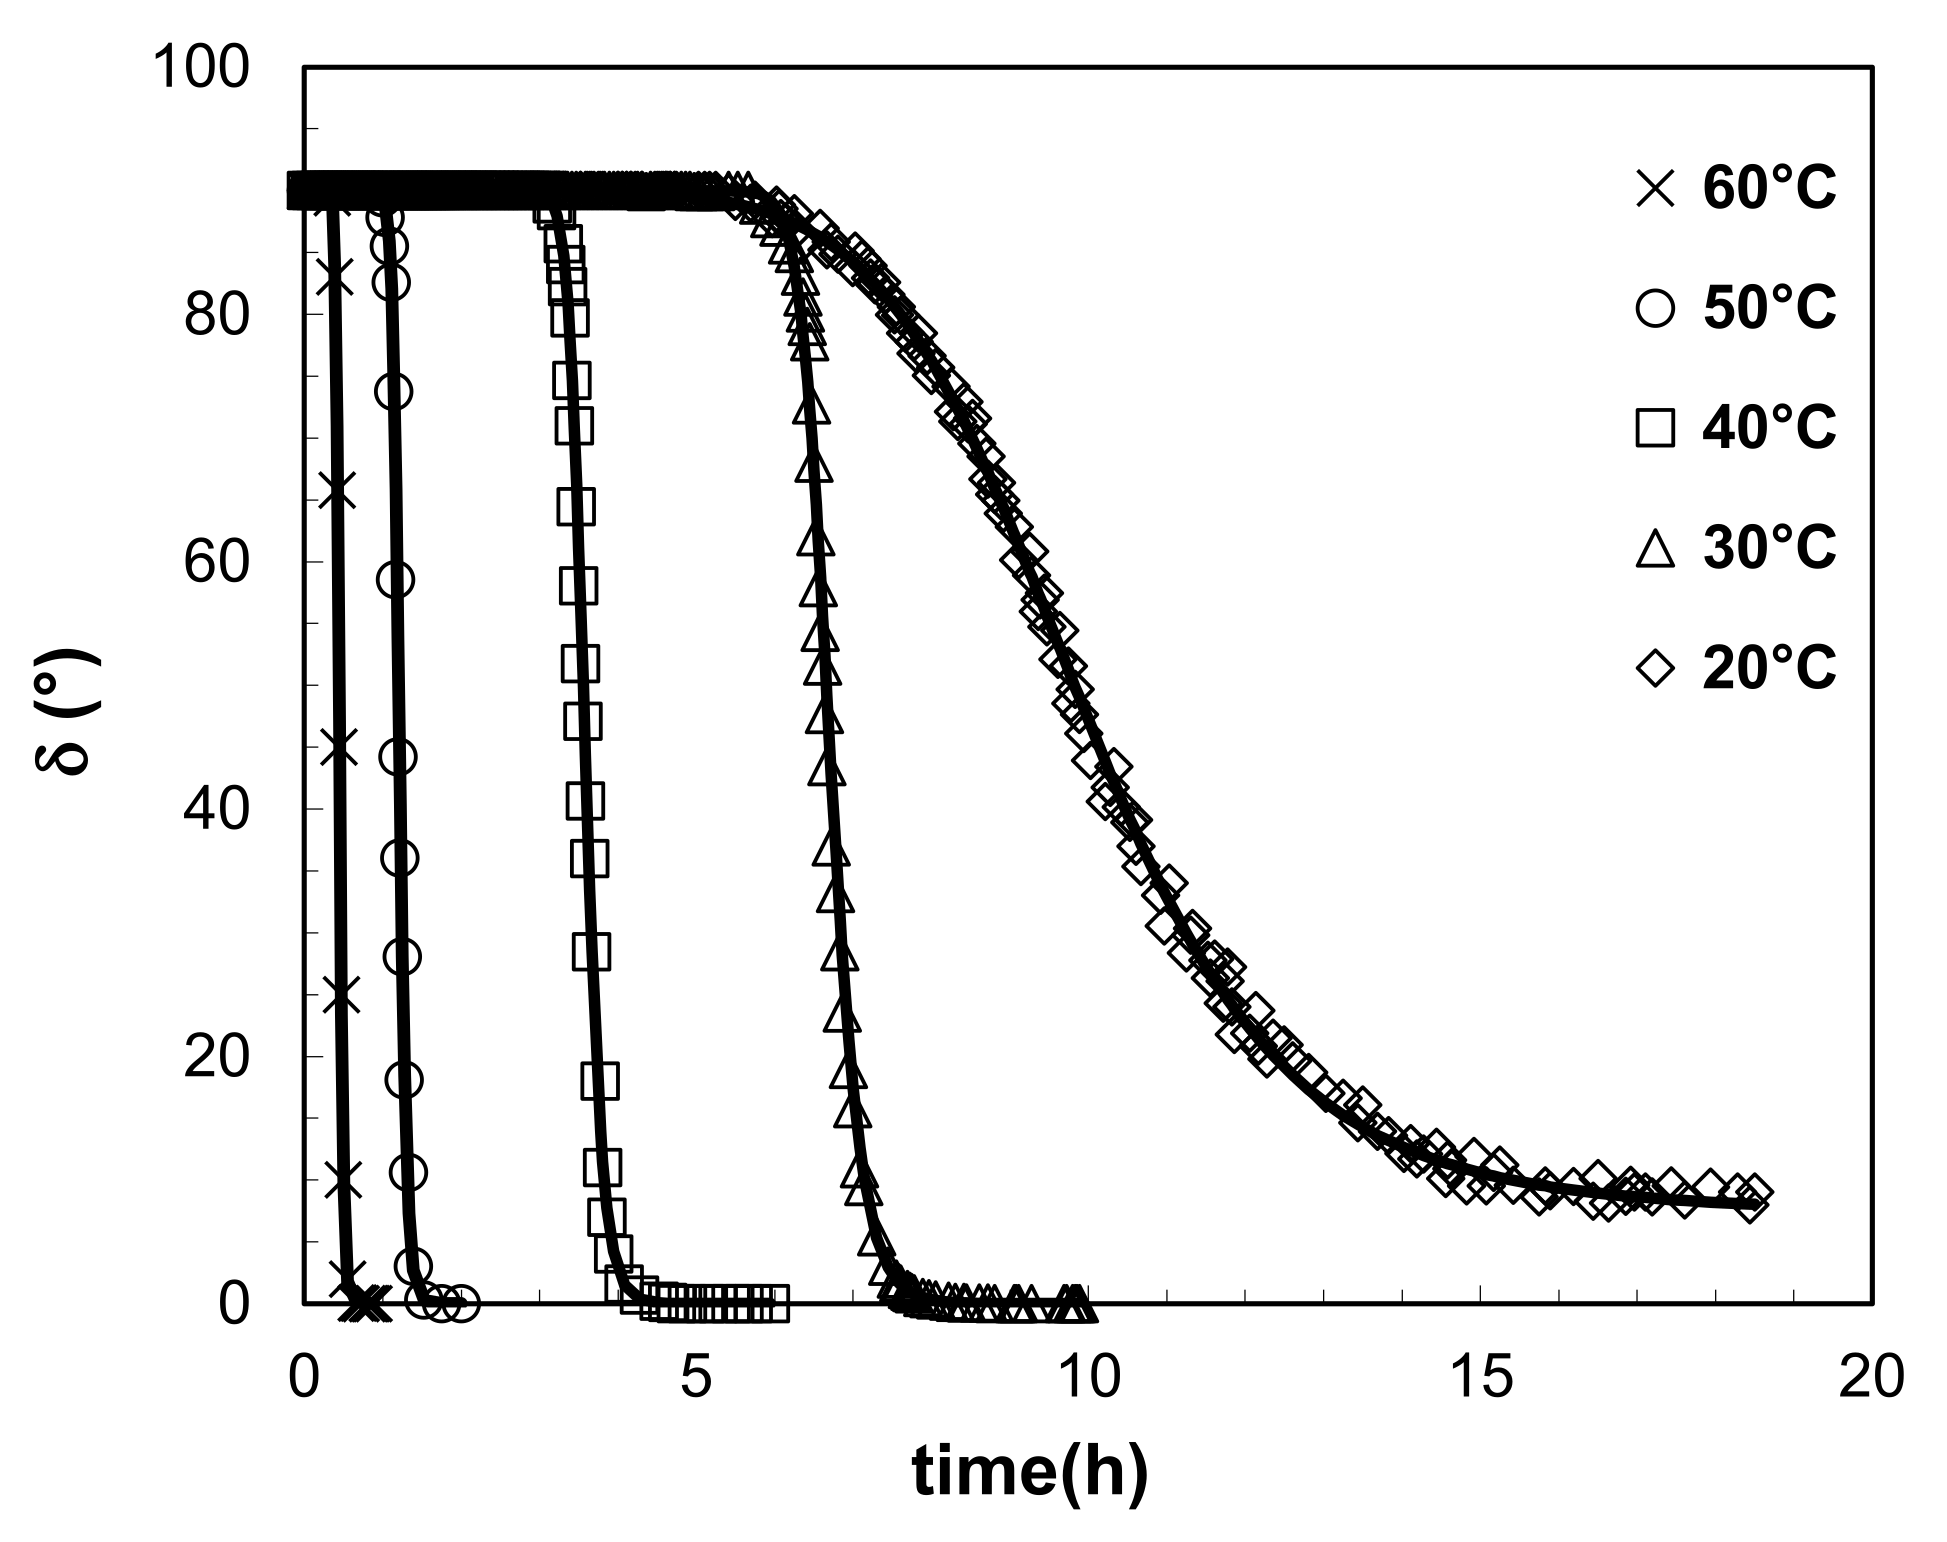
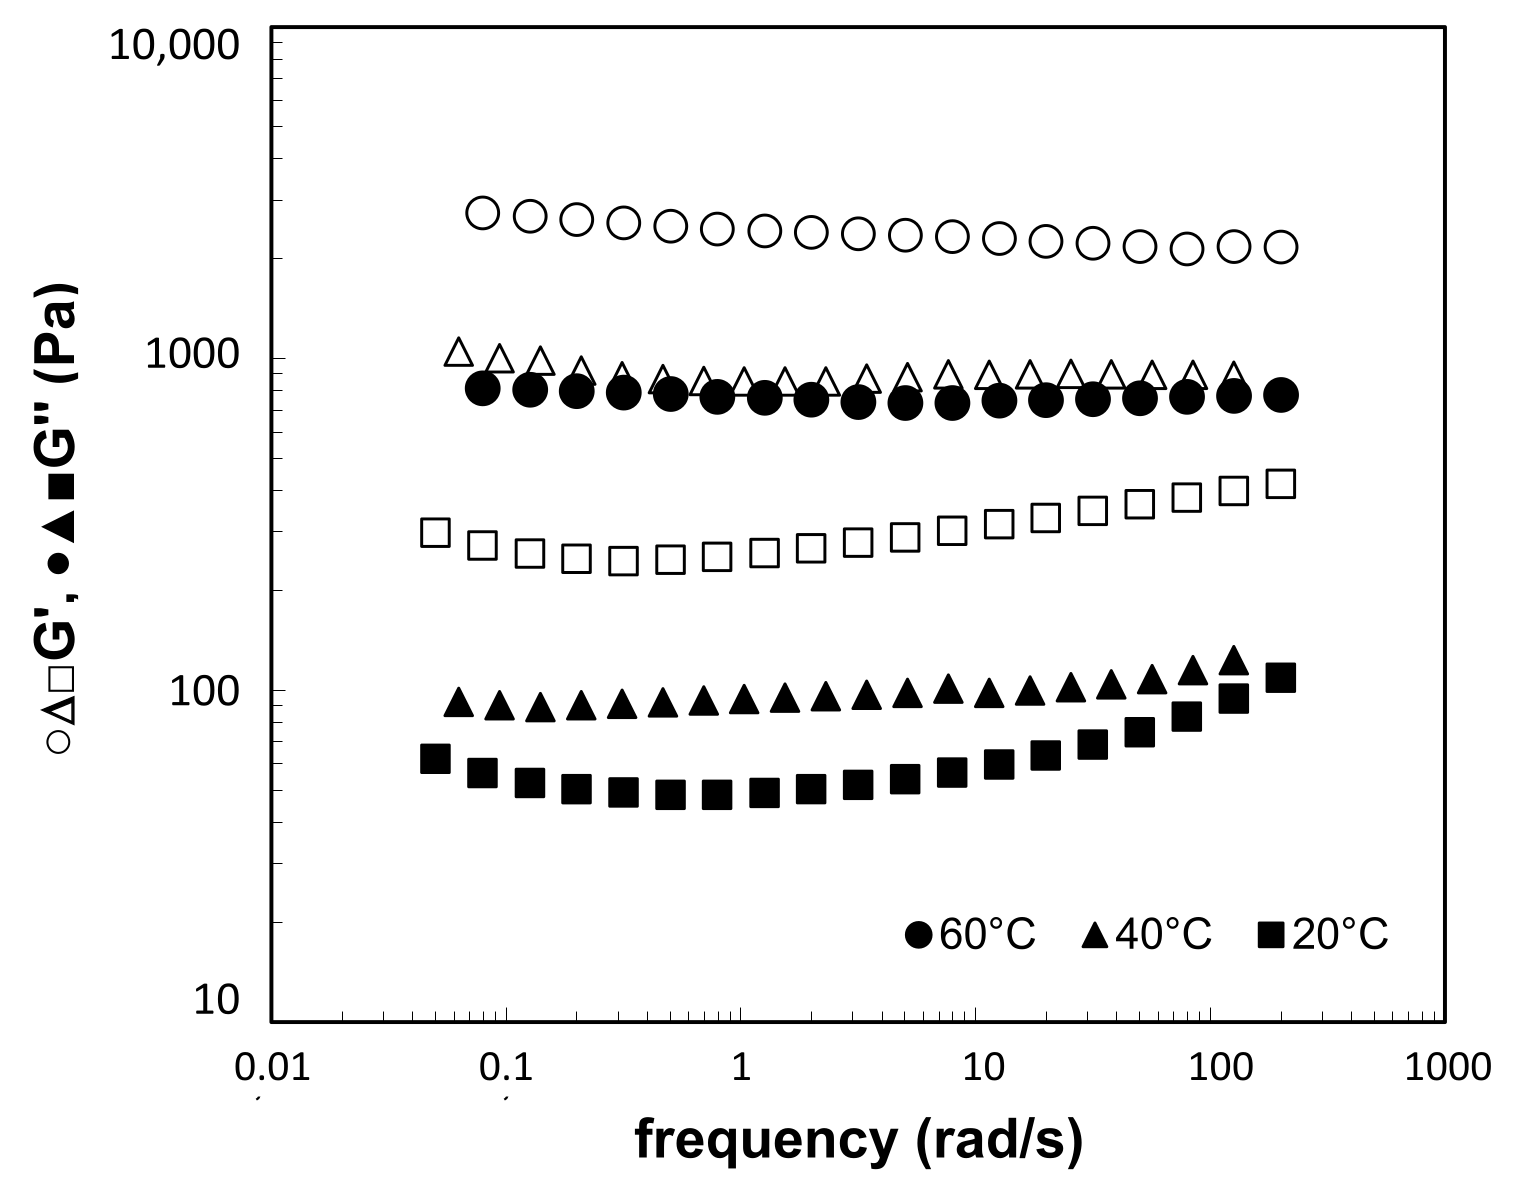
3.3. In Situ Rheological Characterization of WO3 Gelation Process

A detailed insight into the progress of the rheological properties of WO3 sols during gelation process was obtained with in situ oscillatory test in the linear viscoelastic range at deformation so small that no destruction of the structure could occur. For inkjet printing we used material deposit system—Dimatix Materials Printer DMP2800 [20]. It enables temperature modulation of printer vacuum plates (up to 60 °C) and cartridge temperature (up to 70 °C), which should be tailored for each material or ink. For inkjet printing of the sol-gel WO3 ink the most optimal temperature of printer plates was 35 °C, which warmed ink in cartridge up to 26 °C. Moreover, to predict stability of inkjet process we studied temperature dependence of the WO3 sol-gel characteristics. In situ oscillatory test in the linear viscoelastic range was used for 5 different temperatures: 20 °C, 30 °C, 40 °C, 50 °C and 60 °C, respectively. The progress of viscoelastic properties, i.e., elastic G′ and viscous modulus G″, during gelation process of WO3 sol was similar, especially for the temperatures from 30 °C to 60 °C (Figure 7a). Initial sols exhibited “liquid-like” behavior with low consistency and only viscous contribution G″ detected. As the gelation process started the loss modulus G″ commenced to increase continuously, while the storage modulus G′ suddenly appeared after a certain time and rose sharply until it intersected and exceeded the loss modulus G″. The time at which the both moduli reached the same value indicated the sol to gel transition point, which is often referred to as a “gel-point” [34]. From this point onward, the elastic behavior G′ dominated and the behavior of the sample became “solid-like”. Both moduli leveled off as the reaction came to completion; moreover, at the end of gelation the viscous modulus was too low to be detected. As a result, the formed gel became brittle without any viscous effects. The gels, formed at 30 °C to 60 °C exhibited similar values of G′ and G″ at the end of sol-gel process, while the gel, formed at 20 °C exhibited softer gel structure with lower values of G′ and G″; moreover, the values of G″ were not negligible. We can conclude that the gelation time depended strongly on the temperature, to which the sol was exposed. Higher temperature leaded to faster gelation process, i.e., for the sol, which was exposed to 60 °C (Figure 7a), the gel formed after ~0.55 h, while the transition from sol to gel at 20 °C was observed not earlier as after ~10 h (Figure 7b). The final values of G′ were for the gels, formed at temperatures from 30 °to 60 °C in the range of 3000 Pa, while G″ was negligible. On the other hand, the gel, formed at 20 °C exhibited the G′ below 1000 Pa, while the G″ was in the range of 100 Pa.
To evaluate different parameters, important for the sol-gel process, the experimental asymmetric dependences of phase shift angle δ on the time of gelation could be the best fitted with five-parameter logistic function [35]:
δ = δ 1 δ 1 δ 2 1 + t t g W s
where δ1 and δ2 are the highest (initial) and the lowest (the end) values of phase shift angle, respectively, tg is the time of sol-gel transition, while s jointly with W controls the rate of approach to the δ2 asymptote. The values of the five parameters, obtained by fitting the experimental data are presented in Table 1, while the experimental data of phase shift angle δ and calculated values obtained with the above equation are presented in Figure 8. The results show excellent agreement of the experimental data with the predicted values for all five temperatures, used in the presented study. The five-parameter logistic model enabled the exact determination of the time at which sol to gel transition occurs (tg) together with precise viscoelastic properties of formed gels (δmin). Moreover, the model can be used for accurate prediction of total rate and time of sol-gel process (W, s).
Gelation times (tg), determined from the Equation (1) are organized as a dependence of the temperature (Table 1), to which the initial sol was exposed. The dependence (Figure 9) is very good fitted with the exponential function, which shows that the time of gelation exponentially decreased with increasing temperature of the gelation process.

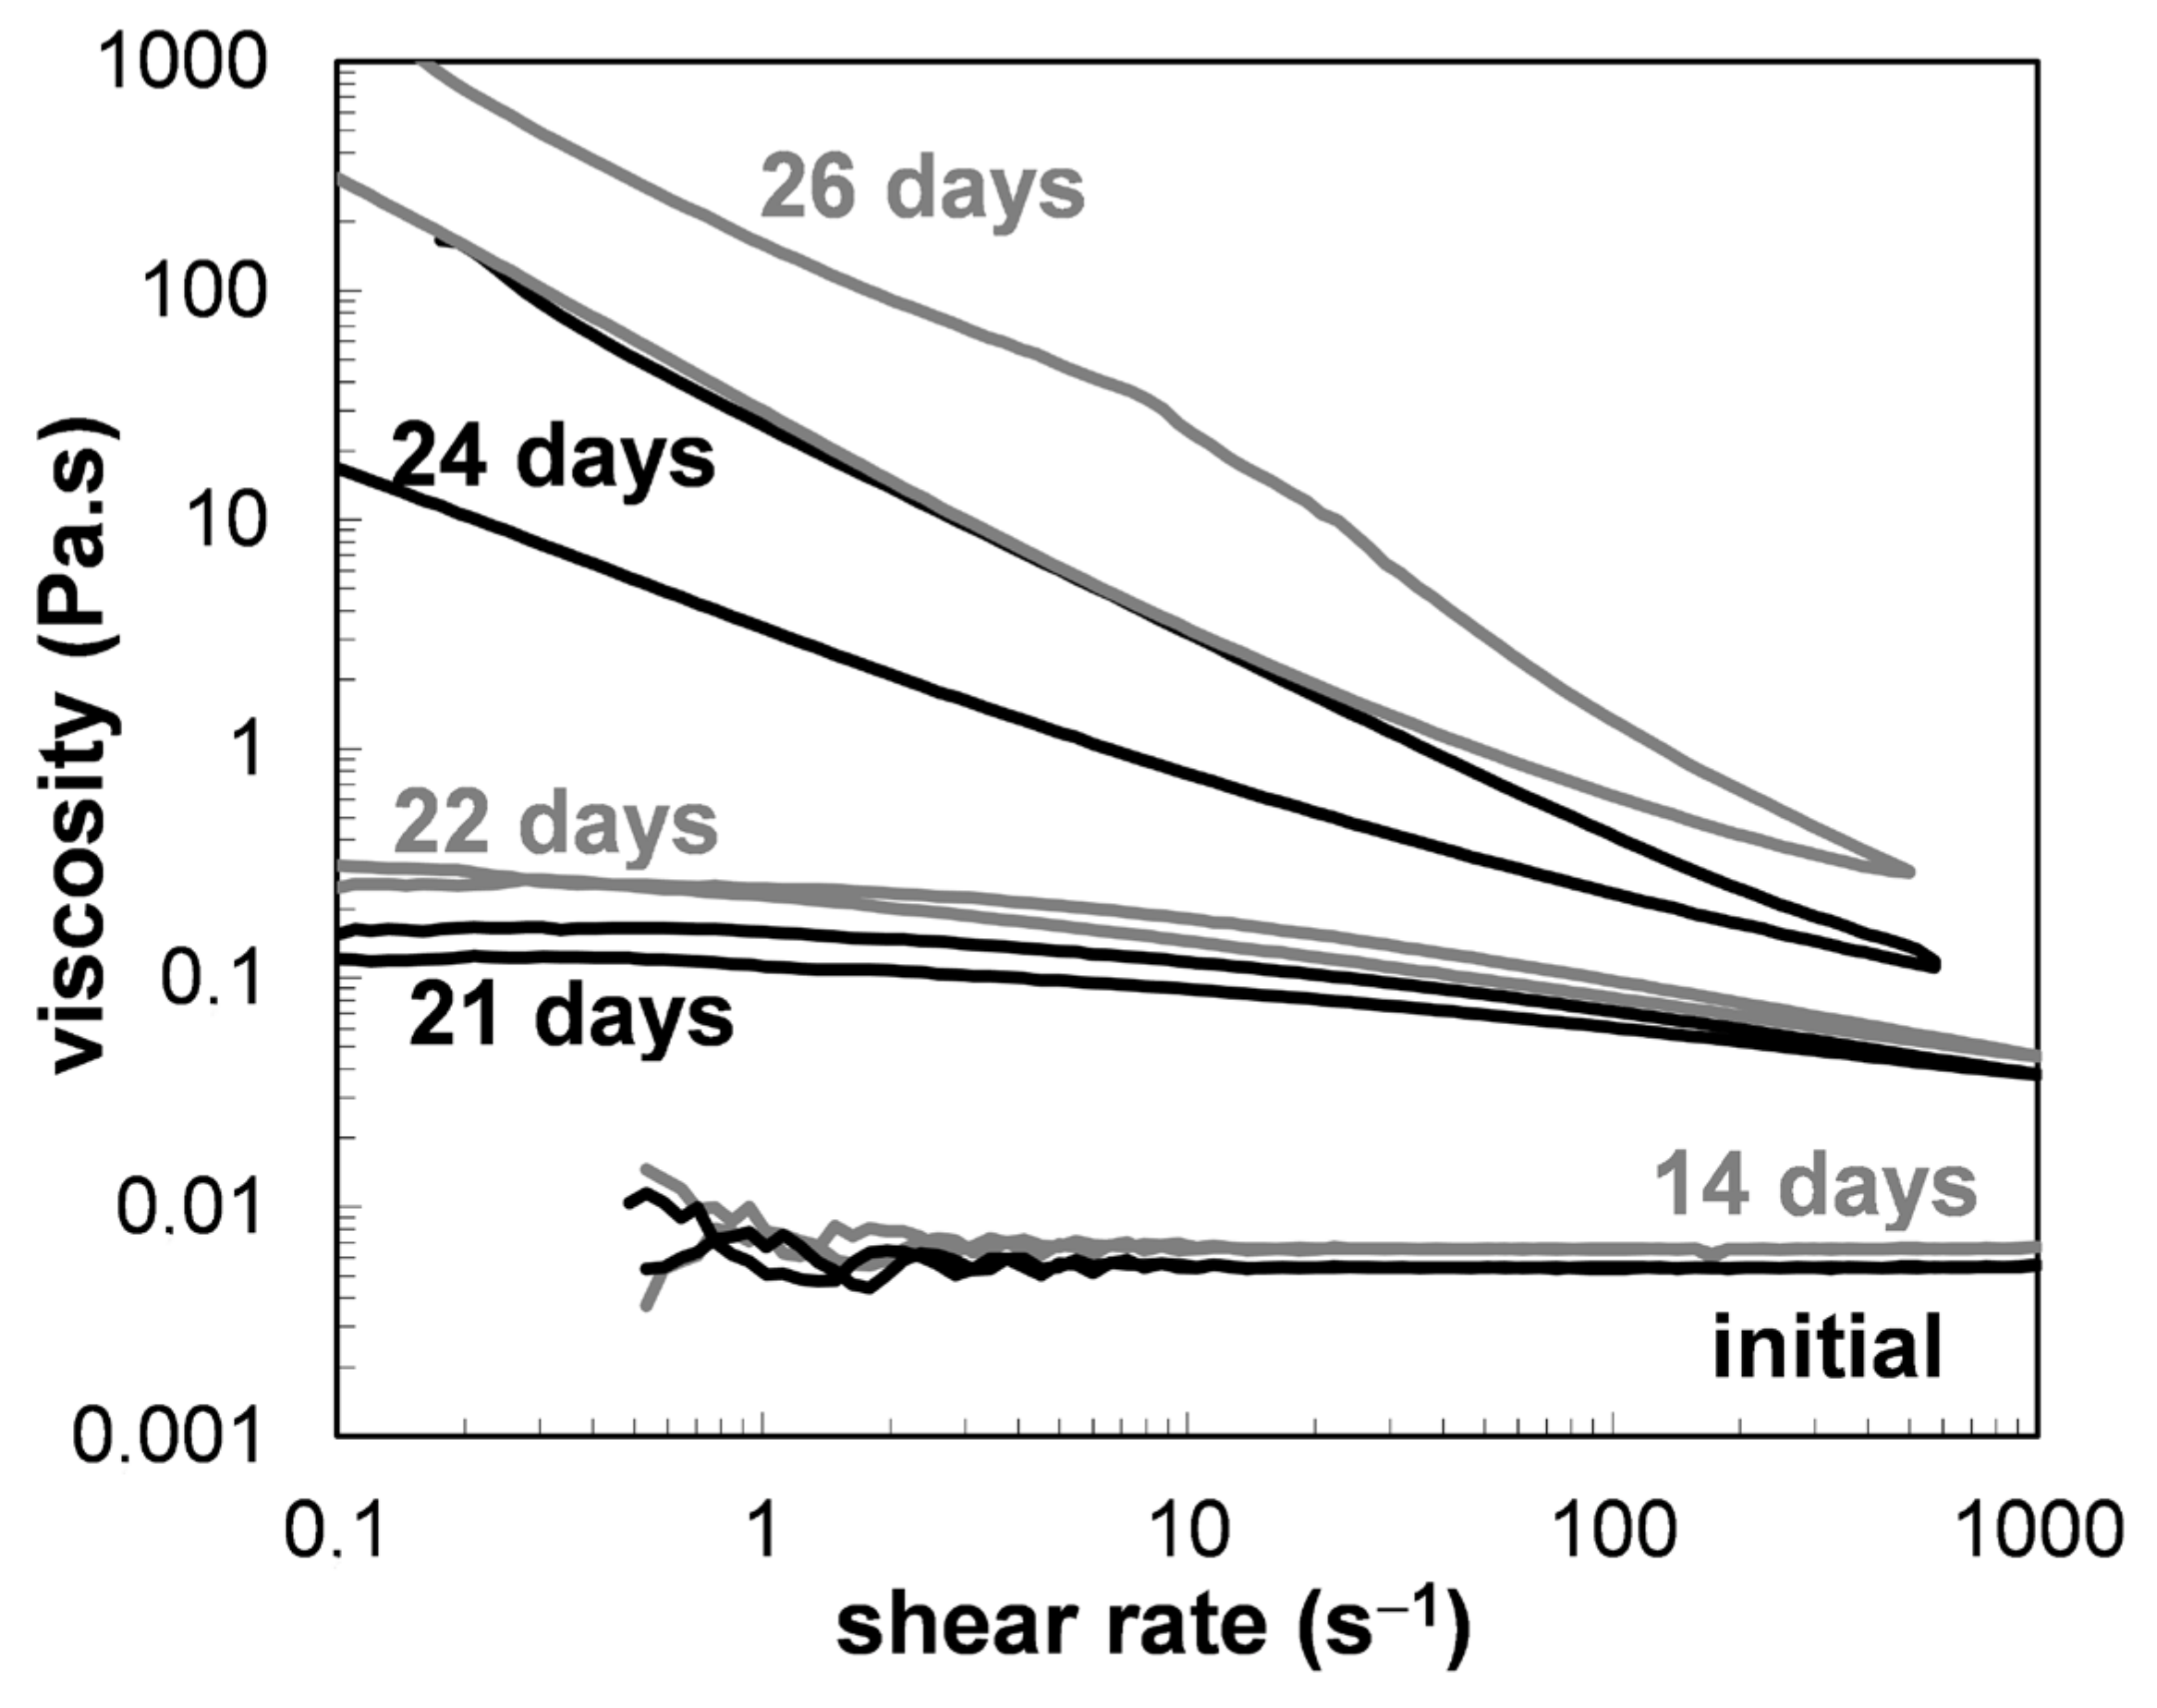
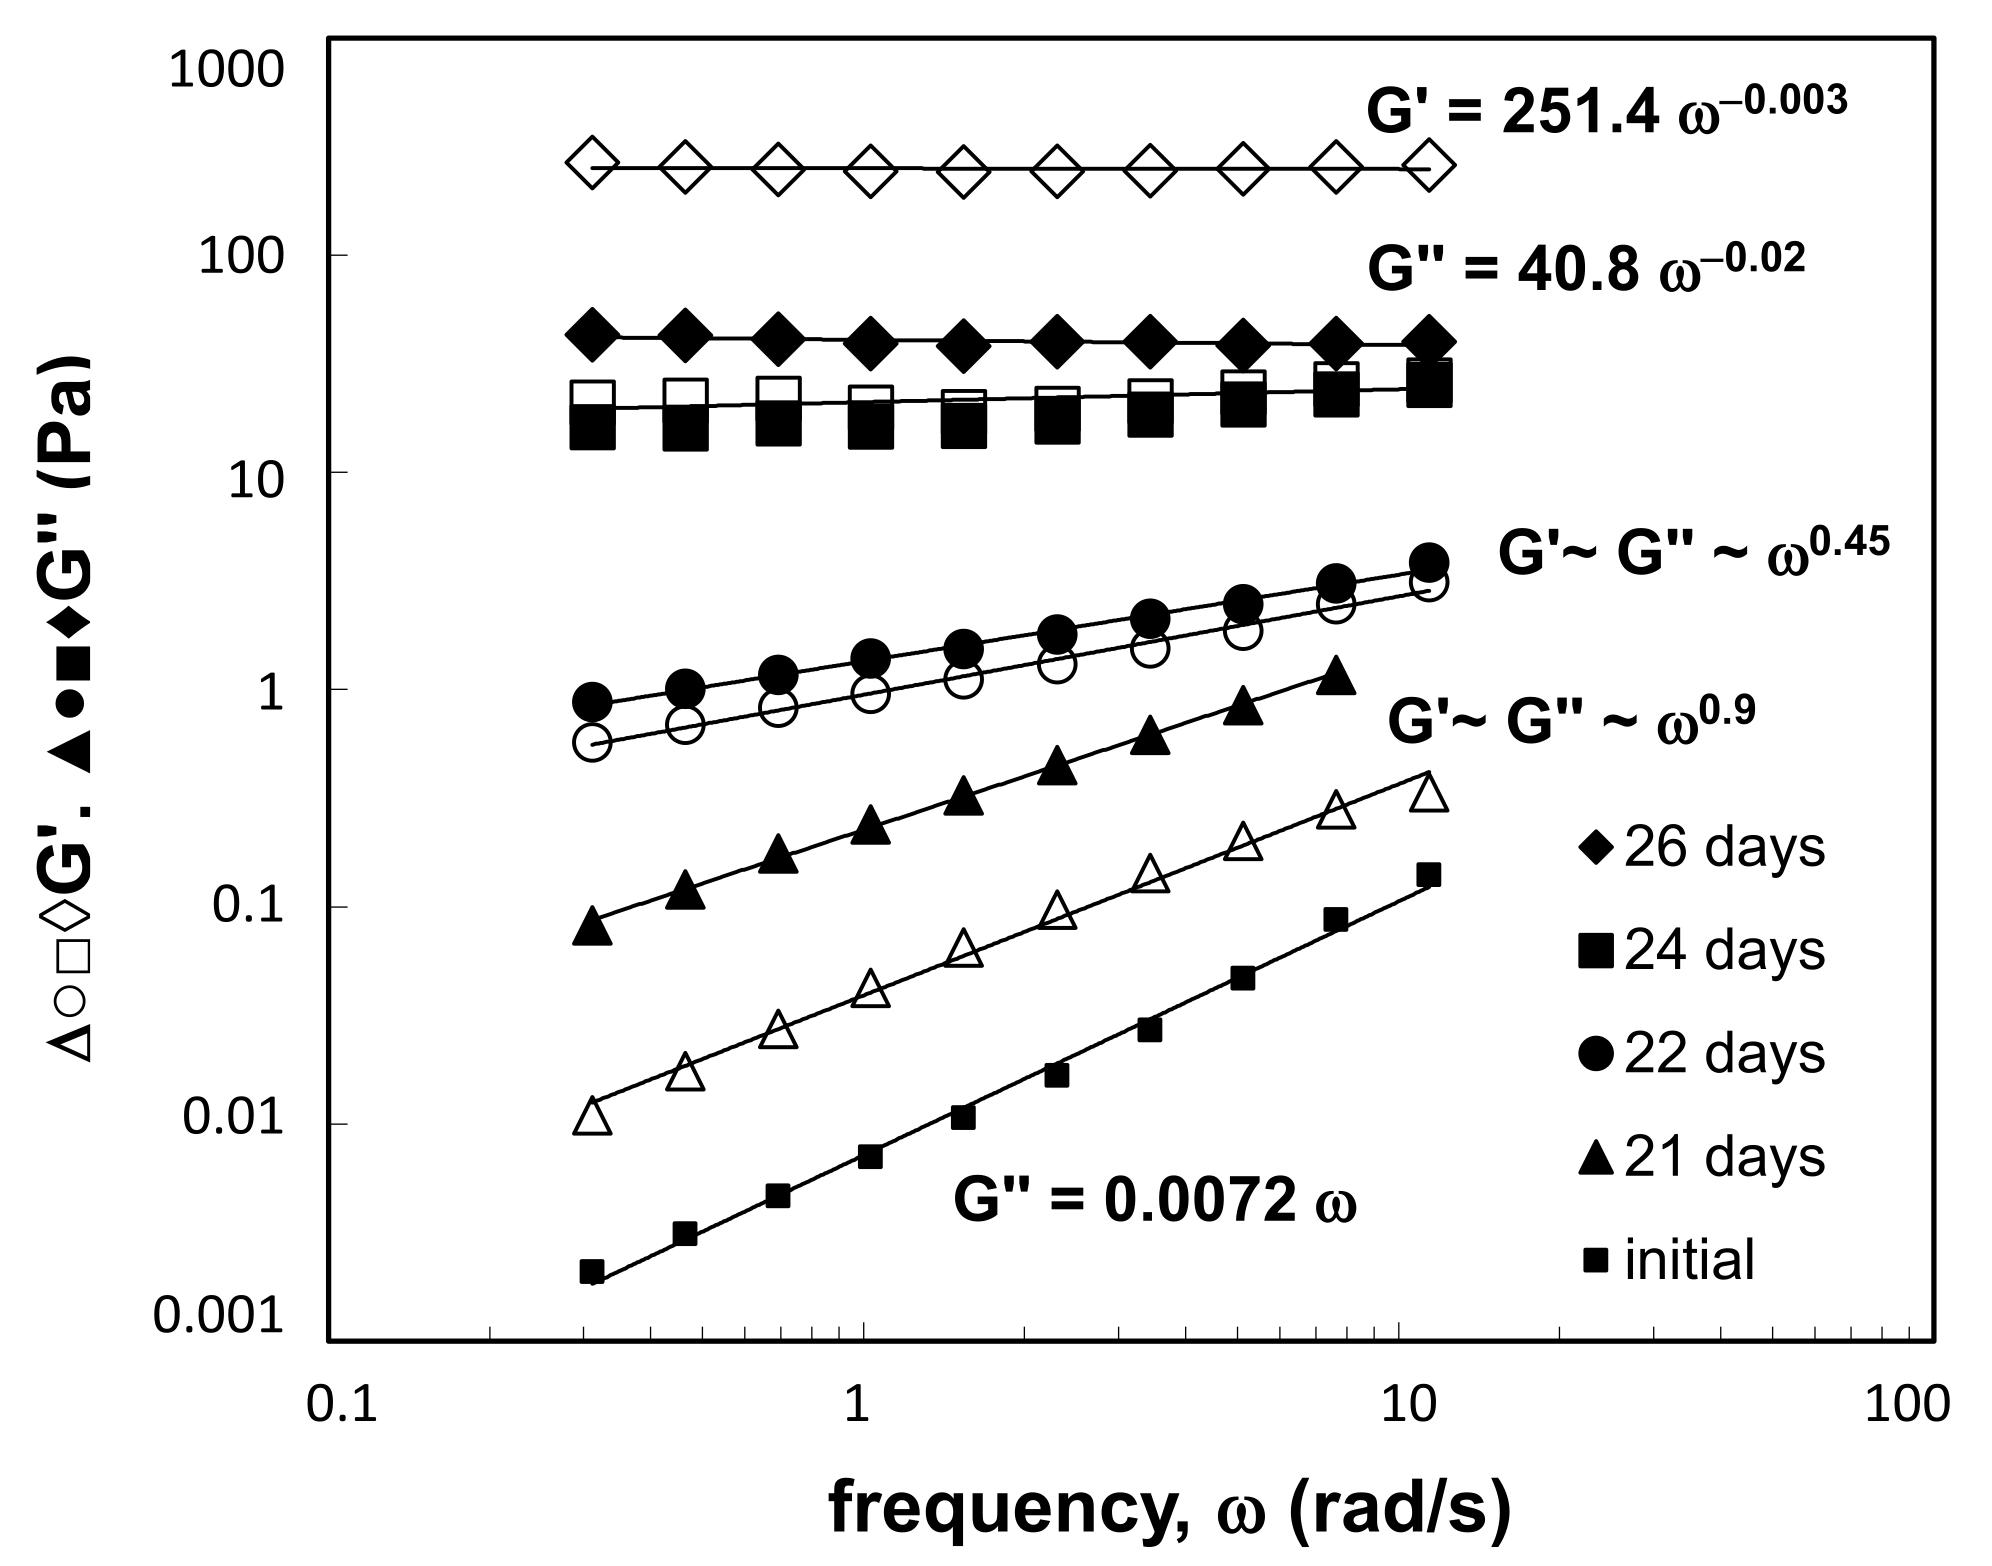
3.4. Ex-Situ Rheological Characterization of WO3 Gelation Process

In addition to the in-situ rheological characterization the ex-situ rheological tests were performed for the sol, exposed to the room temperature for several days. Moreover, we followed the sol stability, prepared with different solvents (ethanol, isopropanol and a mixture of isopropanol and 2-propoxy ethanol) stored in a 100 mL glass bottle in the refrigerator. Our observation was that sol-gel transition occurs in 22 days, when using the mixture of isopropanol and 2-propoxy ethanol, 6 months, when using isopropanol and 10 months when using ethanol. It should be noted here that the transition from sol to gel in the bulk of the beaker (sample volume ~100 mL) occurred much later compared to the transition, which occurred in the sensor system of the rheometer and inkjet cartridge content, where the whole volume of the sample was considerably lower (cca 1.6 mL). The stability of the sols could be significantly prolonged by keeping the inks at lower temperature, for example when kept in freezer (below −15 °C) the sols remain stable over 1 year.
In the ex-situ characterization various rheological tests were performed under destructive and non-destructive shear conditions. First, the flow behavior was followed with flow tests under destructive shear conditions (Figure 10). One day after the sol preparation, the sol (Figure 10, initial) exhibited Newtonian flow behavior with constant viscosity of 0.0054 Pa.s (at T = 23 °C). 14 days after the preparation the sol maintained the Newtonian character, while the value of the viscosity slightly increased to 0.0065 Pa.s (at T = 23 °C). Higher increase of the viscosity and the first deviation from Newtonian flow behavior was observed on the 21st day after the preparation. The next day (22nd day) the viscosity again slightly increased with similar flow behavior, while 24th day after the preparation the flow behavior of the solution significantly changed to pronounced shear thinning flow behavior, where the viscosity decreased for almost three decades as the shear rate increased from 0.1 to 1000 s−1. A constant decreasing of the viscosity curve from the low to the high shear rates indicates that these solutions showed some structure stability at rest [34], while hysteresis loop during the decreasing of the shear rate towards initial value (0.1 s−1) indicates time-dependent flow properties during structure recovery.
The rheological properties of WO3 sols were, at different times during the gelation process, followed also with non-destructive oscillation tests in the range of linear viscoelastic response (Figure 11). At the beginning, immediately after the preparation, the sol exhibited Newtonian flow behavior as only viscous contribution G″ was present, which linearly increased with the frequency of oscillation. As it was observed during flow tests, at 21st day some changes were observed also with frequency tests. Newtonian character of the sol changes to viscoelastic liquid as the dynamic storage modulus G′ occurred with lower values compared to the loss modulus G″; moreover, the moduli exhibited similar, linear dependences with frequency of oscillation. The next day (22nd day) the values of the moduli increased and their dependences on the frequency changed. The G′ equaled G″, and both moduli depended on the frequency of oscillation by the order of 0.45. Such behavior is characteristic for weak gels, which resemble the strong gels in their mechanical behavior, particularly at low frequencies, but as the deformation increases, their networks undergo a progressive breakdown into smaller clusters. As a consequence, the system can flow with flow properties typical of a disperse system [36]. Gel was formed after 26 days, when the sample exhibited “solid-like” behavior with much higher values of storage modulus G′ compared to the loss modulus G″; moreover, the moduli were frequency independent, i.e., G′~G″~ω0. Such behavior is characteristic for strong gels [37], which are usually, due to lack of viscous contribution, also very hard and brittle. Under the conditions of small deformation, strong gels manifest the typical behavior of viscoelastic solids and, above a critical deformation value, they rupture rather than flow [37]. At other temperatures examined, the sol to gel transition was similar to the one, explained in Figure 11; except that the time of gelation process was shorter.
For chemical, i.e., covalently cross-linked gels formed in our study, linear viscoelastic behavior has been extensively investigated in the vicinity of the sol-gel transition point. Winter and Chambon [38,39] showed that at critical gel point dynamic moduli follow a simple power law: G′ (ω) ≈ G″ (ω)~ωn, where n depends on the particular gelation mechanism. In our work, the transition from sol to gel was observed for the sol at 23 °C (Figure 11), where after 22 days the G′ and G″ depended on the frequency by the order of 0.5 (G′~G″~ω0.5).
At the end of gelation process the initial Newtonian structure of the sol changed to solid-like gel at all temperatures examined. The formed gels were examined with oscillatory tests in linear viscoelastic range to evaluate the influence of the temperature on the structure of formed gels. For the sake of clarity only gels, formed at temperatures 60 °C, 40 °C and 20 °C, respectively, are presented in Figure 12. The results indicate that all formed gels exhibited similar dependences of G′ and G″ on the frequency of oscillation. The differences in the structure can be observed regarding consistency of the gels. Higher temperature of the gelation process led to faster gelation process and higher consistency of formed gel. Thus, the gel, formed at the highest temperature exhibited the highest consistency with the most “solid-like” structure, while the gel, formed at 20 °C, exhibited softer gel structure with lower consistency.

4. Conclusions

The IR analysis of the WO3 sols showed the difference of the cross-linking of the peroxopolytungstic acid (P-PTA) clusters for the sols based on different alcohols. The most pronounced cross-linking of the tungsten polyhedral is found for the ethanol, followed by the 2-propanol based sol. In the WO3 sol based on 2-propoxy ethanol the cross-linking of the P-PTA is hindered which is demonstrated by the strong presence of terminal W = O bonds and the peroxo groups in the IR spectra of the corresponding sol. The drying of the 2-propoxy ethanol based WO3 sol at room temperature was not complete as is the case for ethanol and 2-propanol. The slower evaporation could have slowed down the gelation process, but the rheological studies show that the gelation was even faster in case of the WO3 sol prepared by 2-propoxy-ethanol. The reason for the faster gelation can be attributed to a different way of cross-linking of the tungsten polyhedra through corners and edges when different alcohols are used. The IR spectra analysis of the gels shows that the WO3 gel based on 2-propoxy ethanol has the solvent kept in the gel structure, the structure of the P-PTA clusters is to some extent preserved and the cross-linking of the tungsten polyhedra is not complete which results in a weaker and softer WO3 gel compared to the gels formed from the ethanol and 2-propanol tungsten sols.
The IR analysis of the 2-propoxy ethanol WO3 gels performed after the gelation of the WO3 sol in a rheometer at 20 °C, 30 °C, 40 °C, 50 °C and 60 °C showed no significant difference on the chemical structure of the WO3 gel which is well in accordance with the rheological studies confirming similar progress of viscoelastic properties, i.e., elastic G′ and viscous modulus G″, during gelation process of WO3 sol. Initial sols exhibit “liquid-like” behavior with low consistency and only viscous contribution G″ while during gelation process the elastic modulus G′ suddenly appeared after a certain time and rise sharply until it intersected and exceeded the loss modulus G″. The gelation time decreases exponentially with the temperature, the gelation of the sol exposed to 60 °C was completed in 0.55 h, while the transition from sol to gel at 20 °C was observed not earlier as after ~10 h. To evaluate the parameters, important for the sol-gel process, the experimental asymmetric dependences of phase shift angle δ on the time of gelation were fitted with five-parameter logistic function [35]. The results show excellent agreement of the experimental data with the predicted values for all five temperatures which enabled the exact determination of the time at which sol to gel transition occurred (tg), the precise viscoelastic properties of formed gels (δmin) and the accurate prediction of total rate and time of sol-gel process (W, s).
The ex-situ rheological characterization of WO3 sols prepared with different alcohols was performed to study the stability of the sol during ageing at RT. The results show that the fastest gelation for the 2-propoxy ethanol-based sol (22 days), while the 2-propanol and ethanol remain stable up to 6 and 10 months, respectively. The fresh sol (1 day after preparation) exhibited Newtonian flow behavior with constant viscosity of 0.0054 Pa.s, after 14 days the sol maintained the Newtonian character, while the viscosity slightly increased to 0.0065 Pa.s. The first deviation from Newtonian flow behavior was observed on the 21st day after the preparation. On the 22nd day the G′ equaled G″, and both moduli depend on the frequency of oscillation by the order of 0.45 which is characteristic for weak gels. Gel was formed after 26 days, when the sample exhibited “solid-like” behavior with much higher values of storage modulus G′ compared to the loss modulus G″; moreover, the moduli were frequency independent, i.e., G′~G″~ω0. Such behavior is characteristic for strong gels [37], which are usually, due to lack of viscous contribution, also very hard and brittle.
In overall the results of this study confirmed that in-depth rheological characterization linked with the IR spectroscopy of the sol-gel inks could provide the information on the stability of the sol and a better insight on how the temperature influences the gelation time. It provides the information on the temperature and the time window at which the continuous inkjet printing of the sol-gel inks could be performed without clogging. The WO3 ink was stable in a beaker and have Newtonian flow behavior at room temperature over 3 weeks, while the gelation time decreases exponentially with the temperature down to 0.55 h at 60 °C.

Author Contributions

Conceptualization, U.O.K. and L.S.P.; methodology, T.V. and M.K.G.; formal analysis, U.O.K., L.S.P., T.V., R.C.K. and M.K.G.; investigation, U.O.K., L.S.P., T.V., R.C.K. and M.K.G.; writing—original draft preparation, U.O.K. and L.S.P.; writing—review and editing, U.O.K., L.S.P., T.V., R.C.K. and M.K.G.; supervision, L.S.P.; project administration, L.S.P. All authors have read and agreed to the published version of the manuscript.

Funding

The authors acknowledge the financial support from the Slovenian Research Agency (research core funding No. P2-0264, P2-0244 and P2-0393).

Institutional Review Board Statement

Not applicable.

Informed Consent Statement

Not applicable.

Data Availability Statement

The data presented in this study are available on request from the corresponding author.

Conflicts of Interest

The authors declare no conflict of interest. The funders had no role in the design of the study; in the collection, analyses, or interpretation of data; in the writing of the manuscript, or in the decision to publish the results.

References

  1. Naito, M.; Yokoyama, T.; Hosokawa, K.; Nogi, K. Nanoparticle Technology Handbook, 3rd ed.; Elsevier: Amsterdam, The Netherlands, 2018. [Google Scholar]
  2. Deb, S.K. Opportunities and challenges in science and technology of WO3 for electrochromic and related applications. Sol. Energ. Mat. Sol. Cells 2008, 92, 245–258. [Google Scholar] [CrossRef]
  3. Monk, P.; Mortimer, R.; Rosseinsky, D. Electrochromism and Electrochromic Devices; Cambridge: New York, NY, USA, 2007; pp. 139–151. [Google Scholar]
  4. Zhang, M.; Yang, C.; Zhang, Z.; Tian, W.; Hui, B.; Zhang, J.; Zhang, K. Tungsten oxide polymorphs and their multifunctional applications. Adv. Colloid Interface Sci. 2022, 300, 102596. [Google Scholar] [CrossRef] [PubMed]
  5. Cezarina, C.M.; Hassel, A.W. Review on the versatility of tungsten oxide coatings. Phys. Status Solidi A 2019, 216, 1–16. [Google Scholar]
  6. Klanjšek Gunde, M.; Opara Krašovec, U.; Platzer, W. Color rendering properties of interior lighting influenced by a switchable window. J. Opt. Soc. Am. A 2005, 22, 416–423. [Google Scholar] [CrossRef] [PubMed]
  7. Opara Krašovec, U.; Šurca Vuk, A.; Orel, B. Comparative studies of all sol–gel electrochromic windows employing various counter-electrodes. Sol. Energy Mater. Sol. Cells 2002, 73, 21–37. [Google Scholar] [CrossRef]
  8. Cremonesi, A.; Bersani, D.; Lottici, P.P.; Djaoued, Y.; Ashrit, P.V. WO3 thin films by sol–gel for electrochromic applications. J. Non-Cryst. Solids 2004, 45&346, 500–504. [Google Scholar] [CrossRef]
  9. Hauch, A.G.; Opara Krašovec, U.; Orel, B. Comparison of photoelectrochromic devices with different layer configurations. J. Electrochem. Soc. 2002, 149, H159–H163. [Google Scholar] [CrossRef]
  10. Opara Krašovec, U.; Georg, A.; Georg, A.; Wittwer, V.; Luther, J.; Topič, M. Performance of a solid-state photoelectrochromic device. Sol. Energy Mater. Sol. Cells 2004, 84, 369–380. [Google Scholar] [CrossRef]
  11. Hočevar, M.; Opara Krašovec, U. A photochromic single glass pane. Sol. Energy Mater. Sol. Cells 2018, 186, 111–114. [Google Scholar] [CrossRef]
  12. Hočevar, M.; Opara Krašovec, U. Cubic WO3 stabilized by inclusion of Ti: Applicable in photochromic glazing. Sol. Energy Mater. Sol. Cells 2016, 154, 57–641. [Google Scholar] [CrossRef]
  13. Dao, T.T.; Park, S.; Hong, S.; Sarwar, S.; Van Tran, H.; Lee, S.I.; Park, H.S.; Song, S.H.; Nguyen, H.D.; Lee, K.-K.; et al. Novel flexible photochromic device with unprecedented fast-bleaching kinetic via platinum decoration on WO3 layer. Sol. Energy Mater. Sol. Cells 2021, 231, 111316. [Google Scholar] [CrossRef]
  14. Opara Krašovec, U.; Orel, B.; Georg, A.; Wittwer, V. The gasochromic properties of sol-gel WO3 films with sputtered Pt catalyst. Sol. Energy 2000, 68, 541–551. [Google Scholar] [CrossRef]
  15. Vidmar, T.; Topič, M.; Dzik, P.; Opara Krašovec, U. Inkjet printing of sol-gel derived tungsten oxide inks. Sol. Energ. Mater. Sol. Cells 2014, 125, 87–95. [Google Scholar] [CrossRef]
  16. Brinker, J.C.; Scherer, G.W. Sol-Gel Science: The Physics and Chemistry of Sol–Gel Processing; Academic Press: Cambridge, MA, USA, 1999. [Google Scholar] [CrossRef]
  17. Cui, Z. Printed Eletronics: Materials, Technologies and Applications; John Wiley and Sons: Hoboken, NJ, USA, 2016. [Google Scholar]
  18. Zapka, W. Handook of Industrial Inkjet Printing: A Full System Approach; John Willey and Sons: Hoboken, NJ, USA, 2017. [Google Scholar]
  19. Yang, P.; Jin Fan, H. Inkjet and extrusion printing for electrochemical energy storage: A mini review. Adv. Mater. Technol. 2020, 5, 2000217. [Google Scholar] [CrossRef]
  20. Dimatix. Materials Printer DMP-2800 Series: User Manual; Doc. # PM000040 Rev. 05; FUJIFILM Dimatix, Inc.: Tokyo, Japan, 2010. [Google Scholar]
  21. Atkinson, A.; Doorbar, J.; Hudd, A.; Segal, D.L.; White, P.J. Continuous ink-jet printing using sol-gel “Ceramic” inks. JSST 1 1997, 8, 1093–1097. [Google Scholar] [CrossRef]
  22. Liu, X.; Tarn, T.J.; Huang, F.; Fan, J. Recent advances in inkjet printing synthesis of functional metal oxides. Particuology 2015, 19, 1–13. [Google Scholar] [CrossRef]
  23. Žitňan, M.; Müller, L.; Zub, K.; Schubert, U.S.; Galusek, D.; Wondraczek, L. Low-cost inkjet printing of thin-film mullite structures. Int. J. Appl. Glass Sci. 2022, 13, 135–142. [Google Scholar] [CrossRef]
  24. Homola, T.; Ďurašová, Z.; Shekargoftar, M.; Souček, P.; Dzik, P. Optimization of TiO2 mesoporous photoanodes prepared by inkjet printing and low-temperature plasma processing. Plasma Chem. Plasma Process. 2020, 40, 1311–1330. [Google Scholar] [CrossRef]
  25. Kassem, O.; Saadaoui, M.; Rieu, M.; Sao-Joao, S.; Viricelle, J.-P. Synthesis and inkjet printing of sol–gel derived tin oxide ink for flexible gas sensing application. J. Mater. Sci. 2018, 53, 12750–12761. [Google Scholar] [CrossRef]
  26. Karimi-Nazarabad, M.; Goharshadi, E.K.; Entezari, M.H. Rheological properties of the nanofluids of tungsten oxide nanoparticles in ethylene glycol and glycerol. Microfluid. Nanofluid. 2015, 19, 1191–1202. [Google Scholar] [CrossRef]
  27. Tripkovic, D.; Vukmirovic, J.; Bajac, B.; Samardzic, N.; Djurdjic, E.; Stojanovic, G.; Srdica, V.V. Inkjet patterning of in situ sol–gel derived barium titanate thin films. Ceram. Int. 2016, 42, 1840–1846. [Google Scholar] [CrossRef]
  28. Duoss, E.B.; Twardowski, M.; Lewis, J.A. Sol-gel inks for direct-write assembly of functional oxides. Adv. Mater. 2007, 19, 3485–3489. [Google Scholar] [CrossRef]
  29. Nanba, T.; Takano, S.; Yasui, I.; Kudo, T. Structural study of peroxopolytungstic acid prepared from metallic tungsten and hydrogen peroxide. J. Solid State Chem. 1991, 90, 47–53. [Google Scholar] [CrossRef]
  30. Daniel, M.F.; Desbat, B.; Lassegues, J.C.; Gerand, B.; Figlartz, M. Infrared and Raman study of WO3 tungsten trioxides and WO3 x H2O tungsten trioxide hydrates. J. Solid State Chem. 1987, 67, 235–247. [Google Scholar] [CrossRef]
  31. Grošelj, N.; Gaberšček, M.; Opara Krašovec, U.; Orel, B.; Dražič, G.; Judeinstein, P. Electrical and IR spectroscopic studies of peroxopolytungstic acid/organic–inorganic hybrid gels. Solid State Ion. 1999, 125, 125–133. [Google Scholar] [CrossRef]
  32. Opara Krašovec, U.; Ješe, R.; Orel, B.; Grdadolnik, J.; Dražič, G. Structural, vibrational and gasochromic properties of porous WO3 films templated with a sol-gel organic-inorganic hybrid. Monatsefte Chem. 2002, 133, 1115–1133. [Google Scholar] [CrossRef]
  33. Opara Krašovec, U.; Šurca Vuk, A.; Orel, B. IR Spectroscopic studies of charged–discharged crystalline WO3 films. Electrochim. Acta 2001, 46, 1921–1929. [Google Scholar] [CrossRef]
  34. Metzger, T.G. The Rheology Handbook, 4th ed.; Vincentz Network: Hannover, Germany, 2014. [Google Scholar]
  35. Gottschalk, P.G.; Dunn, J.R. The five-parameter logistic: A characterization and comparison with the four-parameter logistic. Anal. Biochem. 2005, 343, 54–65. [Google Scholar] [CrossRef]
  36. Lapasin, R.; Pricl, S. Rheology of Industrial Polysaccharides: Theory and Applications; Blackie Academic & Professional: London, UK, 1995. [Google Scholar]
  37. Larson, R.G. The Structure and Rheology of Complex Fluids; Oxford University Press: New York, NY, USA, 1999. [Google Scholar]
  38. Winter, H.H.; Chambon, F. Analysis of linear viscoelasticity of a crosslinking polymer at the gel point. J. Rheol. 1986, 30, 367. [Google Scholar] [CrossRef]
  39. Chambon, F.; Petrovic, Z.S.; MacKnight, W.J.; Winter, H.H. Rheology of model polyurethanes at the gel point. Macromolecules 1986, 19, 2146–2149. [Google Scholar] [CrossRef] [Green Version]
Figure 1. WO3 sol and gel: (a), xerogel (b) and powder (c).
Coatings 12 00112 g001
Figure 2. TG measurement of the WO3 xerogels prepared with different solvents: xerogel A with 2-propoxy ethanol and 2-propanol; xerogel B with ethanol and xerogel C with 2-propanol.
Coatings 12 00112 g002
Figure 3. XRD patterns of the WO3 xerogel (a) and corresponding powders obtained after annealing of the xerogels for 1 h at 450 °C (b). Xerogel A and powder A denotes WO3 prepared with 2-propoxy ethanol and 2-propanol. Xerogel C and powder C denotes WO3 prepared with 2-propanol.
Coatings 12 00112 g003
Figure 4. The IR spectra of the WO3 sol, xerogel and gel prepared by different alcohols, (a) 2-propoxy ethanol, (b) ethanol and (c) 2-propanol.
Coatings 12 00112 g004
Figure 5. The IR spectra taken after the gelation of the WO3 sol (2-propoxy ethanol) in the rheometer at the temperatures (20 °C, 30 °C, 40 °C, 50 °C and 60 °C) at which the rheological properties of the sols were examined.
Coatings 12 00112 g005
Figure 6. Temperature dependence of the dynamic viscosity of freshly prepared WO3 sol and complex viscosity of gels, formed at different temperatures.
Coatings 12 00112 g006
Figure 7. Dependence of dynamic moduli G′ and G″ on time of the WO3 gelation process at different temperatures: (a) 30 °C, 40 °C, 50 °C and (b) 20 °C. The tests were performed in linear viscoelastic range. Solid symbols represent viscous modulus G’’, hollow symbols represent elastic modulus G’.
Coatings 12 00112 g007
Figure 8. Changing of phase angle d with time of gelation process at different temperatures. Dependence of dynamic moduli G′ and G″ on time of the WO3 gelation at different temperatures.
Coatings 12 00112 g008
Figure 9. Dependence of gelation time on temperature of the gelation process of the WO3 ink.
Coatings 12 00112 g009
Figure 10. Flow curves (the dependence of viscosity on shear rate) for WO3 sols at T = 23 °C.
Coatings 12 00112 g010
Figure 11. Dependence of dynamic moduli G′ and G″ on the frequency of oscillation in the range of linear viscoelastic response of the WO3 ink. Solid symbols represent viscous modulus G″, hollow symbols represent elastic modulus G′.
Coatings 12 00112 g011
Figure 12. Dependence of dynamic moduli G′ and G″ on the frequency of oscillation in the range of linear viscoelastic response for gels, formed at 60 °C, 40 °C and 20 °C, respectively. Solid symbols represent viscous modulus G’’, hollow symbols represent elastic modulus G’.
Coatings 12 00112 g012
Table 1. The parameters of the five-parameter logistic model (Equation (1)) for the gelation process at different temperatures.
20 °C30 °C40 °C50 °C60 °C
δmax90.090.090.090.090.0
δmin17.40.00280.00280.00230.0027
tg (h)10.066.23.11.50.55
W7.826.430.1824.7318.56
s0.921.431.321.091.06
Publisher’s Note: MDPI stays neutral with regard to jurisdictional claims in published maps and institutional affiliations.

