The Effect of Crown Social Class on Bark Thickness and Sapwood Moisture Content in Norway Spruce


Department of Yield and Silviculture, Slovenian Forestry Institute, 1000 Ljubljana, Slovenia
*
Author to whom correspondence should be addressed.
Forests 2020, 11(12), 1316; https://doi.org/10.3390/f11121316
Submission received: 27 October 2020
/
Revised: 6 December 2020
/
Accepted: 8 December 2020
/
Published: 10 December 2020
(This article belongs to the Special Issue Natural Disturbances under Climate Change: Challenges, Trends, and Management Implications)
Abstract
:The research study examined the effect of tree properties (crown social class, diameter at breast height (DBH), and tree height) on bark thickness (BT) and sapwood moisture content (SMC) in Norway spruce (Picea abies (L.) H. Karst.). Both examined variables were shown to be positively affected by DBH and tree height. The relationship between DBH and SMC varied among crown social classes, while the relationship between DBH and BT was relatively constant across crown social classes. Crown social class had a relatively small effect on BT and SMC, having a more pronounced effect on SMC than on BT. The relationship between tree height and BT did not vary across crown social classes, while the relationship between SMC and tree height was found to change slightly across crown social classes. Measurements of BT and SMC in the field are affordable, fast, and easy to use. Both variables could potentially be used to improve predictions of bark beetle attacks, as they reflect the physiological state of an individual tree.
1. Introduction
In recent years, the resilience of Norway spruce (Picea abies (L.) H. Karst.) has been increasingly challenged by climate change [1]. Climate-associated severe events, such as storms, droughts, and heat waves, amplify the susceptibility of Norway spruce to secondary damage, like bark beetle outbreaks [1,2]. This issue is more pronounced in regions where spruce trees have been planted outside their optimal natural ecological range, such as in lowland areas, and resulted in flooding of global markets with damaged timber in just a few years [3]. As the frequency of climate-associated severe events will likely increase due to global warming [4], bark beetle attacks will become more common due to the increasing amount of damaged timber.
Several past studies have examined what makes individual Norway spruce trees more susceptible to spruce bark beetle (Ips typographus L.) attacks. The host selection strategy was found to be flexible [5,6,7], attacking physiologically stressed trees first [6] and then moving on to healthy trees as the population increases, thus enabling the stronger defense of healthy trees to be overcome. Past studies have confirmed that crown length, crown structure, and crown social class can also play a role in the susceptibility of Norway spruce trees to bark beetle attacks [8,9]. Trees from the dominant crown class were attacked more frequently than trees from other social classes. Furthermore, it was shown that height, diameter at breast height, and bark thickness were positively connected with bark beetle attacks, while phloem thickness had no influence [9]. Diameter at breast height (DBH) and other tree properties (tree height, crown length ratio, age, and basal area) were confirmed as the best predictors of a bark beetle attack, with changes in tree mortality during the outbreak [10].
In botany, the term bark refers to all tissue outside the vascular cambium in woody plants. It consists of dead outer bark, also called rhytidome, and living inner bark. Bark tissue is the product of the activity of two lateral meristems: the vascular cambium and the cork cambium. The former produces phloem, while the latter produces phellem (cork) and phelloderm [11]. The bark structure is very diverse; it is composed of different cell types that perform numerous vital functions in the living tree: e.g., transport of photosynthates and signal molecules to the different parts of the tree; storage of non-structural carbohydrates and water and other compounds; mechanical support; and protection against solar radiation, drought, fire, frost, physical damage, plant pathogens, and herbivores [12]. Apart from its crucial role for the performance of trees, the bark mostly remains an underutilized industrial by-product. It has mainly been used for energy production, while its potential for new value-added products is not yet fully exploited. However, numerous recent studies show a growing commercial interest towards its more efficient and comprehensive use, which is necessary for its transformation to a biocircular economy [13]. In this respect, data on bark thickness on standing trees for different tree species and regions would allow more accurate estimates of the wood log volume without bark overall and availability of bark biomass to determine its potential use as a raw material [14,15]. The bark of Norway spruce has been relatively well studied (see, e.g., in [13,15,16,17]), which is undoubtedly due to the large share and economic value of spruce timber on global markets [3]. Consequently, there is a great interest in developing a more efficient use of the large available quantities of spruce bark.
Tree mortality due to bark beetle attacks interacts with the presence of drought [18], which is why adding only bark thickness to prediction models will likely not be enough. Other indicators that reflect the potential presence of drought or the general vitality of the examined trees are therefore needed, such as the vitality and vigor of the trees. Although they cannot be measured directly, they can be measured indirectly by various indicators, such as crown condition, stem radial growth, cambial electrical resistance, etc. [19,20]. An example of such a method is the impedance measurement in standing trees using twin-needle probes in cambium/xylem, which was confirmed to be useful for vitality assessment in trees [20]. This method is based on the principle that trees with higher vitality have a higher moisture content, which is reflected in the amount of ions and cations in the vascular tissue [20]. The measurements are relatively fast and non-destructive, meaning the method could be applied in practice. Additionally, Stephenson et al. [21] have shown that drought can directly influence host tree selection, opening up the possibility of using sapwood moisture content as an indicator of drought stress to be included in vulnerability assessments of individual stands. Vigorous trees offer more resources to bark beetles due to their thicker phloem, provided that they can be “captured” by the bark beetles. Such trees are not attacked immediately at the beginning of the outbreak, but only in later stages. This adaptive host selection behavior increases the possibility to try to determine the ratio of stressed-to-vigorous trees in a given stand and to use such ratios in models to predict vulnerability to large-scale bark beetle attacks.
As demonstrated above, the properties of individual trees are among the most useful variables in predicting bark beetle attacks in Norway spruce. However, tree properties are often correlated to each other and can also be influenced by outside factors (e.g., site, exposition, and bedrock). This research study aims to investigate the effect of tree properties (crown social class, DBH, and tree height) on bark thickness and sapwood moisture content in Norway spruce at two different locations. The study has two specific hypothesis: (i) DBH and tree height positively influence bark thickness and sapwood moisture content, and (ii) crown social class influences the relationships between the two examined variables: DBH and tree height. The first hypothesis is based on the fact that healthier fast growing trees, with an often large diameter and tree height for a climax species like Norway spruce, have larger crowns and transport/store more organic matter. However, diameters at breast height do not always directly reflect tree’s social status, as the social status can change several times throughout a lifetime of a tree. The second hypothesis is based on the previous work of Krajnc et al. [22], where different crown social classes of Norway spruce trees were found to have significantly different crown properties. This could have a direct effect on either bark thickness or sapwood moisture content, or an indirect effect by affecting the relationships between the two examined variables: DBH and tree height.
The two easily measurable variables could potentially be used to improve predictions of bark beetle attacks. It has been reported that bark thickness varies between attacked and non-attacked trees [9], while the sapwood moisture content indirectly reflected the vitality and vigor of individual trees [20]. However, it is very likely that both variables are influenced by other confounding factors, for example, DBH, tree height, crown social class, and site. Such relationships would need to be taken into account when using any of the listed variables in predicting bark beetle attacks. This study aims to quantify the direction and magnitude of the effect of the listed variables on bark thickness and sapwood moisture content, so that they can be appropriately included in future research studies.
2. Materials and Methods
This research study was carried out in November 2019 on two even-aged monoculture stands of Norway spruce in Slovenia, Europe. The stands were approximately 120 years old and had been managed by selection thinning in the past. The first stand was located on Pohorje (NE Slovenia, 46°27′0.1″ N 15°25′18.1″ E, 1200 m a.s.l.) and the second one on Jatna (SE Slovenia, 46°2′30.2″ N 15°5′39.8″ E, 750 m a.s.l.). Both stands were of a similar site productivity, as determined by the volume tariff class for Norway spruce by the Slovenian Forest Service in their internal information system. The Pohorje stand was located on a higher elevation in an area with an extremely high probability of bark beetle attacks over the last few years, while the Jatna stand was located on a lower elevation in an area with a very low probability of bark beetle attacks [23]. The two stands were included in the study to examine any potential differences between them that could have an influence on susceptibility to bark beetle attacks. The trees in each stand were randomly sampled, starting from one tree and then moving from one tree to next closest tree in the same cardinal direction. All trees were alive without any signs of being attacked by bark beetles at the time of measurement. Diameter at breast height (DBH) of each tree was measured using a diameter tape and each tree was assigned to one of the five crown social classes as proposed by the Kraft classification system, which uses relative crown size and position in relation to neighboring trees to classify individual trees [24]. Tree height was also measured on a subset of trees with a Vertex IV hypsometer (Haglöf Sweden AB, Långsele, Sweden); the subset was created by measuring every other tree height. Bark thickness (BT) was measured in millimeters once per tree using a bark gauge (Haglöf Sweden AB, Långsele, Sweden), and sapwood moisture content (SMC) was measured using the Gann Hydromette RTU 600 moisture meter with the MH 34 active electrode (Gann Mess- u. Regeltechnik GmbH, Gerlingen, Germany), which is able to measure wood moisture content above fibre saturation point in coniferous wood. The values of the SMC are in given in percent, the depth of needle penetration was 16 millimeters, and the measurements were conducted in accordance with the manufacturer’s instructions. The electrode pins were perpendicular to the grain direction. As sapwood is responsible for water and nutrient transportation, its moisture content is above fiber saturation point, and has the highest moisture content when looking at radial moisture content distribution. The absolute values are season-dependent and also likely fluctuate daily due to the differences in evapotranspiration. All trees were measured by the same person in the same time span within an individual day (before noon) and in a span of a few days in the same season to avoid any potential influence of season, day, or person collecting the data. The data were imported and further analyzed in an open source statistical environment R [25] using a Bayesian general linear model. This approach incorporates the uncertainty into the model itself and provides more informative conclusions. Two model sets were constructed: the first set on the complete data and the second on the smaller data subset with tree heights. Both sets were constructed with BT as the dependent variable, followed by SMC as the dependent variable. The four models were implemented in Stan [26], with the help of the R package rethinking 2.11 [27]. The priors used were weakly informative (see Table 1), the model was specified as follows.
The two separate dependent variables were BT and SMC, while the independent variables were DBH, site, and crown social class in the first two models. An interaction between crown social class and DBH was also included in the model. In the second model set tree height was added, along with an interaction between tree height and crown social class. The two model sets are not directly comparable because the datasets were different between the two sets. However, they can provide an informative comparison. All models were checked for convergence and effective numbers of samples as recommended by McElreath [28].
3. Results
3.1. Summary of Measured Data
Tree diameter at breast height (DBH), sapwood moisture content (SMC), and bark thickness (BT) were measured on a total of 514 Norway spruce trees, distributed over the five different crown classes as shown in Table 2. The values of SMC were higher for spruces grown on the Jatna site (overall mean 167% vs. 156%), while BT was generally lower on Jatna than on Pohorje (overall mean 10 mm vs. 12 mm). At both sites there was less variability in SMC (∼11%) than in BT (∼17%) or DBH (∼16%). More dominant trees exhibited both higher SMC and thicker bark than less dominant trees. Both properties increased with tree dominance; however, this could be directly related to the differences in DBH. The rate of change with dominance appeared to be different between the three observed properties, as diameter appeared to be most sensitive to changes in dominance, followed by BT and SMC. BT and SMC in relation to DBH and tree height are displayed in Figure A1.
As both SMC and BT are likely to be influenced by tree height, a separate subset of trees was used, where heights were also measured. The height of 179 trees was measured, and the characteristics of the data subset are shown in Table 3. Tree height was higher at the Jatna site (overall mean 27.1 m vs. 22.5 m), with notable differences in tree height between crown social classes.
3.2. Model Results and Comparison
Due to the interconnected nature of the three measured variables, a direct comparison of the variables across crown social classes directly is probably not the most sensible approach, and instead a general linear model was used to compare how BT and SMC vary between sites, DBH, and crown social class. The effect of crown social class, DBH, and site on SMC and BT was examined using two separate general linear models, as described in Materials and methods. The posterior distributions of the model parameters are presented in Table A1 and Table A2. The general linear models for SMC and BT presented above were modified to include tree height and the interaction between tree height and crown social class. This interaction was included due to the notable differences in height between crown social classes. The posterior distributions of model parameters are presented in Table A3 and Table A4. In order to make a meaningful comparison between the two different model sets, a series of figures has been created which include the posterior distributions of both model sets, with and without the tree height. The values in the figures are absolute values of each parameter; for a relative comparison to the model intercept, the reader is directed to the tables of posterior distributions in the Appendix A.
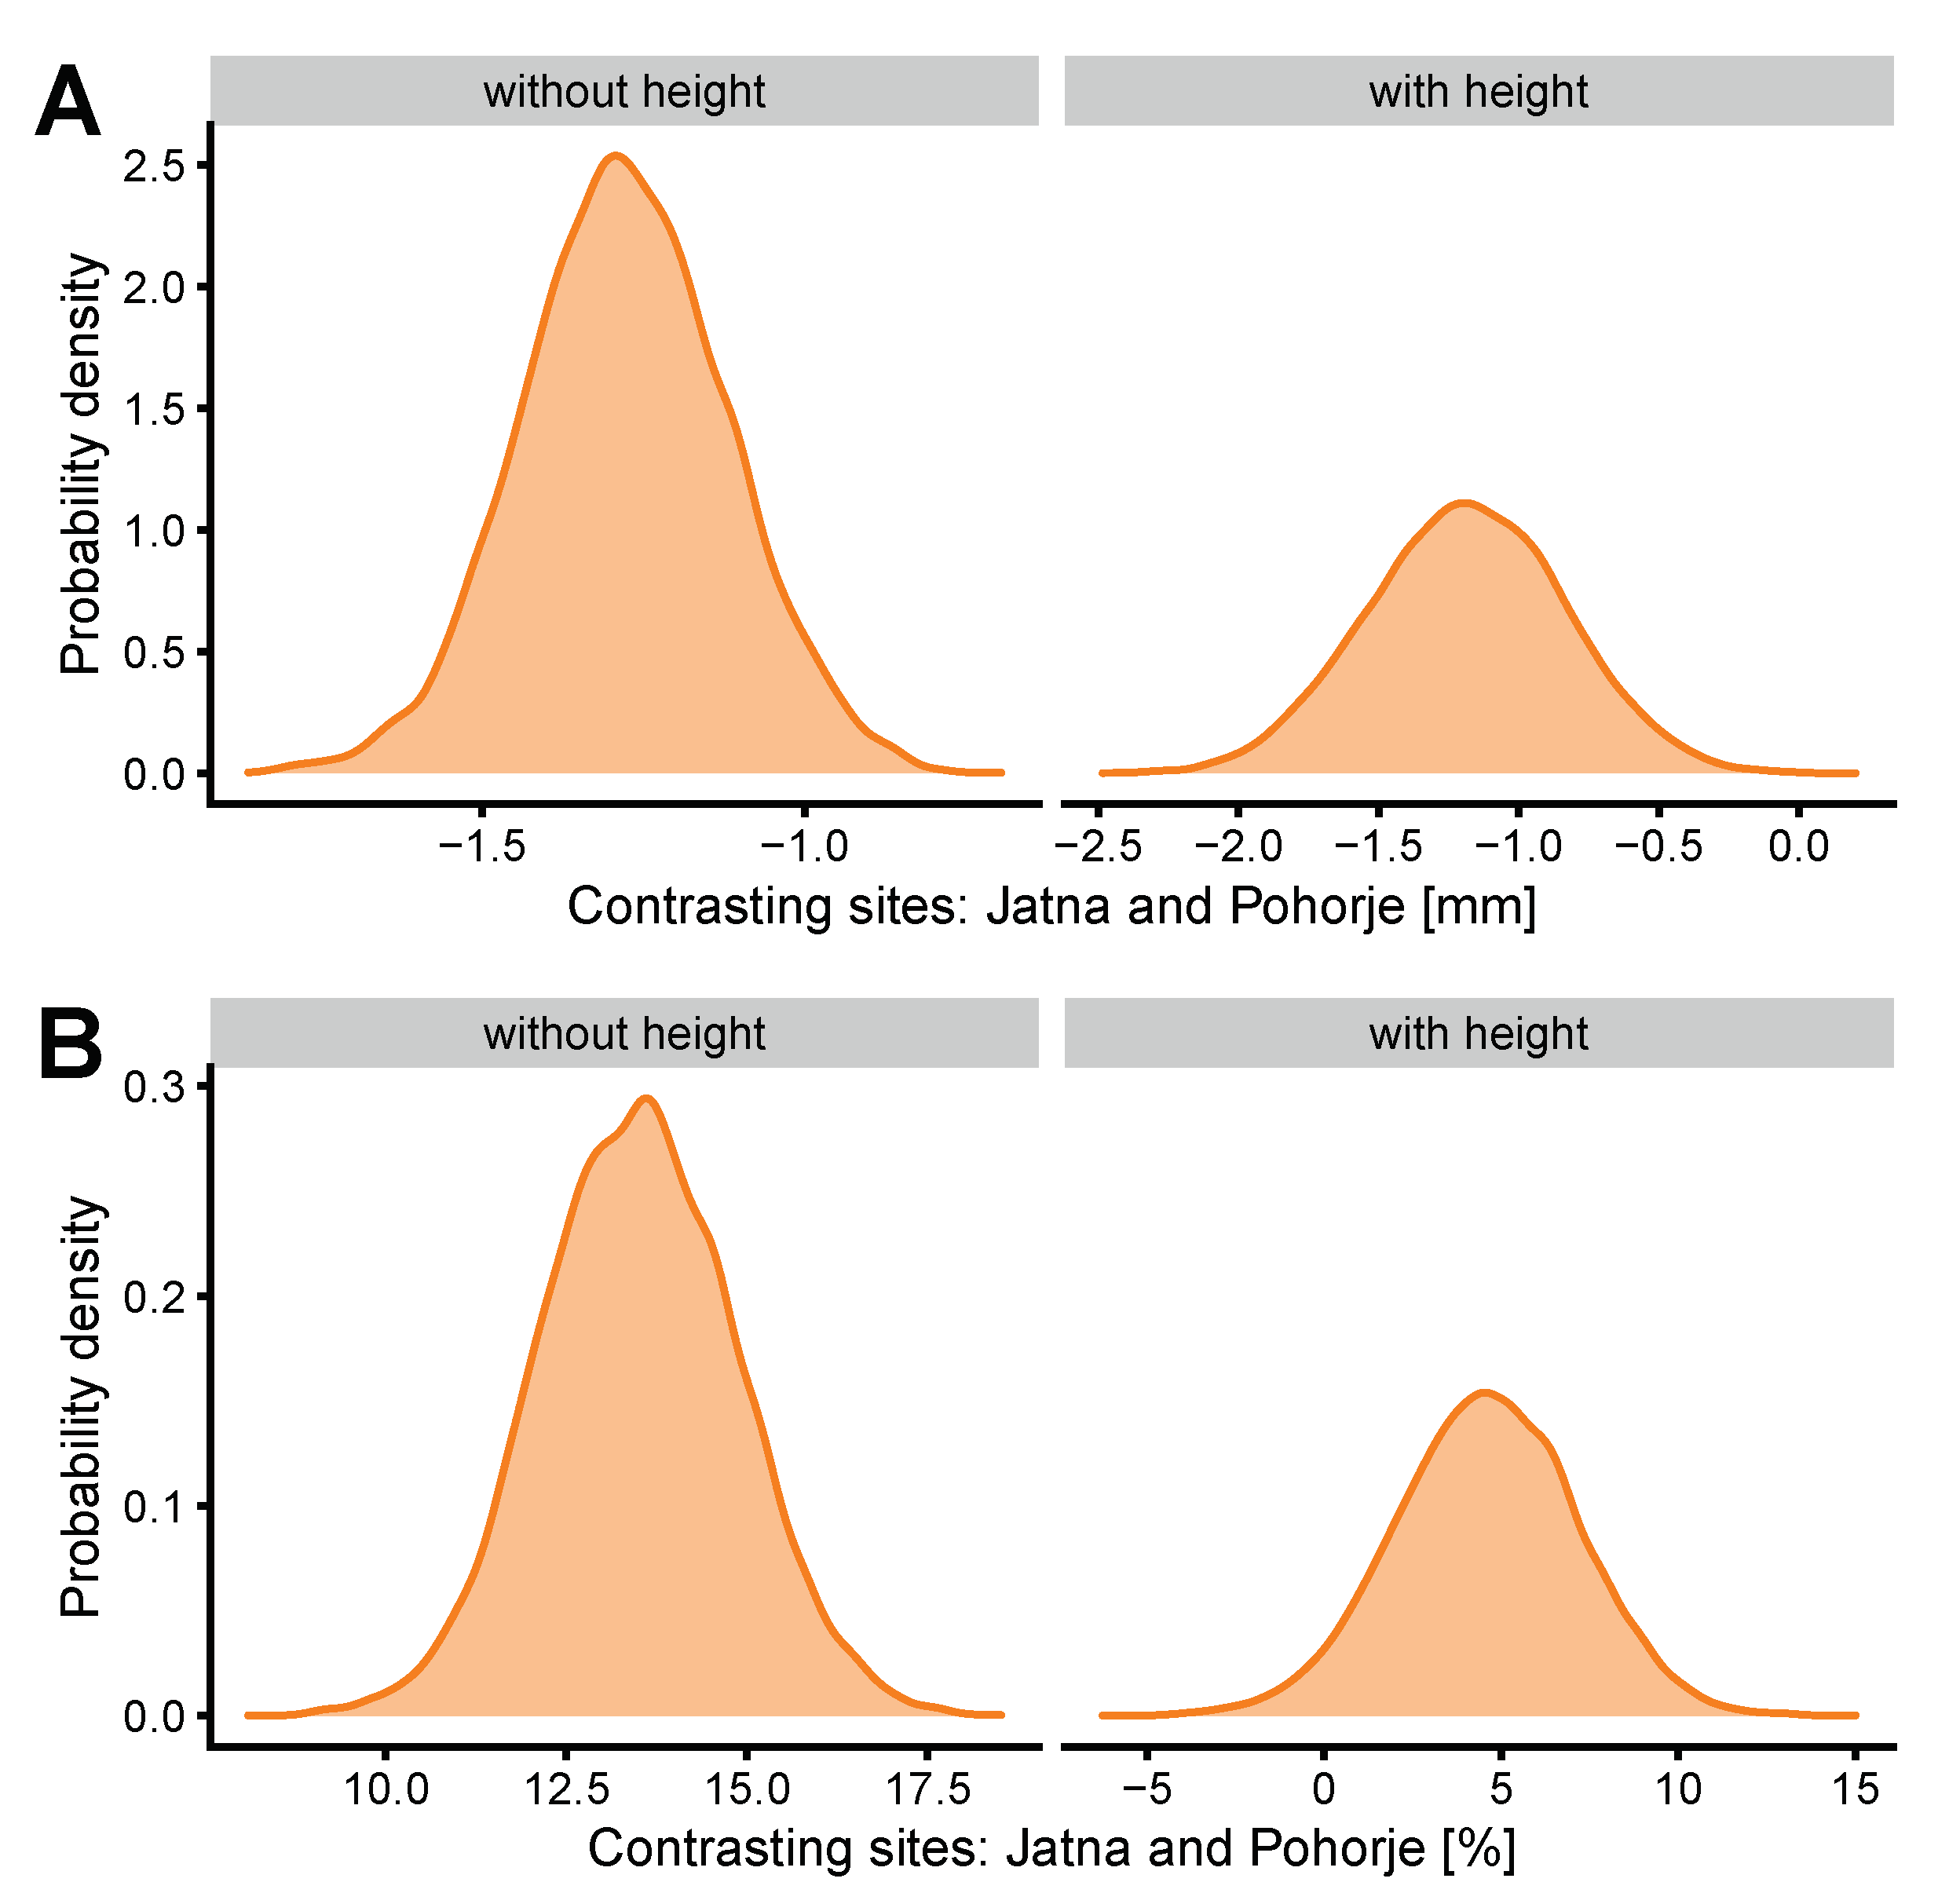
The effect of site across the two models sets is shown in Figure 1. The differences between the two included sites appeared noteworthy, with the Pohorje trees exhibiting lower BT and probably higher SMC even after accounting for the differences in tree height and DBH between the two sites. The magnitude of the effect appeared similar between models with and without tree height for BT (mean parameter difference of −1.3 mm vs. −1.2 mm), suggesting that this relationship was not affected by height, while the difference between sites in SMC changed after including tree heights in the models (mean parameter difference of 13.5% vs. 4.6%). The effect was smaller in models with height, however, it was still present.
The effect of DBH on BT (Figure 2) was found to be positive and unlikely to change with crown social class, indicating that the relationship between DBH and BT was not dependent on crown social class. This was confirmed with and without inclusion of tree height in the model, suggesting that the direction of this effect was not affected by tree height as it is positive in both models. However, the magnitude of the effect changed and became smaller (a difference of ∼0.1 mm/cm) after including tree heights in the model.
The effect of DBH on SMC (Figure 3) was predominately positive and probably differed between the crown social classes. It appeared to depend on tree height. After including tree height in the model, dominated trees appeared to have a strongly negative relationship between DBH and SMC, while overtopped trees had a strongly positive relationship. Crown social classes of the upper three layers of the stand appeared to have a different sapwood moisture content than those from the bottom layers.
The effect of crown social class on BT can be seen in Figure 4. After excluding the effects of sites and DBH, there were little differences found between crown social classes. The more dominant the tree was, the less likely it was to have a positive effect on BT. These relationships remained the same even after including tree height in the model, indicating that tree height was probably not responsible for the differences between social classes.
Crown social class had a different effect on SMC than on BT (Figure 5). A notable positive effect was confirmed for dominant social class, and a strong negative effect was found in the overtopped trees. Although these relationships changed somewhat after including tree heights into the model, overtopped trees still had a significantly lower SMC. The posterior distributions of the parameters indicate that some crown social classes can have a profound effect on SMC.
The effect of tree height on BT and SMC is shown in Figure 6. The effect appeared to be mostly positive in both SMC and BT with the notable exceptions of SMC in predominant and overtopped trees, where the effect appeared to be neutral. The differences between social classes in both parameters were relatively small, which would indicate that the relationships between tree height and the two examined properties were not dependent on crown social classes.
4. Discussion
4.1. Research Hypotheses
The first hypothesis on the positive relationship between DBH or tree height on either bark thickness or sapwood moisture content was confirmed in our study, as described in the paragraphs below. The second hypothesis on whether crown social class influences the examined relationships was only partly confirmed. The relationships of DBH and tree height to sapwood moisture content were found to vary across crown social classes, while the relationships of DBH and tree height to bark thickness are seemingly not affected by crown social class of the tree.
4.2. The Values of Bark Thickness and Sapwood Moisture Content
The bark thickness values from the current study are comparable to those reported for Norway spruce by earlier studies [15,29,30] and are slightly higher than the values for Norway spruce reported by Andre Leclercq and Benoit Jourez [31]. The measurements were collected by the same person within a few days at both sites included in the current study, which excluded potential variation in values due to the time of year or due to the person carrying out the measurements.
Bark thickness varies according to site conditions, tree vigor, tree age, tree part, and social position [15,29,30,31,32]. At a single location in the tree, bark thickness depends on the activity of the two meristems (vascular cambium and cork cambium), as well as on numerous processes related to secondary changes in older bark tissues, such as collapse of sieve elements, sclereid formation, and inflation of parenchymal cells [33]. As all these processes can occur simultaneously, the contribution of individual processes to the variation in bark thickness over time is not easy to estimate. Finally, external dead bark tissues in Norway spruce eventually fall off the tree, which also affects the bark thickness.
Of all these processes, most studies have been performed on the seasonal dynamics of phloem formation and its anatomy (see, e.g., in [34,35,36,37]. In Norway spruce from three different temperate forest sites, it has been demonstrated that the variation in width and structure of phloem increments was mainly observed at site level rather than on a temporal scale. It was found that the differences were more pronounced in late phloem because of different duration and rate of cell production in the cambium [36,38]. Studies have also shown that site-specific differences can be partly explained by different environmental conditions and by the strategy of Norway spruce to adapt wood and phloem structure to function optimally under local conditions [36,38]. While living phloem is important for transport of photosynthesis products and for storage of the carbohydrates and water, dead bark is crucial for providing an insulating layer that protects the inner living tissues of bark and cambium against various external abiotic and biotic factors [39].
A direct comparison of sapwood moisture content with earlier research values is not possible, as the current study was one of the first to use the Gann device with suitable active electrodes on standing trees. The method of using sapwood moisture content as an indicator of tree vitality is not new and has been in use for several decades [20]. The differences in sapwood moisture content between crown social classes obtained in current study are in line with what was reported in past studies by Johnstone et al. [20], where more vital trees were found to have higher sapwood moisture content. In the current study, more dominant trees exhibited higher values of sapwood moisture content, presumably due to higher vitality as a result of more growing space and less competition.
4.3. The Effect of Site
The difference in bark thickness between the two examined sites is approximately 13% of the overall mean values of bark thickness and is probably caused by external site characteristics (e.g., soil fertility and water availability) [15,29] as well as other processes discussed in the previous paragraph. Although the trees at both sites were of a similar age and site productivity class as classified by the Slovenian Forest Service using volume tariff classes, there was a difference in tree heights of more dominant crown social classes with higher trees observed on the Jatna site. It is therefore likely that differences in bark thickness could also be explained by differences in productivity on a micro-scale, e.g., deeper pockets of soil in some parts of the stand resulting in a higher productivity in those parts. This is in line with the findings of Stängle et al. [15], which showed that bark thickness is most likely influenced by a combination of many different factors (e.g., nutrient and water availability, and stand density).
The results of the current study imply that bark thickness by itself cannot be used in any kind of prediction across multiple sites without converting absolute values into relative site-specific values, i.e., they should probably be standardized per site before being used in the modeling. The differences in sapwood moisture content between sites were less than 10% of the overall mean values of moisture content and range from 3% to 9%, depending on the inclusion of tree height in the model. Sapwood moisture content should also be standardized, although the differences between sites are smaller than the difference in bark thickness and could potentially be disregarded after accounting for the effect of tree height on sapwood moisture content. Future research should examine whether the differences found in the current study persist across more sites and under different growing conditions.
4.4. The Effect of Diameter at Breast Height
The positive relationship between bark thickness and diameter at breast height was expected and is in line with past research. Spruce bark beetles appear to prefer trees with thicker bark [9], and as past studies have confirmed that larger-diameter trees are attacked more frequently [8,10], these parameters could be useful in improving existing threat models for Norway spruce. The preference of attacking larger-diameter trees could also be explained by the bark structure, where thicker bark contains more living phloem, and consequently a higher amount of carbohydrates, which provide more food for the bark beetles. Although the relationship between diameter and sapwood moisture content is more likely to be positive, the relationships appear to vary between crown social classes. This could be related to the different conduit sizes between crown social classes due to the differences in crown properties and overall tree size, as variation in conduit size is dependent on the size of the tree.
In agreement with the tapering of conduits along the stem axis, diameter of the conduits is smaller closer to the crown than in lower positions, at the base of the tree [40]. Generally, cell dimensions are affected by turgor pressure in the cells [41]; therefore, weather conditions, especially water availability, prior and during their formation are an important driver for the final size of tracheids [42]. However, recent studies have suggested that tree and crown size explain the variation in conduits size much more than climatic conditions [12], which would explain tracheid size variations between adjacent trees at the same site, which differ in height and/or crown social class. A difference in relative needle mass between crown social classes was also reported [43], which probably also contributes to a change in conduit size. Small-diameter conduits with thick cell walls result in lower conduit frequency per unit of conducting area and in higher mechanical support [37].
In the xylem of Norway spruce, sapwater transport occurs over several sapwood rings, with decreasing conductivity towards the inner sapwood [44]. Longuetaud et al. [45] found that in Norway spruce, the number of xylem rings in both heartwood and sapwood at any height of the stem was strongly correlated with the cambial age and was independent of growth conditions. This resulted in a constant sapwood width in basipetal direction from the crown towards the stem base. In addition, the authors found that the sapwood width was related to the vitality and dominance position of the tree, i.e., sapwood was wider in more productive trees. Significant indicators of tree vitality were the total cross-sectional area of branches, slenderness, and the relative and absolute height of the crown base [45]. As the penetration depth of the needles into the sapwood remains relatively constant and is not diameter-dependent, this would indicate that the sapwood moisture content reflects the variation in tracheid size between different diameters and crown social classes.
The current study did not confirm notable differences in the relationship between bark thickness and diameter at breast height across different crown classes. This may indicate that bark thickness is more related to stem development rather than crown development. However, crown social classes were found to affect the relationship between diameter and sapwood moisture content. Not only do crown social classes differ in diameter and height, but also in crown eccentricity, crown projection area, ratio of crown length to tree height [22], and relative needle mass [43], as discussed above. More suppressed trees have smaller, more eccentric crowns with a lower relative needle mass, and smaller ratios of crown length to tree height. These factors, along with those discussed in the previous paragraph, are likely the cause of the differences in the relationship between diameter and moisture content across crown social classes. Future research could also include more crown-specific properties, either directly by measuring them or indirectly by using already developed models relating stem and crown growth [46].
4.5. The Effect of Crown Social Class
Crown social class had a relatively small effect on bark thickness, with a varying direction of the effect. The likelihood of a positive effect appears to increase with dominance, the likelihoods remain somewhat constant even after including tree height into the model. This is partly opposite to the findings of Andre Leclercq and Benoit Jourez [31], who found some differences in bark thickness among different crown social classes. However, this study did not account for the differences in diameters between crown social classes (more suppressed trees having smaller diameters and vice versa), and therefore such a result is in line with the findings of the current study.
In an opposite manner, crown social class appears to have a stronger impact on sapwood moisture content. Larger differences were found here, presumably due to the stronger connection between crown structure and sapwood moisture content as discussed above. The current study confirmed a positive effect for the dominant social class and a negative in overtopped trees; however, this only indicates that crown social class can potentially influence sapwood moisture content. Although the relationships change slightly with the inclusion of tree height in the model, the changes are relatively small. This would indicate that crown structure rather than tree height is the main driver of the potential differences between the examined crown social classes, probably due to the factors listed at the end of the previous paragraph.
4.6. The Effect of Tree Height
Bark thickness and tree height were found to be positively connected with the relationship remaining constant across crown social classes. This is in line with what was found when exploring the dependence of diameter–bark thickness relationship. In a similar manner to the dependence of diameter and sapwood moisture content, the relationship between sapwood moisture content and tree height was found to change slightly across crown social classes. The changes are relatively small and could potentially be disregarded, provided other studies confirm the findings of the current study.
5. Conclusions
Measuring bark thickness and sapwood moisture content in the field is affordable, fast, and easy to use. A single person can measure over 100 trees in an eight-hour workday, while a team of two people can easily also measure tree heights and make assigning trees into crown social class quicker and more objective. However, both variables are strongly dependent on the time of year, and the values collected at different times of the year should be corrected to a common denominator as demonstrated by Laasasenaho et al. [29]. Caution should also be exercised when comparing values collected by different laboratories, as the measurements can also differ among different people performing the measurements [29].
Both variables could potentially be used to improve predictions of bark beetle attacks, as they reflect the physiological state of an individual tree and bark beetles were shown to favor physiologically weakened trees [47]. The host selection strategy for each attack should be included, as healthy trees can also be attacked as the bark beetle population increases [6] and the usability of the examined variables in predictions may change as bark beetle population changes. As the increased frequency of climate-associated severe events is expected to lead to more bark beetle outbreaks, new and innovative approaches are needed to either try to predict attacks in advance with a higher accuracy or to mitigate their outcomes in advance by early detection and identification of physiologically weakened trees. As the socio-economic impact of the accumulation of damaged wood causes a reduction in spruce timber prices and affects the entire forest-wood based sector [48,49], future research should try to use the variables examined in the current studies as soon as possible.
Author Contributions
Conceptualization, L.K. and J.G.; formal analysis, L.K.; writing—original draft preparation, L.K. and J.G.; writing—review and editing, L.K. and J.G.; visualization, L.K.; funding acquisition, J.G. All authors have read and agreed to the published version of the manuscript.
Funding
This research was funded by the Slovenian Research Agency, research core funding no. P4-0107. Part of the research was also supported by the project Wood and wood products over a lifetime (Slovenian Ministry of Education, Science and Sport) and research project V4-2017 (Slovenian Ministry of Agriculture, Forestry and Food).
Acknowledgments
The authors gratefully acknowledge the help of Andreja Vedenik, Peter Prislan, Polona Hafner, and Domen Arnič in the field.
Conflicts of Interest
The authors declare no conflict of interest. The funders had no role in the design of the study; in the collection, analyses, or interpretation of data; in the writing of the manuscript; or in the decision to publish the results.
Abbreviations
The following abbreviations are used in this manuscript:
| DBH | Diameter at breast height |
| BT | Bark thickness |
| SMC | Sapwood moisture content |
Appendix A

Table A1.
Model no.1 results (modeling bark thickness without tree height), showing posterior distributions of the general linear model parameters: mean values, standard deviation, and percentile intervals.
Table A1.
Model no.1 results (modeling bark thickness without tree height), showing posterior distributions of the general linear model parameters: mean values, standard deviation, and percentile intervals.
| Percentile Interval | ||||
|---|---|---|---|---|
| Mean | SD | 5.5 % | 94.5 % | |
| Intercept | 6.57 | 1.96 | 3.47 | 9.74 |
| 1.75 | 0.05 | 1.67 | 1.84 | |
| Site | ||||
| Jatna | −2.31 | 1.79 | −5.18 | 0.50 |
| Pohorje | −1.03 | 1.79 | −3.91 | 1.80 |
| Diameter | ||||
| dbh | 0.16 | 0.02 | 0.12 | 0.19 |
| dbhpredominant | 0.01 | 0.03 | −0.04 | 0.05 |
| dbhdominant | 0.02 | 0.03 | −0.02 | 0.06 |
| dbhcodominant | 0.03 | 0.03 | −0.02 | 0.07 |
| dbhdominated | 0.04 | 0.03 | −0.01 | 0.10 |
| dbhovertopped | 0.07 | 0.04 | 0.01 | 0.12 |
| Crown social class | ||||
| predominant | 0.14 | 1.62 | −2.45 | 2.72 |
| dominant | −0.54 | 1.43 | −2.82 | 1.75 |
| co-dominant | −0.50 | 1.42 | −2.77 | 1.74 |
| dominated | −1.11 | 1.46 | −3.45 | 1.22 |
| overtopped | −1.47 | 1.40 | −3.71 | 0.79 |
Table A2.
Model no.2 results (modeling sapwood moisture content without tree height), displaying posterior distributions of the general linear model parameters: mean values, standard deviations, and percentile intervals.
Table A2.
Model no.2 results (modeling sapwood moisture content without tree height), displaying posterior distributions of the general linear model parameters: mean values, standard deviations, and percentile intervals.
| Percentile Interval | ||||
|---|---|---|---|---|
| Mean | SD | 5.5 % | 94.5 % | |
| Intercept | 140.31 | 16.60 | 114.55 | 167.12 |
| 14.42 | 0.31 | 13.92 | 14.93 | |
| Site | ||||
| Jatna | 2.16 | 15.19 | −22.23 | 26.12 |
| Pohorje | −11.34 | 15.20 | −35.93 | 12.58 |
| Diameter | ||||
| dbh | 0.68 | 2.04 | −2.58 | 3.95 |
| dbhpredominant | 0.10 | 2.04 | −3.22 | 3.36 |
| dbhdominant | −0.52 | 2.04 | −3.79 | 2.74 |
| dbhcodominant | 0.14 | 2.04 | −3.13 | 3.40 |
| dbhdominated | −0.51 | 2.05 | −3.82 | 2.76 |
| dbhovertopped | 1.46 | 2.06 | −1.85 | 4.74 |
| Crown social class | ||||
| predominant | 2.58 | 13.64 | −19.28 | 24.19 |
| dominant | 31.33 | 12.09 | 11.79 | 50.53 |
| co-dominant | −0.01 | 11.96 | −19.33 | 19.10 |
| dominated | 2.74 | 12.93 | −18.10 | 23.27 |
| overtopped | −47.45 | 12.20 | −67.20 | −27.98 |
Table A3.
Model no.3 (modeling bark thickness with tree height), showing posterior distributions of the general linear model parameters: mean values, standard deviations, and percentile intervals.
Table A3.
Model no.3 (modeling bark thickness with tree height), showing posterior distributions of the general linear model parameters: mean values, standard deviations, and percentile intervals.
| Percentile Interval | ||||
|---|---|---|---|---|
| Mean | SD | 5.5 % | 94.5 % | |
| Intercept | 7.02 | 2.01 | 3.86 | 10.27 |
| 1.61 | 0.09 | 1.48 | 1.76 | |
| Site | ||||
| Jatna | −2.10 | 1.80 | −4.95 | 0.79 |
| Pohorje | −0.91 | 1.80 | −3.75 | 1.97 |
| Diameter | ||||
| dbh | 0.10 | 0.03 | 0.06 | 0.15 |
| dbhpredominant | −0.02 | 0.04 | −0.08 | 0.04 |
| dbhdominant | 0.04 | 0.03 | −0.01 | 0.09 |
| dbhcodominant | 0.04 | 0.03 | −0.02 | 0.09 |
| dbhdominated | 0.01 | 0.04 | −0.05 | 0.07 |
| dbhovertopped | 0.04 | 0.04 | −0.03 | 0.11 |
| Crown social class | ||||
| predominant | 2.01 | 2.06 | −1.28 | 5.30 |
| dominant | −0.36 | 1.80 | −3.17 | 2.52 |
| co-dominant | −1.95 | 1.68 | −4.63 | 0.73 |
| dominated | −1.14 | 1.70 | −3.86 | 1.54 |
| overtopped | −1.52 | 1.58 | −4.05 | 1.02 |
| Tree height | ||||
| height | 0.05 | 0.04 | −0.01 | 0.11 |
| heightpredominant | −0.01 | 0.05 | −0.08 | 0.06 |
| heightdominant | −0.03 | 0.04 | −0.10 | 0.03 |
| heightcodominant | 0.05 | 0.04 | −0.02 | 0.11 |
| heightdominated | 0.03 | 0.04 | −0.04 | 0.10 |
| heightovertopped | 0.02 | 0.04 | −0.05 | 0.08 |
Table A4.
Model no. 4 results (modeling sapwood moisture content with tree height, showing posterior distributions of the general linear model parameters: mean values, standard deviations, and percentile intervals.
Table A4.
Model no. 4 results (modeling sapwood moisture content with tree height, showing posterior distributions of the general linear model parameters: mean values, standard deviations, and percentile intervals.
| Percentile Interval | ||||
|---|---|---|---|---|
| Mean | SD | 5.5 % | 94.5 % | |
| Intercept | 141.34 | 16.55 | 114.77 | 167.20 |
| 10.48 | 0.32 | 9.97 | 11.00 | |
| Site | ||||
| Jatna | −1.87 | 15.19 | −26.07 | 22.29 |
| Pohorje | −6.43 | 15.20 | −30.73 | 17.76 |
| Diameter | ||||
| dbh | 0.27 | 2.06 | −3.07 | 3.54 |
| dbhpredominant | 0.22 | 2.08 | −3.07 | 3.59 |
| dbhdominant | −0.19 | 2.07 | −3.46 | 3.15 |
| dbhcodominant | 0.48 | 2.07 | −2.83 | 3.83 |
| dbhdominated | −2.10 | 2.11 | −5.45 | 1.32 |
| dbhovertopped | 1.92 | 2.16 | −1.52 | 5.37 |
| Crown social class | ||||
| predominant | 15.20 | 20.09 | −16.27 | 47.92 |
| dominant | 14.29 | 16.02 | −11.30 | 39.93 |
| co-dominant | −17.01 | 14.28 | −39.76 | 6.08 |
| dominated | 26.78 | 15.30 | 2.42 | 51.17 |
| overtopped | −46.96 | 13.59 | −68.41 | −24.96 |
| Tree height | ||||
| height | 0.46 | 2.04 | −2.82 | 3.74 |
| heightpredominant | −0.40 | 2.15 | −3.81 | 3.10 |
| heightdominant | 0.28 | 2.08 | −3.06 | 3.60 |
| heightcodominant | 0.26 | 2.06 | −3.05 | 3.57 |
| heightdominated | 0.59 | 2.12 | −2.86 | 3.98 |
| heightovertopped | −0.47 | 2.13 | −3.91 | 2.96 |
Figure A1.
(A) Full dataset (N = 514), displaying bark thickness in relation to DBH. (B) Full dataset (N = 514), displaying sapwood moisture content in relation to DBH. (C) Smaller dataset (N = 179), displaying bark thickness in relation to tree height. (D) Smaller dataset (N = 179), displaying sapwood moisture content in relation to tree height.

References
- Honkaniemi, J.; Rammer, W.; Seidl, R. Norway Spruce at the Trailing Edge: The Effect of Landscape Configuration and Composition on Climate Resilience. Landsc. Ecol. 2020, 35, 591–606. [Google Scholar] [CrossRef] [PubMed] [Green Version]
- Landmann, G.; Held, A.; Schuck, A.; Brusselen, J.V. European Forests at Risk; A Scoping Study in Support of the Development of a European Forest Risk Facility; European Forest Institute: Joensuu, Finland, 2015. [Google Scholar] [CrossRef]
- Anonymous. Annual Report of the European Sawmill Industry 2018–2019; Technical Report; European Organisation of the Sawmill Industry: Brussels, Belgium, 2019. [Google Scholar]
- Seidl, R.; Thom, D.; Kautz, M.; Martin-Benito, D.; Peltoniemi, M.; Vacchiano, G.; Wild, J.; Ascoli, D.; Petr, M.; Honkaniemi, J.; et al. Forest Disturbances under Climate Change. Nat. Clim. Chang. 2017, 7, 395–402. [Google Scholar] [CrossRef] [PubMed] [Green Version]
- Raffa, K.F.; Aukema, B.H.; Bentz, B.J.; Carroll, A.L.; Hicke, J.A.; Turner, M.G.; Romme, W.H. Cross-Scale Drivers of Natural Disturbances Prone to Anthropogenic Amplification: The Dynamics of Bark Beetle Eruptions. BioScience 2008, 58, 501–517. [Google Scholar] [CrossRef] [Green Version]
- Boone, C.K.; Aukema, B.H.; Bohlmann, J.; Carroll, A.L.; Raffa, K.F. Efficacy of Tree Defense Physiology Varies with Bark Beetle Population Density: A Basis for Positive Feedback in Eruptive Species. Can. J. For. Res. 2011, 41, 1174–1188. [Google Scholar] [CrossRef]
- Mezei, P.; Grodzki, W.; Blaženec, M.; Škvarenina, J.; Brandýsová, V.; Jakuš, R. Host and Site Factors Affecting Tree Mortality Caused by the Spruce Bark Beetle (Ips typographus) in Mountainous Conditions. For. Ecol. Manag. 2014, 331, 196–207. [Google Scholar] [CrossRef]
- Jakuš, R.; Edwards-Jonášová, M.; Cudlín, P.; Blaženec, M.; Ježík, M.; Havlíček, F.; Moravec, I. Characteristics of Norway Spruce Trees (Picea Abies) Surviving a Spruce Bark Beetle (Ips typographus L.) Outbreak. Trees 2011, 25, 965–973. [Google Scholar] [CrossRef]
- Zolubas, P. Spruce bark beetle (Ips typographus L.) risk based on individual tree parameters. In Proceedings of the International Symposium of IUFRO Kanazawa 2003 “Forest Insect Population Dynamics and Host Influences”, Kanazawa, Japan, 14–19 September 2003; Kanazawa University: Kanazawa, Japan, 2003; p. 2. [Google Scholar]
- Sproull, G.J.; Adamus, M.; Bukowski, M.; Krzyżanowski, T.; Szewczyk, J.; Statwick, J.; Szwagrzyk, J. Tree and Stand-Level Patterns and Predictors of Norway Spruce Mortality Caused by Bark Beetle Infestation in the Tatra Mountains. For. Ecol. Manag. 2015, 354, 261–271. [Google Scholar] [CrossRef]
- Angyalossy, V.; Pace, M.R.; Evert, R.F.; Marcati, C.R.; Oskolski, A.A.; Terrazas, T.; Kotina, E.; Lens, F.; Mazzoni-Viveiros, S.C.; Angeles, G.; et al. IAWA List of Microscopic Bark Features. IAWA J. 2016, 37, 517–615. [Google Scholar] [CrossRef] [Green Version]
- Rosell, J.A.; Olson, M.E.; Anfodillo, T. Scaling of Xylem Vessel Diameter with Plant Size: Causes, Predictions, and Outstanding Questions. Curr. For. Rep. 2017, 3, 46–59. [Google Scholar] [CrossRef]
- Raitanen, J.E.; Järvenpää, E.; Korpinen, R.; Mäkinen, S.; Hellström, J.; Kilpeläinen, P.; Liimatainen, J.; Ora, A.; Tupasela, T.; Jyske, T. Tannins of Conifer Bark as Nordic Piquancy—Sustainable Preservative and Aroma? Molecules 2020, 25, 567. [Google Scholar] [CrossRef] [Green Version]
- Doruska, P.F.; Patterson, D.; Hartley, J.; Hurd, M.; Hart, T. Newer Technologies and Bioenergy Bring Focus Back to Bark Factor Equations. J. For. 2009, 107, 38–43. [Google Scholar]
- Stängle, S.M.; Sauter, U.H.; Dormann, C.F. Comparison of Models for Estimating Bark Thickness of Picea Abies in Southwest Germany: The Role of Tree, Stand, and Environmental Factors. Ann. For. Sci. 2017, 74. [Google Scholar] [CrossRef] [Green Version]
- Rosner, S.; Baier, P.; Kikuta, S.B. Osmotic Potential of Norway Spruce [ Picea abies (L.) Karst.] Secondary Phloem in Relation to Anatomy. Trees 2001, 15, 472–482. [Google Scholar] [CrossRef]
- Stängle, S.M.; Dormann, C.F. Modelling the Variation of Bark Thickness within and between European Silver Fir (Abies Alba Mill.) Trees in Southwest Germany. For. Int. J. For. Res. 2018, 91, 283–294. [Google Scholar] [CrossRef]
- Anderegg, W.R.L.; Hicke, J.A.; Fisher, R.A.; Allen, C.D.; Aukema, J.; Bentz, B.; Hood, S.; Lichstein, J.W.; Macalady, A.K.; McDowell, N.; et al. Tree Mortality from Drought, Insects, and Their Interactions in a Changing Climate. New Phytol. 2015, 208, 674–683. [Google Scholar] [CrossRef]
- Dobbertin, M. Tree Growth as Indicator of Tree Vitality and of Tree Reaction to Environmental Stress: A Review. Eur. J. For. Res. 2005, 124, 319–333. [Google Scholar] [CrossRef]
- Johnstone, D.; Moore, G.; Tausz, M.; Nicolas, M. The Measurement of Plant Vitality in Landscape Trees. Arboric. J. 2013, 35, 18–27. [Google Scholar] [CrossRef]
- Stephenson, N.L.; Das, A.J.; Ampersee, N.J.; Bulaon, B.M.; Yee, J.L. Which Trees Die during Drought? The Key Role of Insect Host-tree Selection. J. Ecol. 2019, 107, 2383–2401. [Google Scholar] [CrossRef]
- Krajnc, L.; Farrelly, N.; Harte, A.M. The Influence of Crown and Stem Characteristics on Timber Quality in Softwoods. For. Ecol. Manag. 2019, 435, 8–17. [Google Scholar] [CrossRef]
- De Groot, M.; Ogris, N. Short-Term Forecasting of Bark Beetle Outbreaks on Two Economically Important Conifer Tree Species. For. Ecol. Manag. 2019, 450, 117495. [Google Scholar] [CrossRef]
- Assmann, E. The Principles of Forest Yield Study: Studies in the Organic Production, Structure, Increment, and Yield of Forest Stands; Pergamon Press: Oxford, UK, 1970. [Google Scholar]
- R Core Team. R: A Language and Environment for Statistical Computing; R Foundation for Statistical Computing: Vienna, Austria, 2020. [Google Scholar]
- Carpenter, B.; Gelman, A.; Hoffman, M.D.; Lee, D.; Goodrich, B.; Betancourt, M.; Brubaker, M.; Guo, J.; Li, P.; Riddell, A. Stan: A Probabilistic Programming Language. J. Stat. Softw. 2017, 76. [Google Scholar] [CrossRef] [Green Version]
- McElreath, R. Rethinking: Statistical Rethinking Book R Package; Chapman and Hall/CRC: London, UK, 2020. [Google Scholar]
- McElreath, R. Statistical Rethinking: A Bayesian Course with Examples in R and Stan, 2nd ed.; Chapman and Hall/CRC: London, UK, 2020. [Google Scholar] [CrossRef]
- Laasasenaho, J.; Melkas, T.; Aldén, S. Modelling Bark Thickness of Picea Abies with Taper Curves. For. Ecol. Manag. 2005, 206, 35–47. [Google Scholar] [CrossRef]
- Musić, J.; Lojo, A.; Balić, B.; Ibrahimspahić, A.; Avdagić, A.; Knežević, J.; Halilović, V. Modelling Bark Thickness of Norway Spruce ( Piceaabies Karst). South-East Eur. For. 2019, 10, 125–135. [Google Scholar] [CrossRef]
- Leclercq, A.; Jourez, B. Modelling Bark Thickness in the Tree in Relation to Silvicultural Treatment; Final Report MA2B-0024; The Station de Recherches Forestieres of the Ministere de la Region Wallonne: Gembloux, Belgium, 1993. [Google Scholar]
- Gričar, J.; Krže, L.; Čufar, K. Number of Cells in Xylem, Phloem and Dormant Cambium in Silver Fir (Abies Alba), in Trees of Different Vitality. IAWA J. 2009, 30, 121–133. [Google Scholar] [CrossRef] [Green Version]
- Esau, K. Development and Structure of the Phloem Tissue. Bot. Rev. 1939, 5, 373–432. [Google Scholar] [CrossRef]
- Petit, G.; Crivellaro, A. Comparative Axial Widening of Phloem and Xylem Conduits in Small Woody Plants. Trees 2014, 28, 915–921. [Google Scholar] [CrossRef]
- Swidrak, I.; Gruber, A.; Oberhuber, W. Xylem and Phloem Phenology in Co-Occurring Conifers Exposed to Drought. Trees 2014, 28, 1161–1171. [Google Scholar] [CrossRef] [Green Version]
- Gričar, J.; Prislan, P.; de Luis, M.; Gryc, V.; Hacurová, J.; Vavrčík, H.; Čufar, K. Plasticity in Variation of Xylem and Phloem Cell Characteristics of Norway Spruce under Different Local Conditions. Front. Plant Sci. 2015, 6. [Google Scholar] [CrossRef] [Green Version]
- Jyske, T.; Hölttä, T. Comparison of Phloem and Xylem Hydraulic Architecture in Picea Abies Stems. New Phytol. 2014, 205, 102–115. [Google Scholar] [CrossRef]
- Gričar, J.; Jagodic, Š.; Šefc, B.; Trajković, J.; Eler, K. Can the Structure of Dormant Cambium and the Widths of Phloem and Xylem Increments Be Used as Indicators for Tree Vitality? Eur. J. For. Res. 2014, 133, 551–562. [Google Scholar] [CrossRef] [Green Version]
- Nicolai, V. Thermal Properties and Fauna on the Bark of Trees in Two Different African Ecosystems. Oecologia 1989, 80, 421–430. [Google Scholar] [CrossRef] [PubMed]
- Anfodillo, T.; Petit, G.; Crivellaro, A. Axial Conduit Widening in Woody Species: A Still Neglected Anatomical Pattern. IAWA J. 2013, 34, 352–364. [Google Scholar] [CrossRef] [Green Version]
- Holtta, T.; Makinen, H.; Nojd, P.; Makela, A.; Nikinmaa, E. A Physiological Model of Softwood Cambial Growth. Tree Physiol. 2010, 30, 1235–1252. [Google Scholar] [CrossRef] [PubMed]
- Eilmann, B.; Weber, P.; Rigling, A.; Eckstein, D. Growth Reactions of Pinus sylvestris L. and Quercus Pubescens Willd. to Drought Years at a Xeric Site in Valais, Switzerland. Dendrochronologia 2006, 23, 121–132. [Google Scholar] [CrossRef]
- Eckmüllner, O.; Sterba, H. Crown Condition, Needle Mass, and Sapwood Area Relationships of Norway Spruce (Picea abies). Can. J. For. Res. 2000, 30, 9. [Google Scholar] [CrossRef]
- Spicer, R.; Gartner, B. The Effects of Cambial Age and Position within the Stem on Specific Conductivity in Douglas-Fir ( Pseudotsuga Menziesii) Sapwood. Trees 2001, 15, 222–229. [Google Scholar] [CrossRef]
- Longuetaud, F.; Mothe, F.; Leban, J.M.; Mäkelä, A. Picea abies Sapwood Width: Variations Trees. Scand. J. For. Res. 2006, 21, 41–53. [Google Scholar] [CrossRef]
- Valentine, H.T.; Mäkelä, A.; Green, E.J.; Amateis, R.L.; Mäkinen, H.; Ducey, M.J. Models Relating Stem Growth to Crown Length Dynamics: Application to Loblolly Pine and Norway Spruce. Trees 2012, 26, 469–478. [Google Scholar] [CrossRef]
- Mattanovich, J.; Ehrenhofer, M.; Schafellner, C.; Tausz, M.; Fuhrer, E. The Role of Sulphur Compounds for Breeding Success of Ips Typographus L. (Col., Scolytidae) on Norway Spruce (Picea abies [L.] Karst.). J. Appl. Entomol. 2001, 125, 425–431. [Google Scholar] [CrossRef]
- Jandl, R. Climate-Induced Challenges of Norway Spruce in Northern Austria. Trees For. People 2020, 1, 100008. [Google Scholar] [CrossRef]
- Toth, D.; Maitah, M.; Maitah, K.; Jarolínová, V. The Impacts of Calamity Logging on the Development of Spruce Wood Prices in Czech Forestry. Forests 2020, 11, 283. [Google Scholar] [CrossRef] [Green Version]
Figure 1.
(A) The effect of site on bark thickness using parameter posterior distribution, with and without tree height. (B) The effect of site on sapwood moisture content, using parameter posterior distribution, with and without tree height.
Figure 1.
(A) The effect of site on bark thickness using parameter posterior distribution, with and without tree height. (B) The effect of site on sapwood moisture content, using parameter posterior distribution, with and without tree height.

Figure 2.
(A) The effect of diameter on bark thickness across crown social classes, model without tree height, showing posterior distributions. (B) The effect of diameter on bark thickness across crown social classes, model with tree height, showing posterior distributions. Different colors represent different crown social classes.

Figure 3.
(A) The effect of diameter on sapwood moisture content across crown social classes, model without tree height, showing posterior distributions. (B) The effect of diameter on sapwood moisture content across crown social classes, model with tree height, showing posterior distributions. Different colors represent different crown social classes.

Figure 4.
(A) The effect of crown social class on bark thickness, model without tree height, showing posterior distribution and a proportion of positive values for each distribution. (B) The effect of crown social class on bark thickness, model with tree height, showing posterior distribution and a proportion of positive values for each distribution. Different colors represent different crown social classes.

Figure 5.
(A) The effect of crown social class on sapwood moisture content, model without tree height, showing posterior distribution and a proportion of positive values for each distribution. (B) The effect of crown social class on sapwood moisture content, model with tree height, showing posterior distribution and a proportion of positive values for each distribution. Different colors represent different crown social classes.

Figure 6.
(A) The effect of tree height on bark thickness across crown social classes, showing posterior distributions. (B) The effect of tree height on sapwood moisture content across crown social classes, showing posterior distributions. Different colors represent different crown social classes.
Figure 6.
(A) The effect of tree height on bark thickness across crown social classes, showing posterior distributions. (B) The effect of tree height on sapwood moisture content across crown social classes, showing posterior distributions. Different colors represent different crown social classes.

Table 1.
Prior distributions for the four models, showing distribution type for each parameter with a mean value and standard deviation in brackets where relevant.
Table 1.
Prior distributions for the four models, showing distribution type for each parameter with a mean value and standard deviation in brackets where relevant.
| Model No. | ||||
|---|---|---|---|---|
| 1 | 2 | 3 | 4 | |
| Outcome (Y) | ||||
| Parameters | Bark Thickness | Moisture Content | Bark Thickness | Moisture Content |
| Normal(10, 3) | Normal(150, 25) | Normal(10, 3) | Normal(150, 25) | |
| Normal(0, 3) | Normal(0, 25) | Normal(0, 3) | Normal(0, 25) | |
| Normal(0, 0.05) | Normal(0, 5) | Normal(0, 0.05) | Normal(0, 5) | |
| Normal(0, 3) | Normal(0, 25) | Normal(0, 3) | Normal(0, 25) | |
| Normal(0, 0.05) | Normal(0, 5) | Normal(0, 0.05) | Normal(0, 5) | |
| / | / | Normal(0, 0.05) | Normal(0, 5) | |
| / | / | Normal(0, 0.05) | Normal(0, 5) | |
| Exponential(3) | Exponential(25) | Exponential(3) | Exponential(25) | |
Table 2.
Tree properties, displaying number of trees (N), mean values of diameter at breast height (DBH), bark thickness (BT), and sapwood moisture content (SMC) by site and crown social class. Coefficient of variation in brackets.
Table 2.
Tree properties, displaying number of trees (N), mean values of diameter at breast height (DBH), bark thickness (BT), and sapwood moisture content (SMC) by site and crown social class. Coefficient of variation in brackets.
| Site | Crown Social Class | N | DBH | BT | SMC |
|---|---|---|---|---|---|
| Jatna | predominant | 43 | 49.2 (14) | 12.1 (18) | 183.4 (6) |
| dominant | 66 | 42.5 (15) | 11.1 (18) | 180.0 (6) | |
| co-dominant | 83 | 34.5 (18) | 10.1 (19) | 170.4 (10) | |
| dominated | 43 | 24.9 (20) | 8.2 (21) | 148.5 (17) | |
| overtopped | 34 | 18.4 (27) | 7.1 (25) | 135.2 (20) | |
| Pohorje | predominant | 21 | 56.2 (17) | 15.4 (22) | 173.7 (10) |
| dominant | 92 | 48.1 (18) | 13.5 (20) | 167.9 (12) | |
| co-dominant | 81 | 36.5 (19) | 11.6 (18) | 158.5 (15) | |
| dominated | 22 | 24.6 (19) | 9.1 (22) | 137.6 (15) | |
| overtopped | 29 | 15.2 (24) | 7.1 (16) | 112.3 (17) |
Note: DBH in cm, BT in mm, SMC in percent.
Table 3.
Tree properties, displaying mean values of diameter at breast height (DBH), bark thickness (BT), sapwood moisture content (SMC), and tree height (H) by site and crown social class. Coefficient of variation in brackets.
Table 3.
Tree properties, displaying mean values of diameter at breast height (DBH), bark thickness (BT), sapwood moisture content (SMC), and tree height (H) by site and crown social class. Coefficient of variation in brackets.
| Site | Crown Social Class | N | DBH | BT | SMC | H |
|---|---|---|---|---|---|---|
| Jatna | predominant | 22 | 52.5 (12) | 12.3 (16) | 182.9 (5) | 32.9 (7) |
| dominant | 35 | 43.9 (16) | 11.2 (19) | 180.7 (5) | 31.2 (7) | |
| co-dominant | 47 | 34.8 (20) | 10.5 (20) | 167.9 (11) | 27.5 (10) | |
| dominated | 24 | 25.0 (19) | 8.3 (21) | 143.7 (17) | 22.4 (12) | |
| overtopped | 17 | 18.3 (28) | 6.9 (24) | 133.1 (17) | 16.4 (29) | |
| Pohorje | predominant | 2 | 58.0 (19) | 15.0 (19) | 176.3 (3) | 30.0 (3) |
| dominant | 10 | 47.6 (18) | 13.6 (14) | 172.0 (8) | 27.0 (14) | |
| co-dominant | 14 | 35.5 (22) | 10.6 (13) | 162.7 (13) | 22.9 (12) | |
| dominated | 4 | 24.6 (24) | 9.0 (20) | 140.3 (15) | 18.9 (27) | |
| overtopped | 4 | 16.2 (33) | 7.5 (28) | 118.6 (28) | 9.2 (35) |
Note: DBH in cm, BT in mm, SMC in percents, H in m.
Publisher’s Note: MDPI stays neutral with regard to jurisdictional claims in published maps and institutional affiliations. |
© 2020 by the authors. Licensee MDPI, Basel, Switzerland. This article is an open access article distributed under the terms and conditions of the Creative Commons Attribution (CC BY) license (http://creativecommons.org/licenses/by/4.0/).
Share and Cite
MDPI and ACS Style
Krajnc, L.; Gričar, J. The Effect of Crown Social Class on Bark Thickness and Sapwood Moisture Content in Norway Spruce. Forests 2020, 11, 1316. https://doi.org/10.3390/f11121316
AMA Style
Krajnc L, Gričar J. The Effect of Crown Social Class on Bark Thickness and Sapwood Moisture Content in Norway Spruce. Forests. 2020; 11(12):1316. https://doi.org/10.3390/f11121316
Chicago/Turabian StyleKrajnc, Luka, and Jožica Gričar. 2020. "The Effect of Crown Social Class on Bark Thickness and Sapwood Moisture Content in Norway Spruce" Forests 11, no. 12: 1316. https://doi.org/10.3390/f11121316
Note that from the first issue of 2016, this journal uses article numbers instead of page numbers. See further details here.