Article

Retrieval of Vertical Mass Concentration Distributions—Vipava Valley Case Study

1
Center for Atmospheric Research, University of Nova Gorica, 5270 Nova Gorica, Slovenia
2
Slovenian Environment Agency, 1000 Ljubljana, Slovenia
3
Department of Civil and Environmental Engineering, University of Iowa, Iowa City, IA 52242, USA
4
Jožef Stefan Institute, 1000 Ljubljana, Slovenia
5
Geological Survey of Slovenia, 1000 Ljubljana, Slovenia
6
Aerosol d.o.o., 1000 Ljubljana, Slovenia
*
Author to whom correspondence should be addressed.
Remote Sens. 2019, 11(2), 106; https://doi.org/10.3390/rs11020106
Submission received: 2 December 2018 / Revised: 23 December 2018 / Accepted: 4 January 2019 / Published: 9 January 2019
(This article belongs to the Special Issue Remote Sensing of Air Quality)

Abstract

:
Aerosol vertical profiles are valuable inputs for the evaluation of aerosol transport models, in order to improve the understanding of aerosol pollution ventilation processes which drive the dispersion of pollutants in mountainous regions. With the aim of providing high-accuracy vertical distributions of particle mass concentration for the study of aerosol dispersion in small-scale valleys, vertical profiles of aerosol mass concentration for aerosols from different sources (including Saharan dust and local biomass burning events) were investigated over the Vipava valley, Slovenia, a representative hot-spot for complex mixtures of different aerosol types of both anthropogenic and natural origin. The analysis was based on datasets taken between 1–30 April 2016. In-situ measurements of aerosol size, absorption, and mass concentration were combined with lidar remote sensing, where vertical profiles of aerosol concentration were retrieved. Aerosol samples were characterized by SEM-EDX, to obtain aerosol morphology and chemical composition. Two cases with expected dominant presence of different specific aerosol types (mineral dust and biomass-burning aerosols) show significantly different aerosol properties and distributions within the valley. In the mineral dust case, we observed a decrease of the elevated aerosol layer height and subsequent spreading of mineral dust within the valley, while in the biomass-burning case we observed the lifting of aerosols above the planetary boundary layer (PBL). All uncertainties of size and assumed optical properties, combined, amount to the total uncertainty of aerosol mass concentrations below 30% within the valley. We have also identified the most indicative in-situ parameters for identification of aerosol type.

Graphical Abstract

1. Introduction

Air pollution by particulate matter (PM) is one of the known causes of health-related problems [1,2], particularly in regions with a dense population and poor ventilation, where high aerosol concentrations can be present during long periods of time. Such local air pollution hot-spots with strong vertical aerosol gradients in the lower troposphere can also form in basin valleys surrounded by mountains, under stable atmospheric conditions with weak air circulation and high anthropogenic activity. Continuous emission from local sources and a limited extent of vertical mixing can influence horizontal mixing [3], thus increasing PM concentrations close to the surface everywhere within the valley. Pollution levels can be reduced by the occurrence of downslope winds, capable of inducing circulation that lifts PM and trace gases above the ridges and into the free troposphere [4], thus increasing vertical aerosol exchange [5,6]. Measurements of vertical distributions of PM concentration, as well as the understanding of vertical mixing processes, provide an important input for understanding the dispersion of aerosols from local pollution sources and effective control of air quality in the valley.
In the last decade, a number of field measurement campaigns, focusing on air pollution in valley regions, have been conducted; for example, in the Po valley in Italy [7,8,9,10,11], where they used in-situ measurements to study PM concentration at ground level. The vertical profiles of PM concentration were collected by balloon or aircraft measurements [12,13,14]. In a number of cases, PM concentration profiles were also estimated from lidar measurements, by multiplying a conversion factor to convert lidar-derived optical properties into mass concentration; which need to be assumed, based on the additional sampling of aerosol properties, such as identified aerosol types [15]. Among these cases, due to the insufficient information on aerosol properties available, the uncertainties of PM concentrations were either large or not understood [15], and so these models are, in general, not suitable for investigation of aerosol dispersion on small scales.
Our study uses the Vipava valley (Slovenia), located 30 km inland from the Adriatic coast (at the port town of Trieste, Italy), as a representative example of a narrowly confined aerosol hot-spot. Local emissions of primary anthropogenic aerosols are dominated by biomass burning (BB); especially in the winter, as BB is the main source of heating. Traffic emissions are present throughout the year. The Vipava valley is frequently affected by the long range transport of aged Saharan dust, which mixes with local anthropogenic aerosols. Due to a variety of possible aerosol sources and complex terrain configuration, this region provides an ideal location for the study of the mixtures of different aerosol types and their vertical distributions. In contrast to previous studies, the aim of this work was to provide vertical distributions of particle mass concentration with an accuracy that would allow us to investigate aerosol dispersion in small scale valleys. Vertical PM distributions were retrieved from elastic lidar data, in combination with in-situ measurements of aerosol size, mass concentration, and light absorption within and above the valley. Through an analysis of selected case studies, several new approaches have been exploited using a combination of different measurements, which includes identification of aerosol types by combining different information on aerosol properties; investigation whether the vertical profiles can correctly represent the small scale region; and investigation of the processes of long-range aerosol flow into the valley, as well as their contribution. This provides the possibility to investigate the vertical mixing influence on PM concentration on the surface.

2. Methodology

2.1. Experimental Sites

Measurements took place from 1–30 April 2016 at two stations, one at the town of Ajdovščina (45.93°N, 13.91°E) in the center of the Vipava valley (125 m a.s.l.), and the other at the village of Otlica on the adjacent mountain range (951 m a.s.l.), 5 km of straight-line distance from Ajdovščina. During this period, the prevailing wind direction was from NE to SE, down along the valley (Figure 1).

2.2. Instrumentation

In-situ measurements of aerosol size, mass concentration, and light absorption were combined with lidar remote sensing. Lidar measurements provided high spatial and temporal resolution light backscattering data [16], which revealed vertical particle distribution.

2.2.1. Lidar

Backscatter coefficients, PBL height, and the heights of elevated aerosol layers were obtained from Mie-scattering lidar data. The device, developed at University of Nova Gorica, used infrared laser pulses (1064 nm) with a repetition rate of 10 Hz to observe the troposphere at heights between 0.2 and 10 km in daytime conditions, where it achieved a vertical spatial resolution of 3.75 m. Details of lidar configuration and performance are described in [17]. In this campaign, lidar was deployed at Ajdovščina and set at an elevation angle of 30°. Each measurement was an average of 10 laser shots, resulting in a sampling rate of 1 Hz. The profiles of backscatter coefficients were calculated for 30 min intervals, and smoothed with a height window of 15 m.

2.2.2. In-Situ Instruments

In-situ measurements of aerosols were performed at two locations, at Ajdovščina and at Otlica. The Ajdovščina site was expected to be mainly influenced by local sources, while the Otlica site, in the absence of local sources, was expected to be indicative of aerosols transported from other regions. The use of two vertically displaced stations also enabled us to check the state of the aerosol vertical mixing as well. At Ajdovščina, aerosol optical absorption, particle size distribution, and mass concentration were monitored by the Magee Scientific Aethalometer (AE-33, Magee Scientific, https://mageesci.com/our-products/ae33/) and by the GRIMM optical particle counter (OPC) (CNR Grimm 1.109, GRIMM Aerosol Technik, https://www.eufar.net/instruments/415). Another aethalometer of the same type was installed at Otlica.
The AE-33 aethalometer is a filter-based photometer, which measures optical absorption at 7 wavelengths (370, 470, 520, 590, 660, 880, and 950 nm), once per minute. Gradual accumulation of light absorbing carbonaceous aerosols on the filter causes an increase in light attenuation. Black carbon (BC) mass concentration was calculated using the measurements of light attenuation increase rate at 880 nm, based on the procedure described in [18]. BC source apportionment, featured in the AE-33, uses the aethalometer model [19] and is based on the source-specific dependence of light absorption by aerosols. The absorption Ångström exponent (AAE) between 470 and 950 nm was used to discriminate BC related to BB from BC related to traffic [19]. Fresh BC from diesel exhaust is assumed to have an AAE close to 1 [20], whereas BB aerosols show an enhancement of light absorption at shorter wavelengths, and thus have a higher value of AAE. The uncertainty of aethalometer measurements depends on the uncertainties of the mass absorption cross-section, the multiple scattering parameter, cross-sensitivity to scattering, and instrument variability. The uncertainty for the determination of BC was estimated to be 30% [21]. Uncertainty for the determination of AAE was found to be about 10% [18].
The GRIMM OPC provided particle concentrations in 31 selected bins between 0.25 and 32 μ m, as well as particle masses in the specified size ranges according to predefined parameters (refractive index and the constant of mass efficiency, which depends on particle size and density). Calibration of the size channels in the OPC using a large real part of the refractive index ( m = 1.59 ) may result in an underestimate of aerosol size, of up to 50% [22]. To minimize this error, OPC size channels were further corrected to account for the ambient aerosol refractive index. For coarse aerosols (>1 μ m), the refractive index was taken to be ( m = 1.53 0.008 i ), and for fine aerosols (≤1 μ m) it was taken to be ( m = 1.48 0.034 i ) [12]. After the calibration, the uncertainty of aerosol size can be reduced to less than 1% [23]. The density of coarse aerosols was assumed to be approximately 2.62 g/cm 3 [24], while the density of fine aerosols was assumed as to be 1.8 g/cm 3 [12,25]. Although the obtained particle mass concentration was not standardized, it provided an important reference for the evaluation of lidar results. For the purpose of this study, mass concentrations of particles with diameter below 1 μ m (PM 1 ) and 10 μ m (PM 10 ) were used for further analysis.

2.2.3. Meteorological Measurements

Wind and rain sensors were co-located with lidar, and the collected data was used in order to better classify the type of predominant aerosols in different episodes. To obtain vertical profiles of meteorological data (temperature, pressure, relative humidity, wind speed, and direction), radiosonde measurements were obtained from two radiosonde launch stations, at Ljubljana (50 km away), providing data at 5:00 CET on 6 April 2016 by the Slovenian Environmental Agency (ARSO), and at Udine (67 km away), providing data at 01:00 CET on 6 April 2016. Despite moderate horizontal displacement of both radiosonde sites from our measurement area, comparable results indicate that the atmospheric vertical structure in the free atmosphere above the Vipava valley, which is located between them, can be well described by the available radiosonde data [26,27]. We used HYSPLIT backward trajectory (http://www.ready.noaa.gov) analysis to investigate the long-range transport of air masses. The Dust Regional Atmospheric Modeling (DREAM) (http://www.bsc.es/ESS/bsc-dust-daily-forecast), which provides dust forecasts over the Mediterranean region, was used to select dedicated observation periods.

2.3. Sampling and Microscopy

Aerosol samples were collected using an electrostatic precipitator (GRIMM Nano 5.705-5.706, http://wiki.grimm-aerosol.de/index.php?title=NANO-5705-5706) with a flow of 0.5 lpm on nuclepore filter substrates. Particles deposited by wet deposition were sampled by filtering collected rainwater through nuclepore filters (80 nm pore diameter) using a syringe. Filter substrates were then left for a few hours to dry out, and then were stored in a fridge until microscopy analysis was performed. Individual aerosol particles were analyzed using a field emission gun scanning electron microscope (FEG SEM) (JEOL JSM 7100F TTLS, JEOL Ltd., Japan), coupled with an energy-dispersive X-ray (EDX) system (X-Max Large Area Analytical Silicon Drift Detector, Oxford Instruments, UK). Nuclepore filters were coated with a 5 nm thick layer of Au-Pd. SEM-EDX acquisitions were performed under high vacuum at 15 keV accelerating voltage. Micrographs were acquired by a secondary electron detector at 5–10 mm working distance. EDX analysis was performed at 10 mm working distance with acquisition time of 50 to 150 s. Due to the composition of the filter material, elements C and O were omitted from interpretation of particle elemental analyses. Carbonaceous aerosols were distinguished from mineral particles, based on particle morphology and the presence of trace elements. Other (non carbon) pollutants were identified directly, based on the elements they contain. The manuscript was modified to clarify this point.

2.4. Retrieval of Mass Concentration Profiles

Vertical information on aerosol loading was obtained from lidar data. Temporal evolution of the logarithmic range square-corrected signal with 1 s resolution was used as an indicator for relative change in aerosol loading. The aerosol backscatter coefficient profile was retrieved using the Klett algorithm for a single elastic signal [28]. The PBL height was taken to correspond to the height of the largest backscatter coefficient gradient [29,30]. Because of the behavior of atmospheric stratification over complex terrain, the top of the PBL may sometimes not be associated with the strongest gradients, which introduces a large uncertainty when applying standard methods for homogeneous terrain to determine the PBL height. If thus obtained PBL height was overestimated, as compared to radiosonde, the strongest gradient in the backscatter was not considered as the PBL height. In this case, we manually decreased the PBL height to where the gradient was closer to the ground, and the value where the backscatter coefficient just above the PBL is less than 0.002 · 10 3 km 1 sr 1 . Structures with increased aerosol loading above the PBL were considered as residual (or elevated) aerosol layers. PBL height uncertainty, in our case, originates from data averaging and was estimated to be about 10%. Periods where the PBL height could not be identified, due to turbulent atmospheric behavior, were removed from the analysis and represent less than 5% of the total data sample. In the case of well-mixed PBL, the backscattering signals within the PBL are generally constant with height, except for the presence of strong convection. Maximal vertical convection was estimated by the fraction between aerosol loading 200 m above the surface (lidar) and at the ground level (in-situ). Vertical mass concentration profile of particulate matter can be estimated by combining lidar and particle-size distribution measurements, based on the relationship between the PM and the backscatter coefficient [31] as
PM 10 lidar ( z ) = β ( z ) · LR MEE = β ( z ) β OPC · PM 10 .
β ( z ) was obtained by lidar, while PM 10 and β OPC were obtained by the OPC measurements. The lidar ratio between the extinction and the backscatter coefficient α OPC / β OPC (LR), and the conversion parameter between the extinction coefficient and mass concentration α OPC / PM 10 (MEE) are both related to the aerosol size and scattering properties, and were used to study aerosol types, which can be obtained by the OPC measurements as well. While the PM 10 is directly measured by the OPC, the backscatter coefficient β OPC , the extinction coefficient α OPC , and the absorption coefficient b OPC can also be obtained as
ξ OPC = r m i n r m a x π r 2 Q i ( r , λ , m ) N ( r ) d r ,
where the N ( r ) is the number-concentration of particles in a given radius r, and ξ is either α , β or b. Q i is either the Mie extinction, backscatter, or absorption efficiency, depending on r, refractive index m = n k i , and wavelength of the incident light λ [32]. OPC-based parameters were determined for each observation period separately. In our case, the integral was approximated by a sum over number-concentrations, measured in all 31 OPC channels.

Uncertainties

While the conversion from the backscatter coefficient into aerosol mass concentration does not depend on aerosol concentration, changes in aerosol size distribution and type introduce uncertainties which need to be estimated. In our experiments, we assumed aerosol size and type to be almost the same throughout the PBL, due to vertical mixing within a narrow, closed valley. The assumption was verified by comparing the AAE obtained at the valley floor to AAE on the valley rim at Otlica. AAE values were found to be almost the same, which implies aerosols at both sites were from the same primary source from within the valley, which means the same lidar ratio as well. The uncertainty, estimated by the difference of AAE at Ajdovščina and Otlica for the entire dataset, was found to be below 15%. Above the valley, the uncertainty of the retrieved mass concentration can be larger, because particles above the PBL may be of a different type. In Case 1, where an elevated aerosol layer was present, the aerosols in this layer were identified as mineral dust from Northern Africa, so above the PBL, MEE of 1.7 ± 0.2 m 2 /g and LR of 50 ± 10 sr [15] were used for the conversion factor. Recent studies have shown that aerosol morphology can cause biases on the estimation of aerosol optical properties, such as the extinction and absorption coefficients [25,33]; however, Mie calculation was found to give a reasonable estimation of particle optical properties for non-spherical mineral dust and BC aggregates with systematic uncertainty on the order of 12% [34].
Another large source of uncertainty is the refractive index m, used to obtain Q i . Its value was adopted from studies with comparable aerosol types and absorption coefficient values, which are referenced episode-by-episode in the campaign overview. Within the valley, we chose m = 1.48 ( 0.035 0.045 ) i for BB episodes, as well as for the mixture of different anthropogenic aerosols from traffic and BB sources [35,36,37]. For the mixture of Saharan dust with local anthropogenic aerosols, the refractive index was chosen to be 1.53 ( 0.02 0.04 ) i [14]. The uncertainty of the refractive index was assumed to be approximately equal to the uncertainty of the absorption coefficient, which was estimated by the difference between the OPC ( b OPC ) and the aethalometer ( b AE 33 ) obtained the value of the absorption coefficient,
u m u b = | b AE 33 b OPC | b OPC .
In our case, it was found to be less than 20%. The uncertainty of β ( z ) , which originates from the Klett inversion algorithm, was also considered. If the predominant aerosol type is known [24,31], as was the case in our experiment, it is on the order of 4%. All the above uncertainties, combined, amount to the total uncertainty of PM 10 lidar , below 30% within the valley.

2.5. Retrieval of Aerosol Optical Properties

In addition to microscopy, aerosols were also studied by their optical properties: Absorption Ångström exponent (AAE), mass extinction efficiency (MEE), and lidar ratio (LR), retrieved from the OPC and aethalometer data. Aerosols with a larger absorption at shorter wavelength have higher values of the AAE, which was obtained from absorption measurements at two different wavelengths ( λ 1 = 470 n m and λ 2 = 950 n m ) by an aethalometer [19] as
b a b s ( λ 1 ) b a b s ( λ 2 ) = λ 1 λ 2 AAE .
In our case, AAE was used to estimate the source of BC aerosols. According to [19,38], for AAE ≦ 1, BC aerosols were considered to originate solely from traffic, and for AAE ≧ 1.7, solely from BB. Measured AAE for aged aerosols can also be affected by the formation of secondary organic aerosols [39,40] and the mixing state of the BC particles [25,34,41].

2.6. Compatibility of the Datasets

In order to correctly retrieve aerosol properties and mass concentrations from combined lidar, OPC, and aethalometer data, we compared all three datasets. While OPC and aethalometer data represent aerosol properties in the same experimental volume, lidar data represents the profile starting from 200 m above the ground. In the comparison of one month’s OPC and aethalometer data (the absorption coefficient at 950 nm, calculated from OPC data [32], was compared with the absorption coefficient at 950 nm measured by aethalometer), the fan-like correlation was found to be 0.76 (Figure 2a) with the slope of 1 on the valley floor. Scattering around the regression line is caused mainly by a fixed mean refractive index applied to the aerosol mixture (mineral dust, traffic emissions, BB aerosols, and others), for the purpose of this validation. In the comparison of the OPC and lidar data (PM 10 10 m above the ground and PM 10 lidar 200 m above the ground) the correlation was found to be 0.65 (Figure 2b). Outlying points may be due to several individual aerosol sources on the mountainside. Typical time needed for the aerosols to spread from the source to throughout the PBL is from 10 to 20 min [42]. In our case, all the data was averaged over 30 min to ensure the same aerosol type and size throughout the PBL. With primary sources on the valley floor, aerosol concentrations were expected to decrease with the height, even in the well-mixed layer, since the vertical transport by thermally driven circulation decreases with height. Based on the entire dataset, PM 10 concentrations at 200 m (well within the PBL, and much lower than our upper monitoring site at Otlica) were found to be about 42% of those just above the ground.

3. Results and Discussion

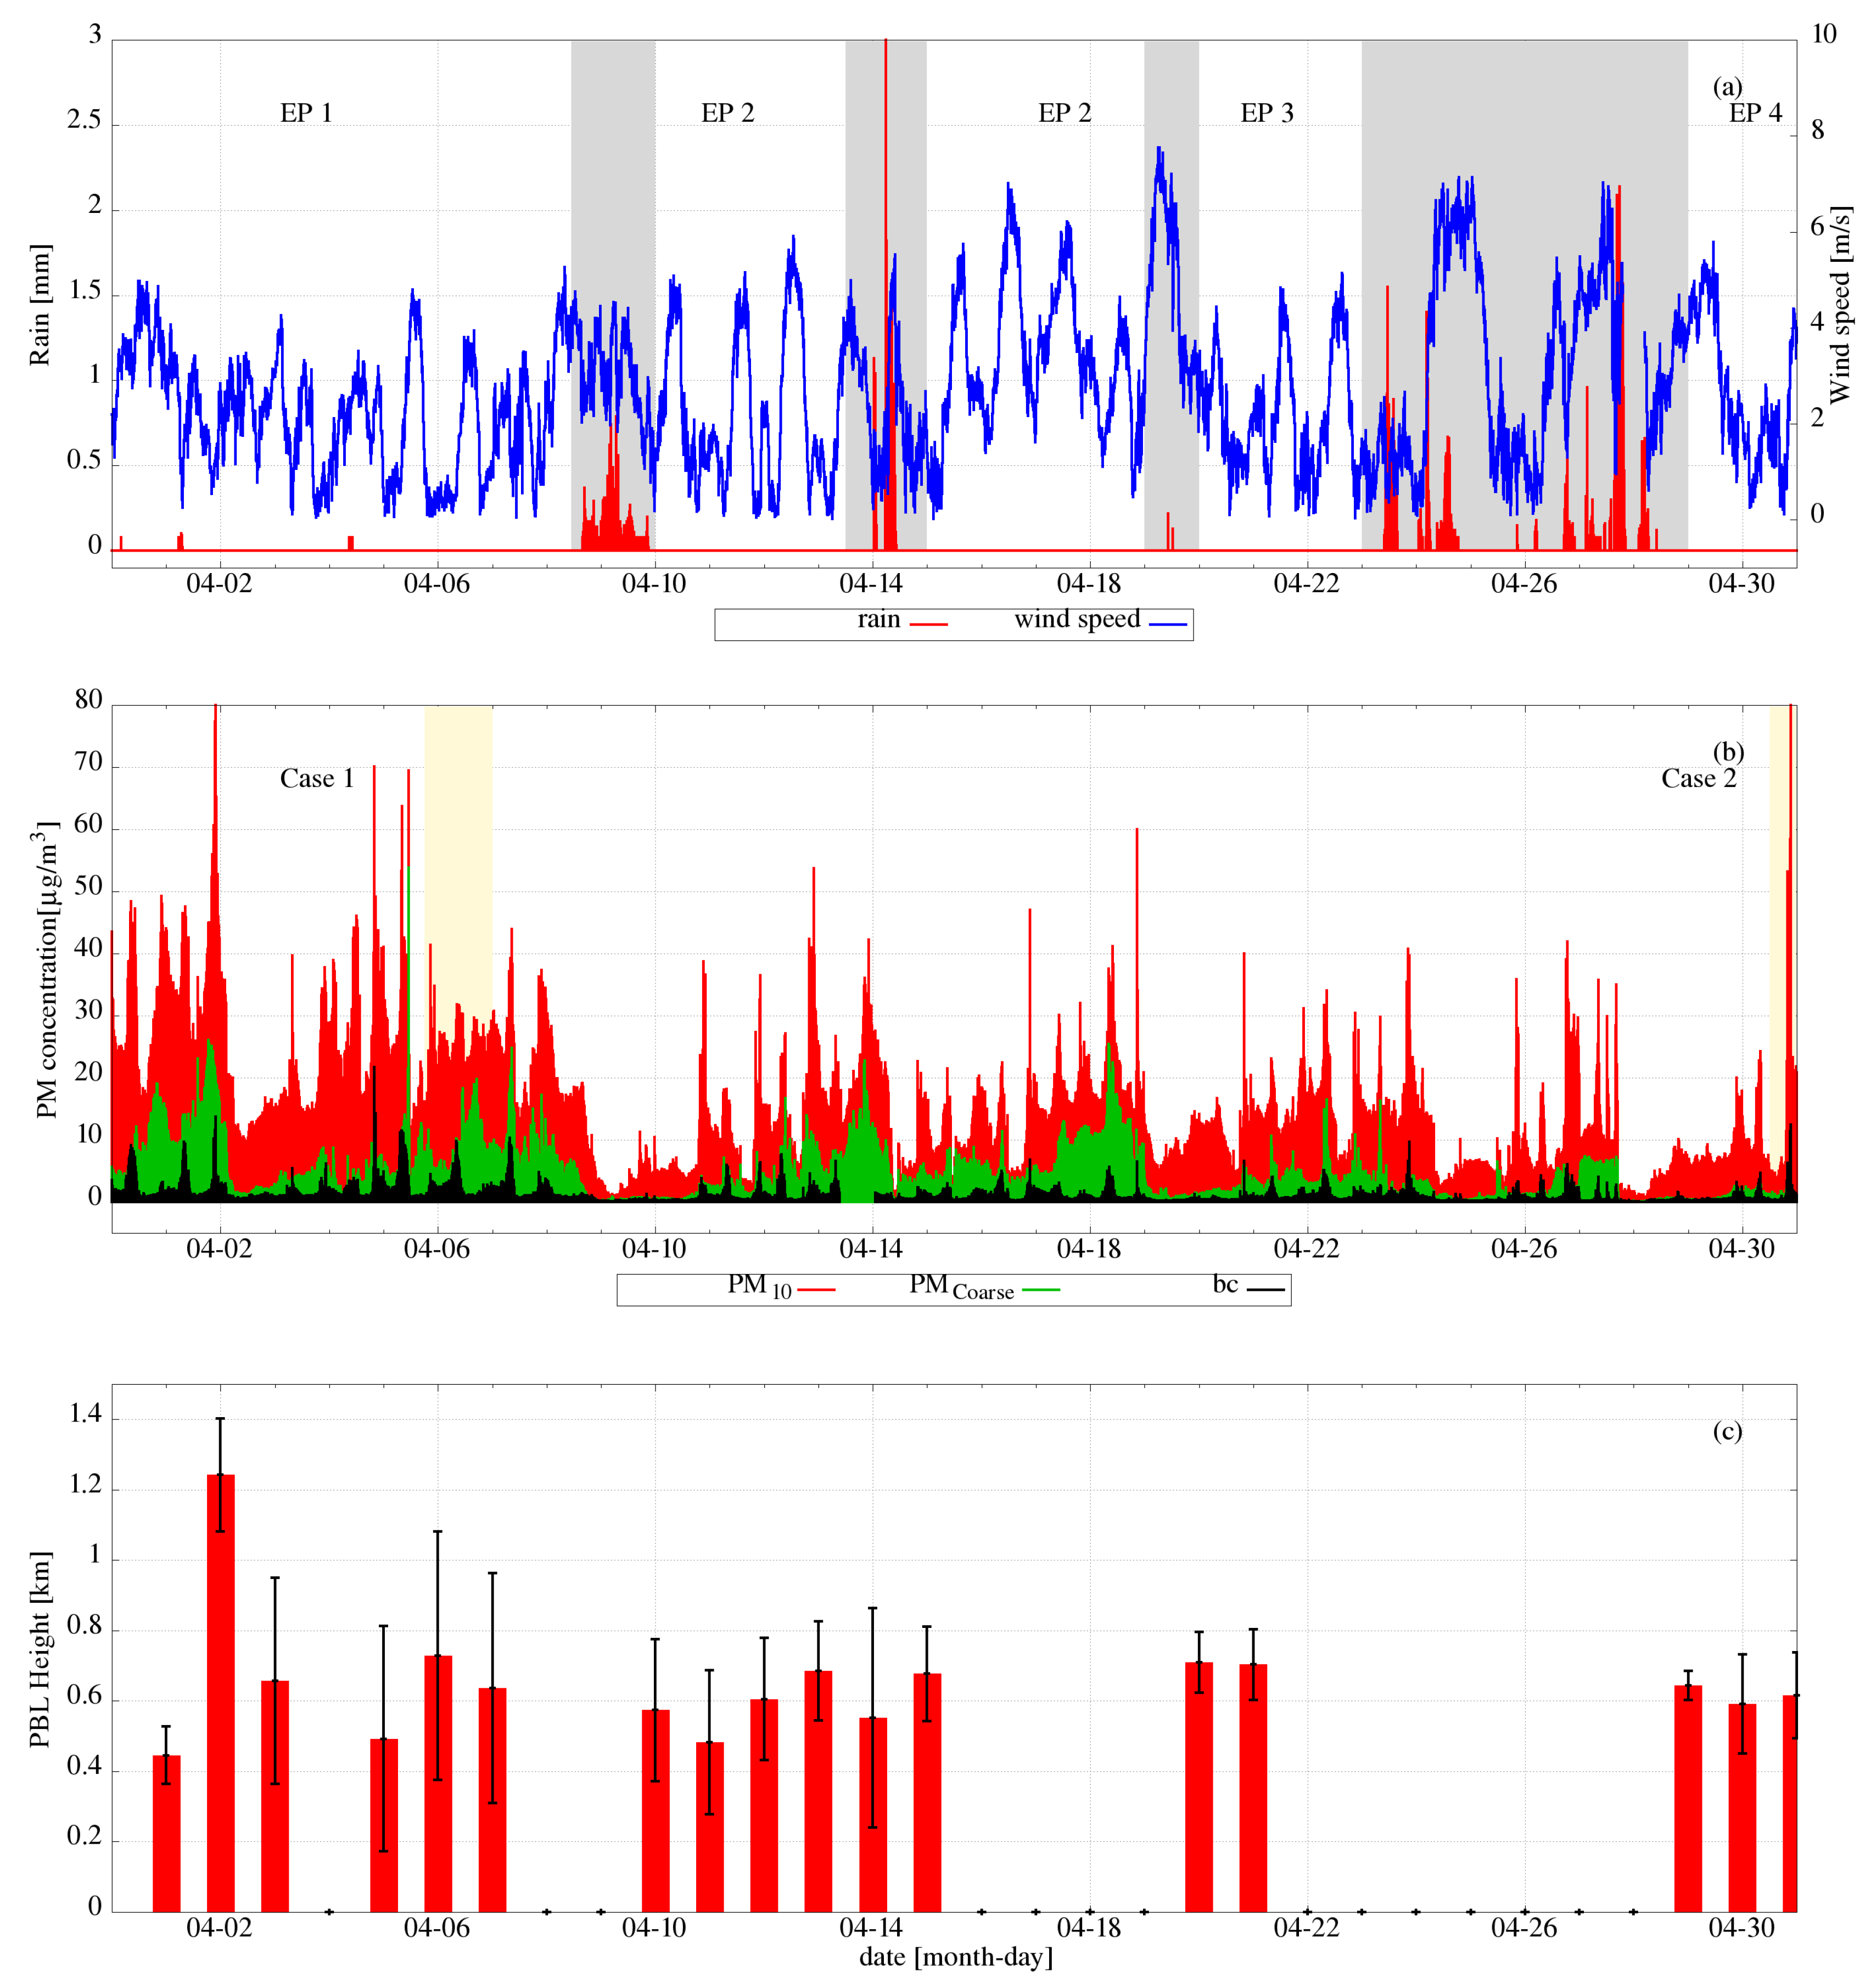
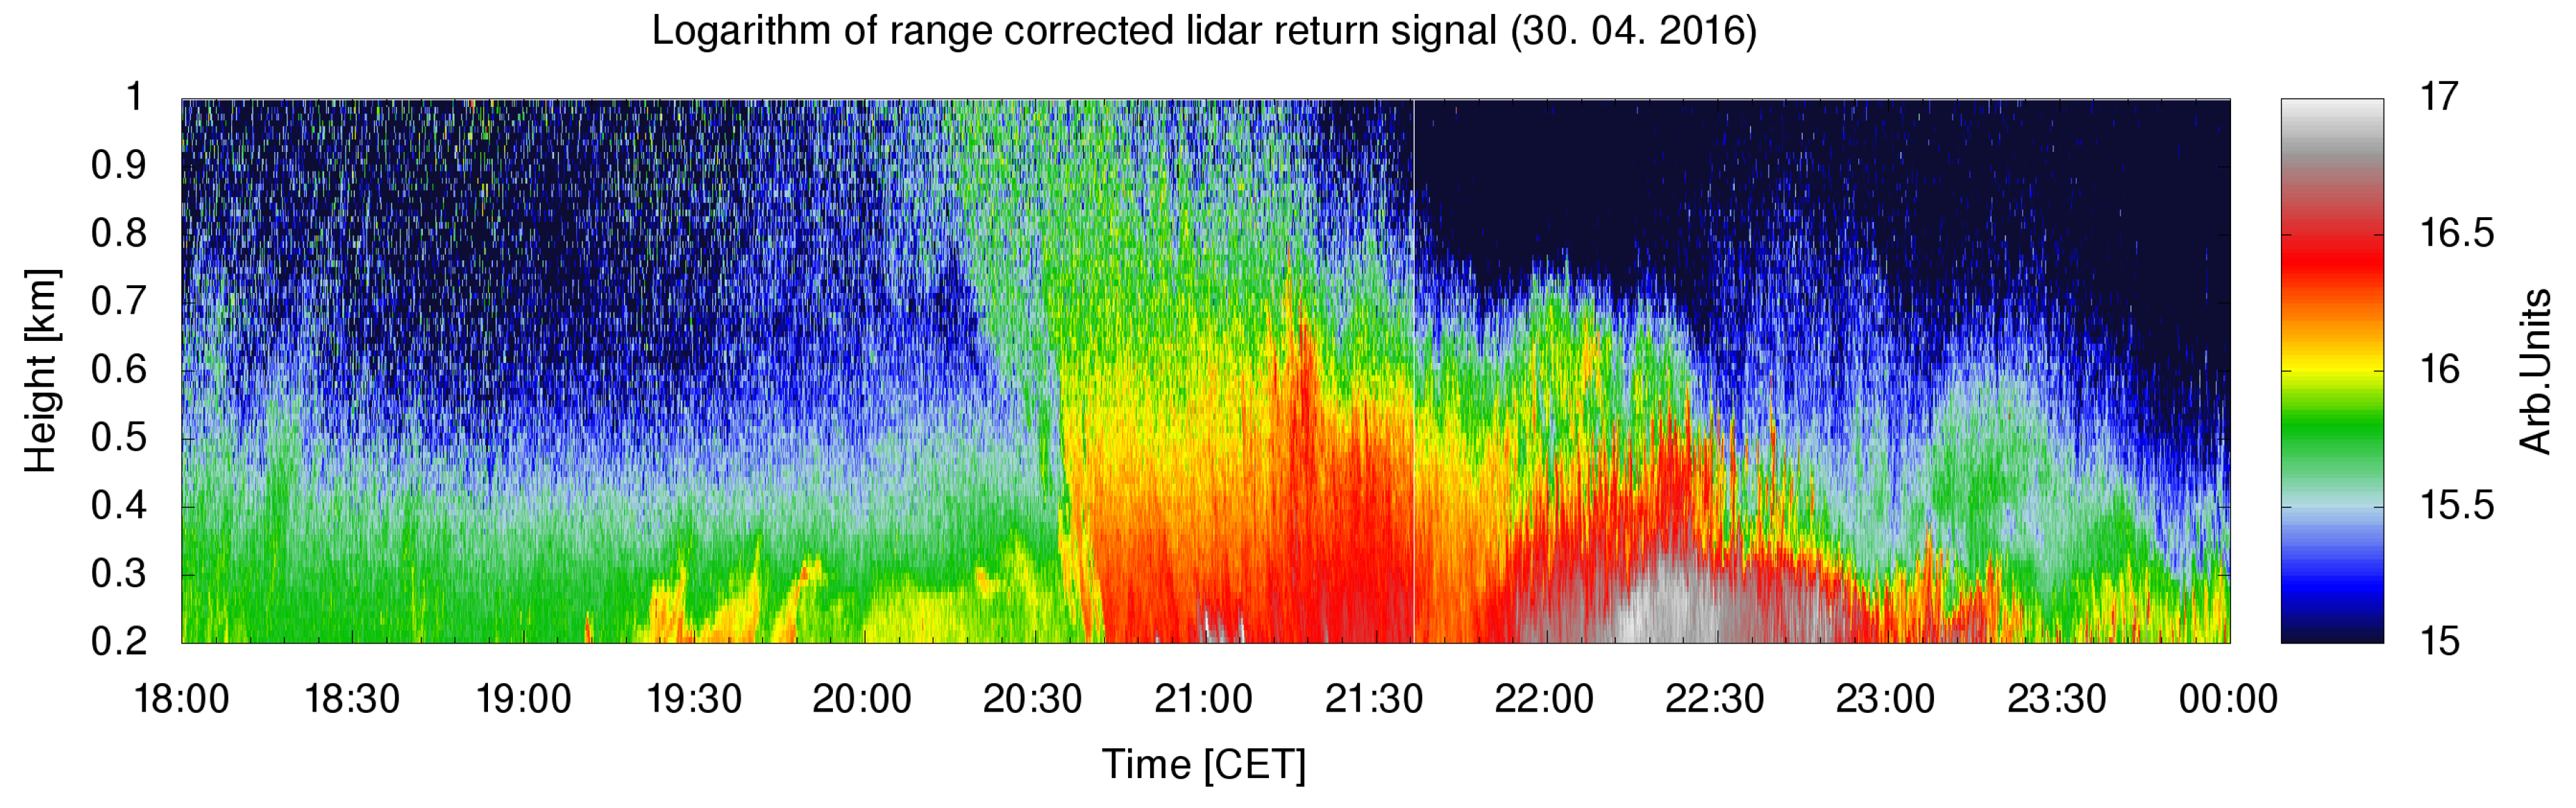
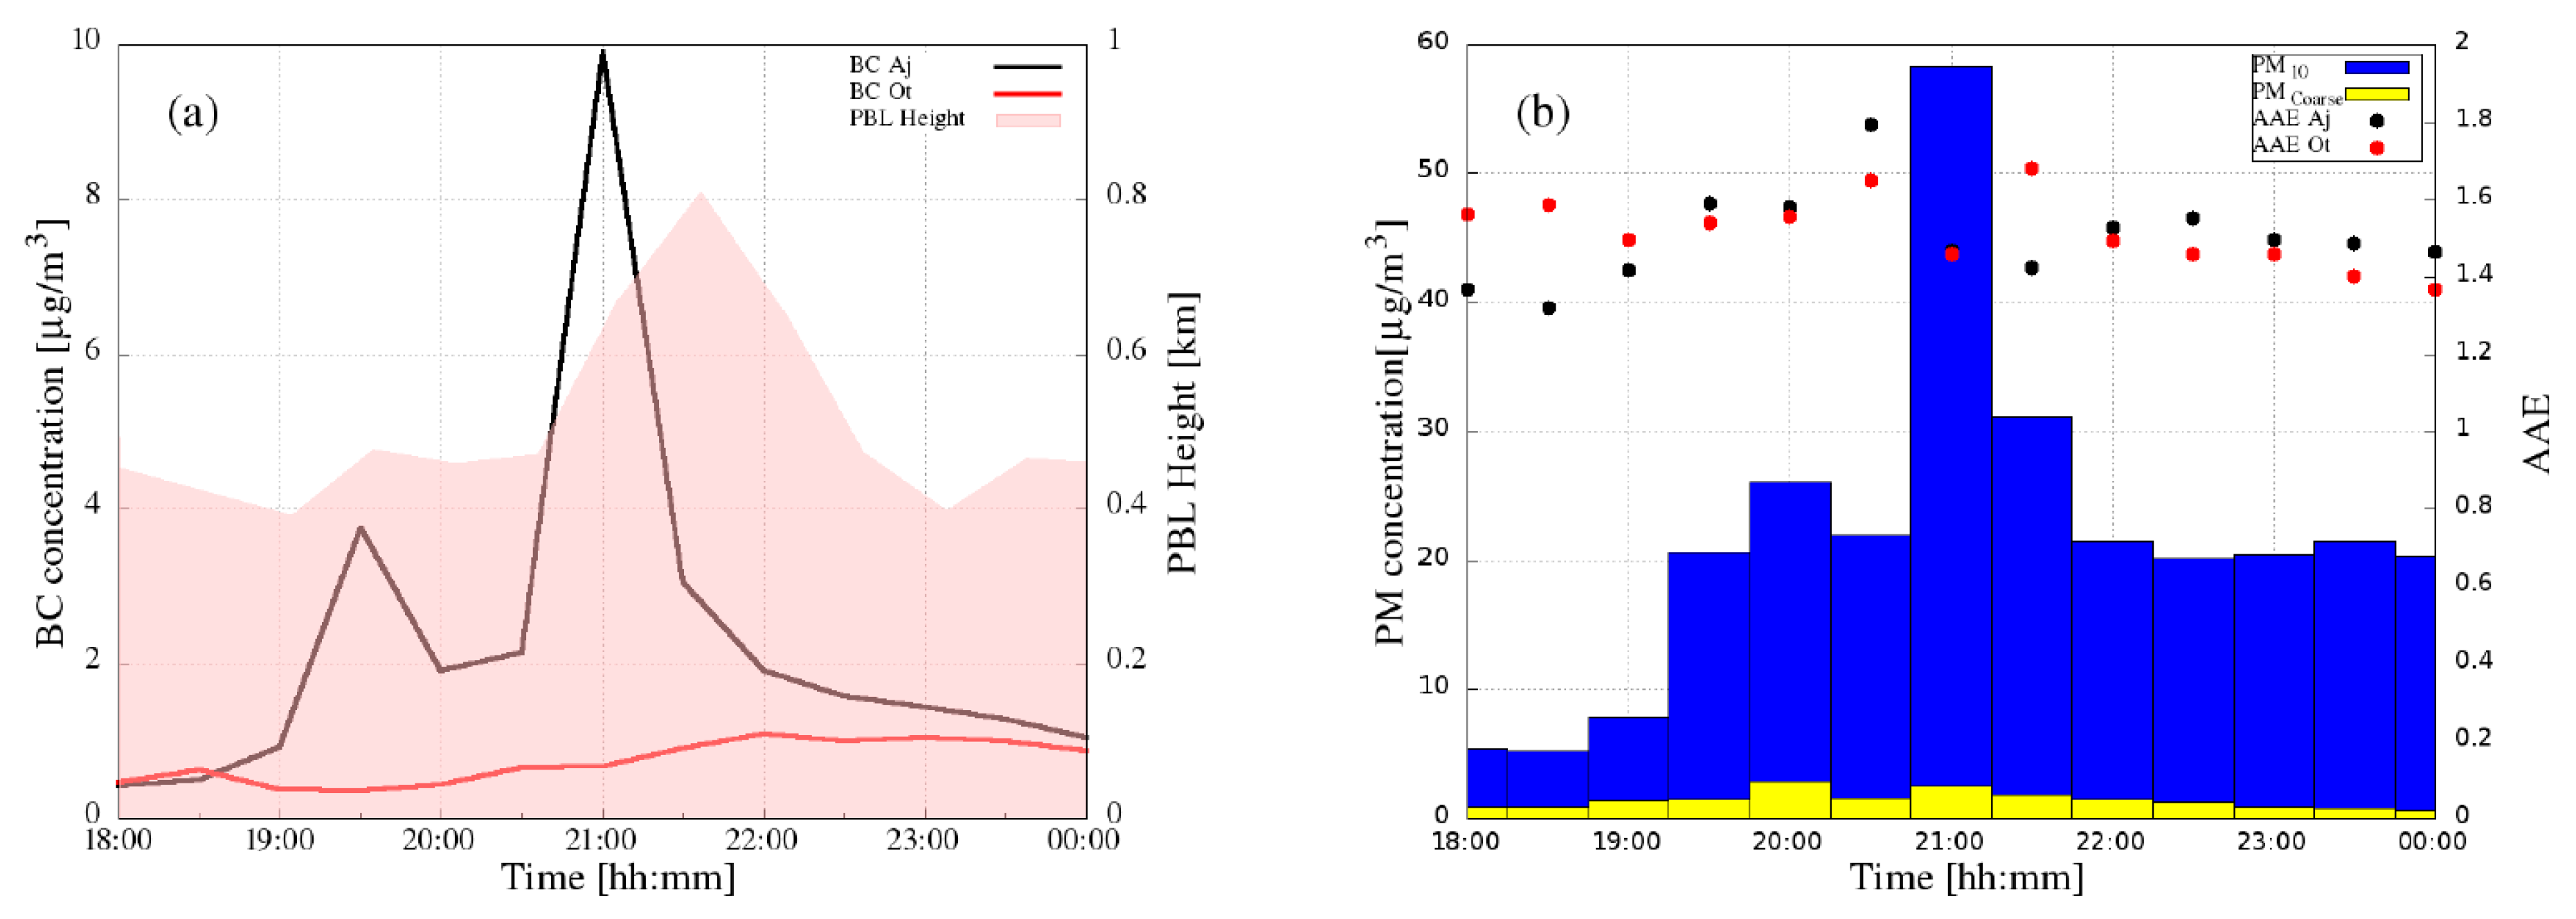
3.1. Campaign Overview

The monitoring campaign, conducted from 1–30 April 2016, was naturally divided into 4 episodes (E1–E4) by periods of rain (Figure 3a). A decreasing trend of aerosol concentration can be observed, with daily peaks of PM 10 concentration exhibiting 40 μ g/m 3 in all episodes. BC concentration shows diurnal variation, following the expected emission pattern of local sources; whereas the total mass of particulate matter varied, according to the presence of other sources of aerosols (Figure 3b). The height of the PBL was found to be mostly below 700 m (Figure 3c), so the Otlica measuring station was not affected by local emissions.
Episode E1, covering 1–8 April 2016, was selected based on the DREAM model forecast, which suggested the presence of Saharan dust. An increasingly high fraction of PM C o a r s e was observed by in-situ measurements. The aerosols at ground level were expected to consist of mineral dust particles from long-range transport, mixed with local aerosols (mainly from combustion sources).
Episode E2, covering 11–18 April 2016, was also selected as a Saharan dust episode, based on the DREAM model forecast. An even higher contribution of PM C o a r s e fraction was observed, contributing up to 44% of all particulate matter. BC concentration during this period was in the range from 0.1 to 7.6 μ g/m 3 , representing about 15% of PM 1 .
Episode E3, covering 19–26 April 2016, was selected based on the in-situ measurements. Throughout the episode, the PM C o a r s e fraction was very low, indicating predominance of local, anthropogenic aerosols. The fraction of BC in PM 1 was found to be about 10%.
Episode E4, covering 30 April to 1 May 2016 was selected as a BB episode, due to traditional bonfires during the celebration on 1 May. Expected prevailing aerosols were predominantly from BB. PM 1 aerosols were found to prevail, with almost no PM C o a r s e . 10% of PM 1 was found to be BC.
Two typical cases with different expected dominant types of aerosols (presence of Saharan dust and presence of BB aerosols) were investigated in detail, based on the data from the campaign. In both cases, weather conditions were stable with half-hour mean wind speeds in Ajdovščina below 3 m/s.

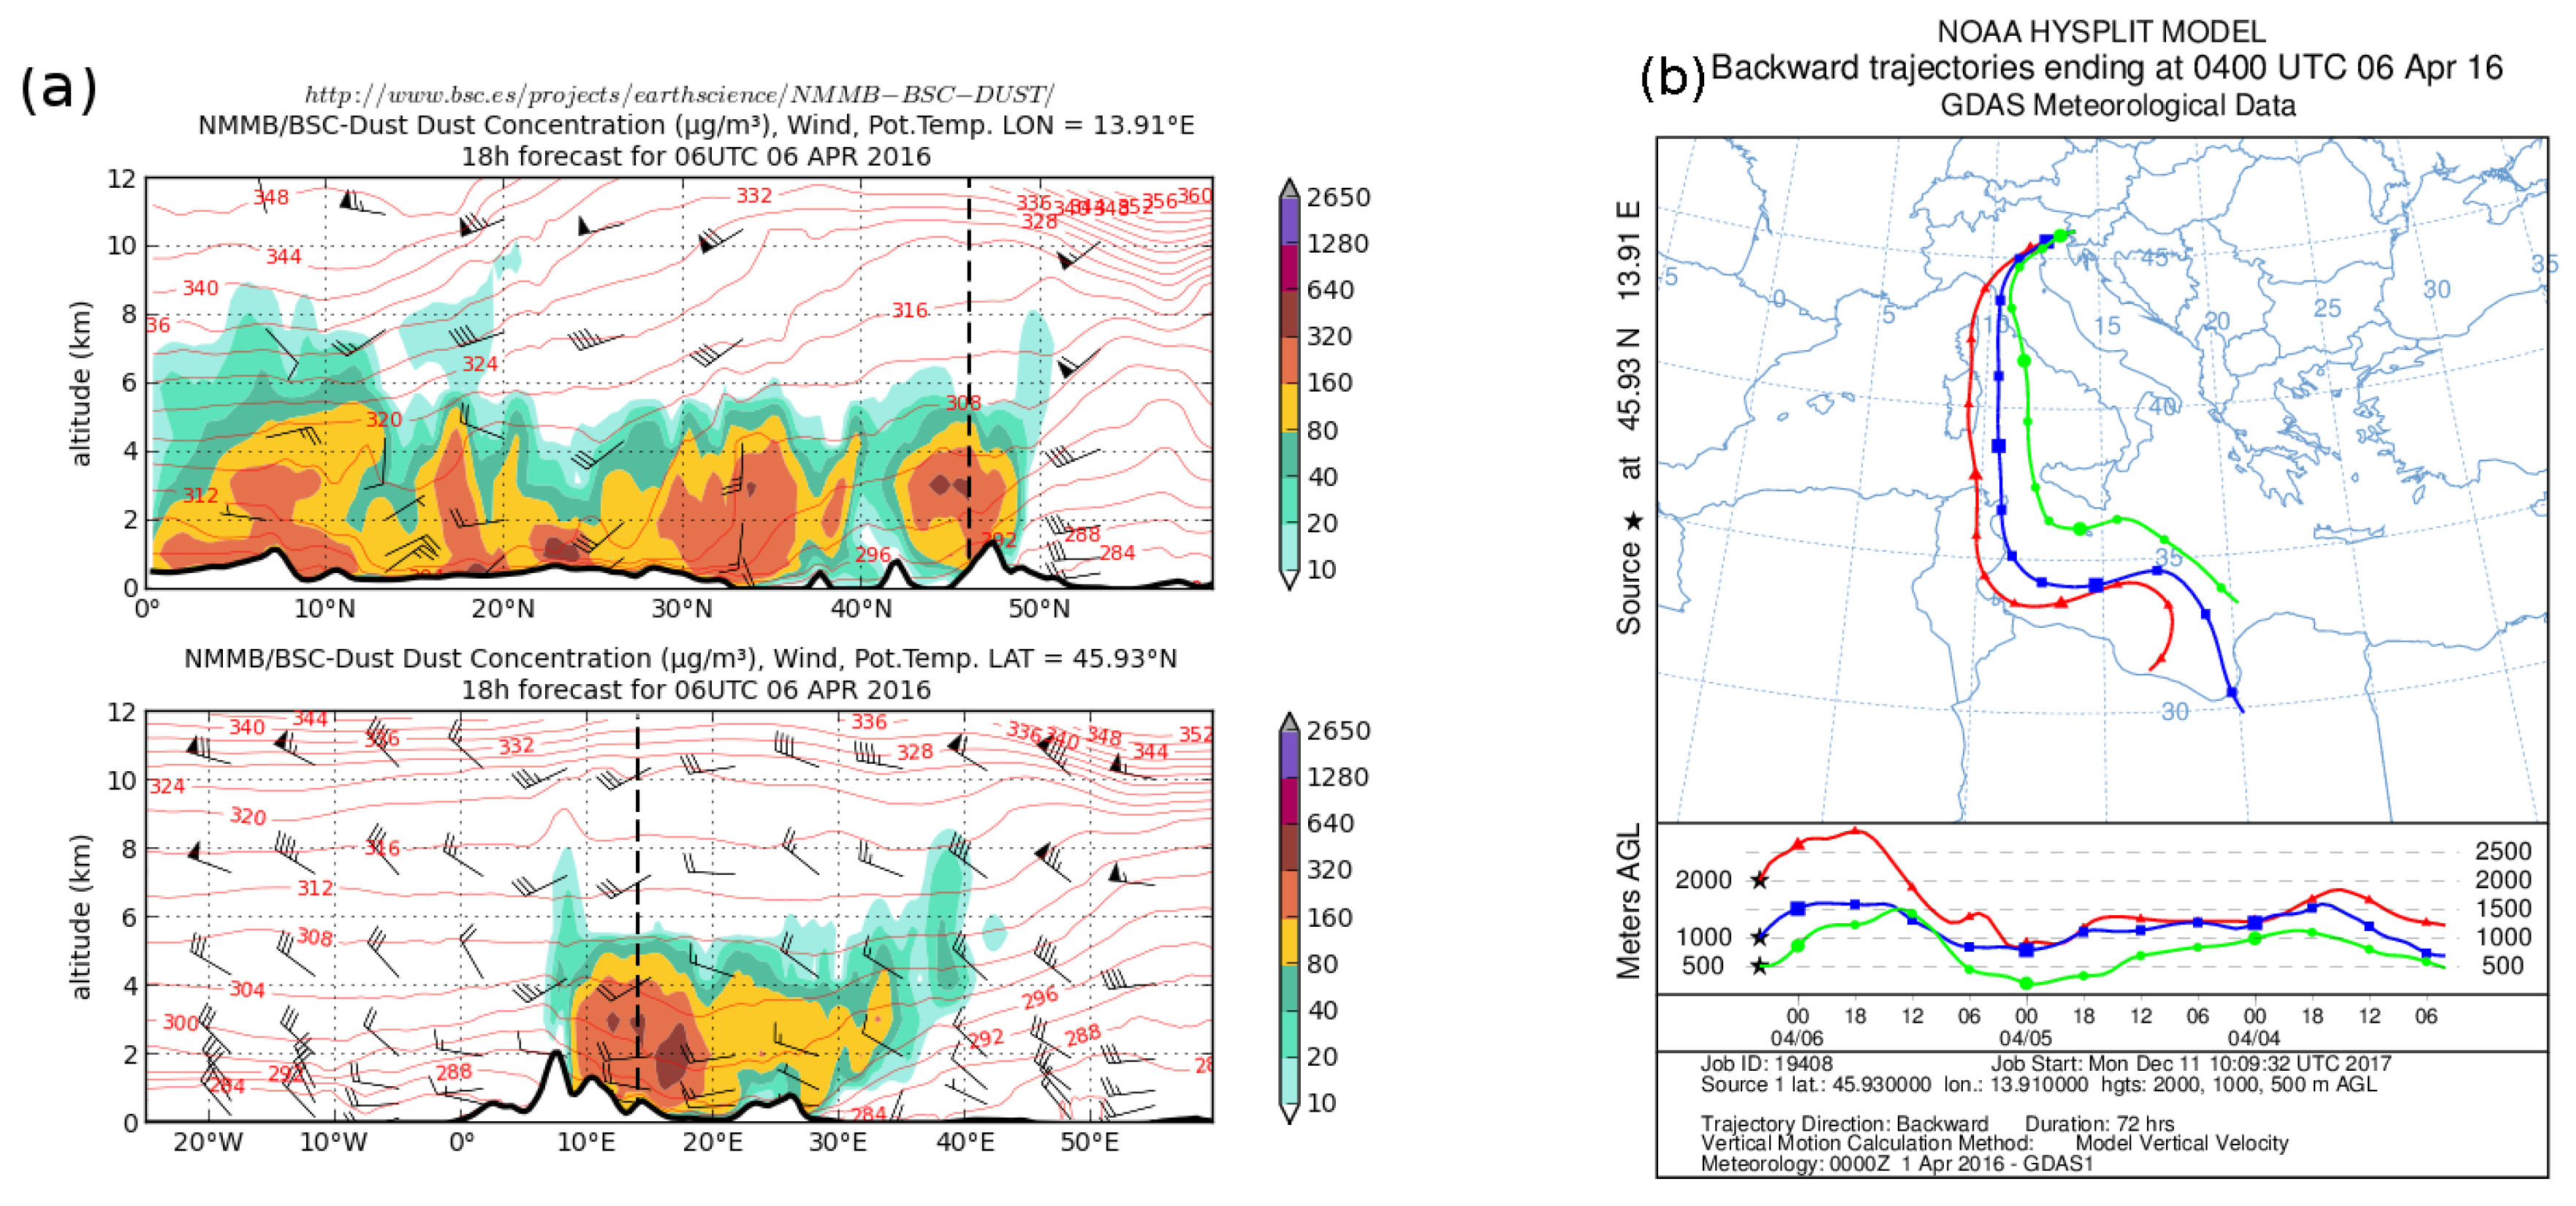
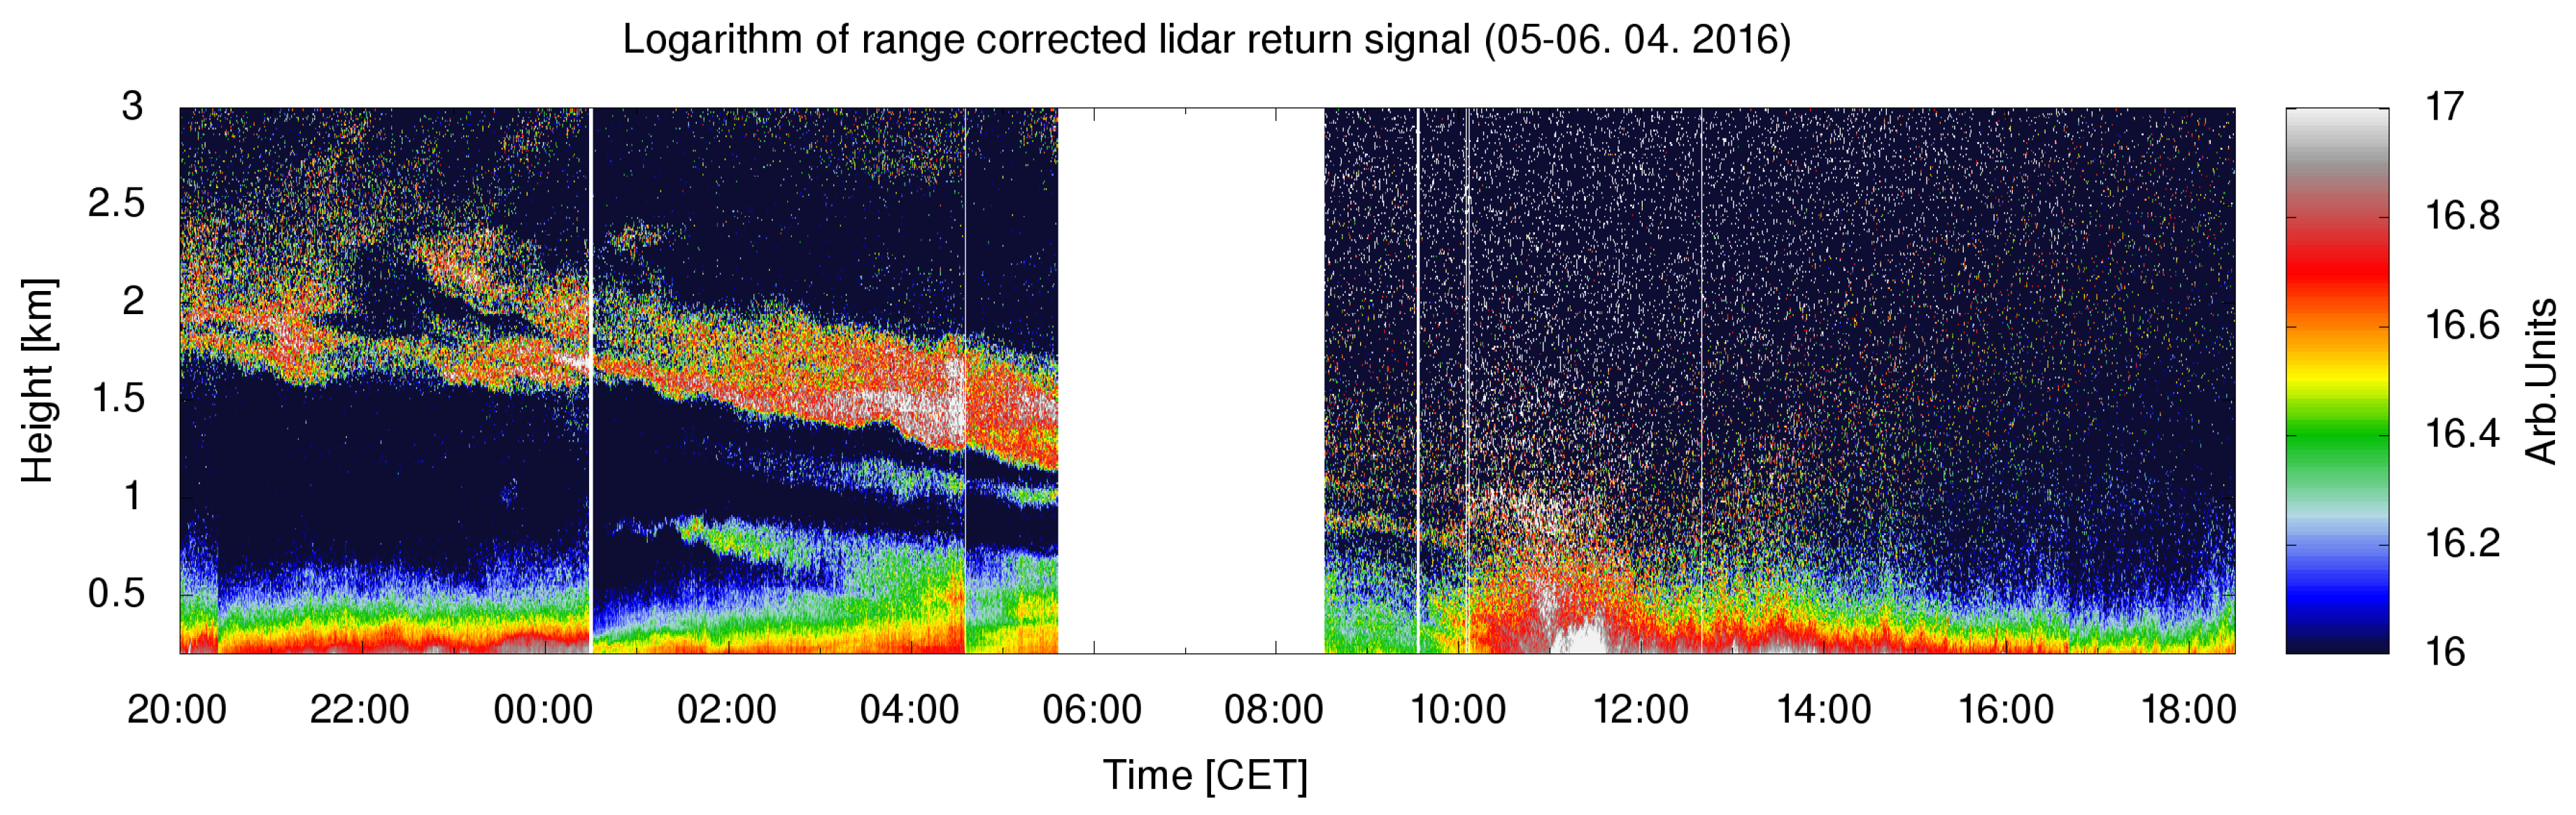
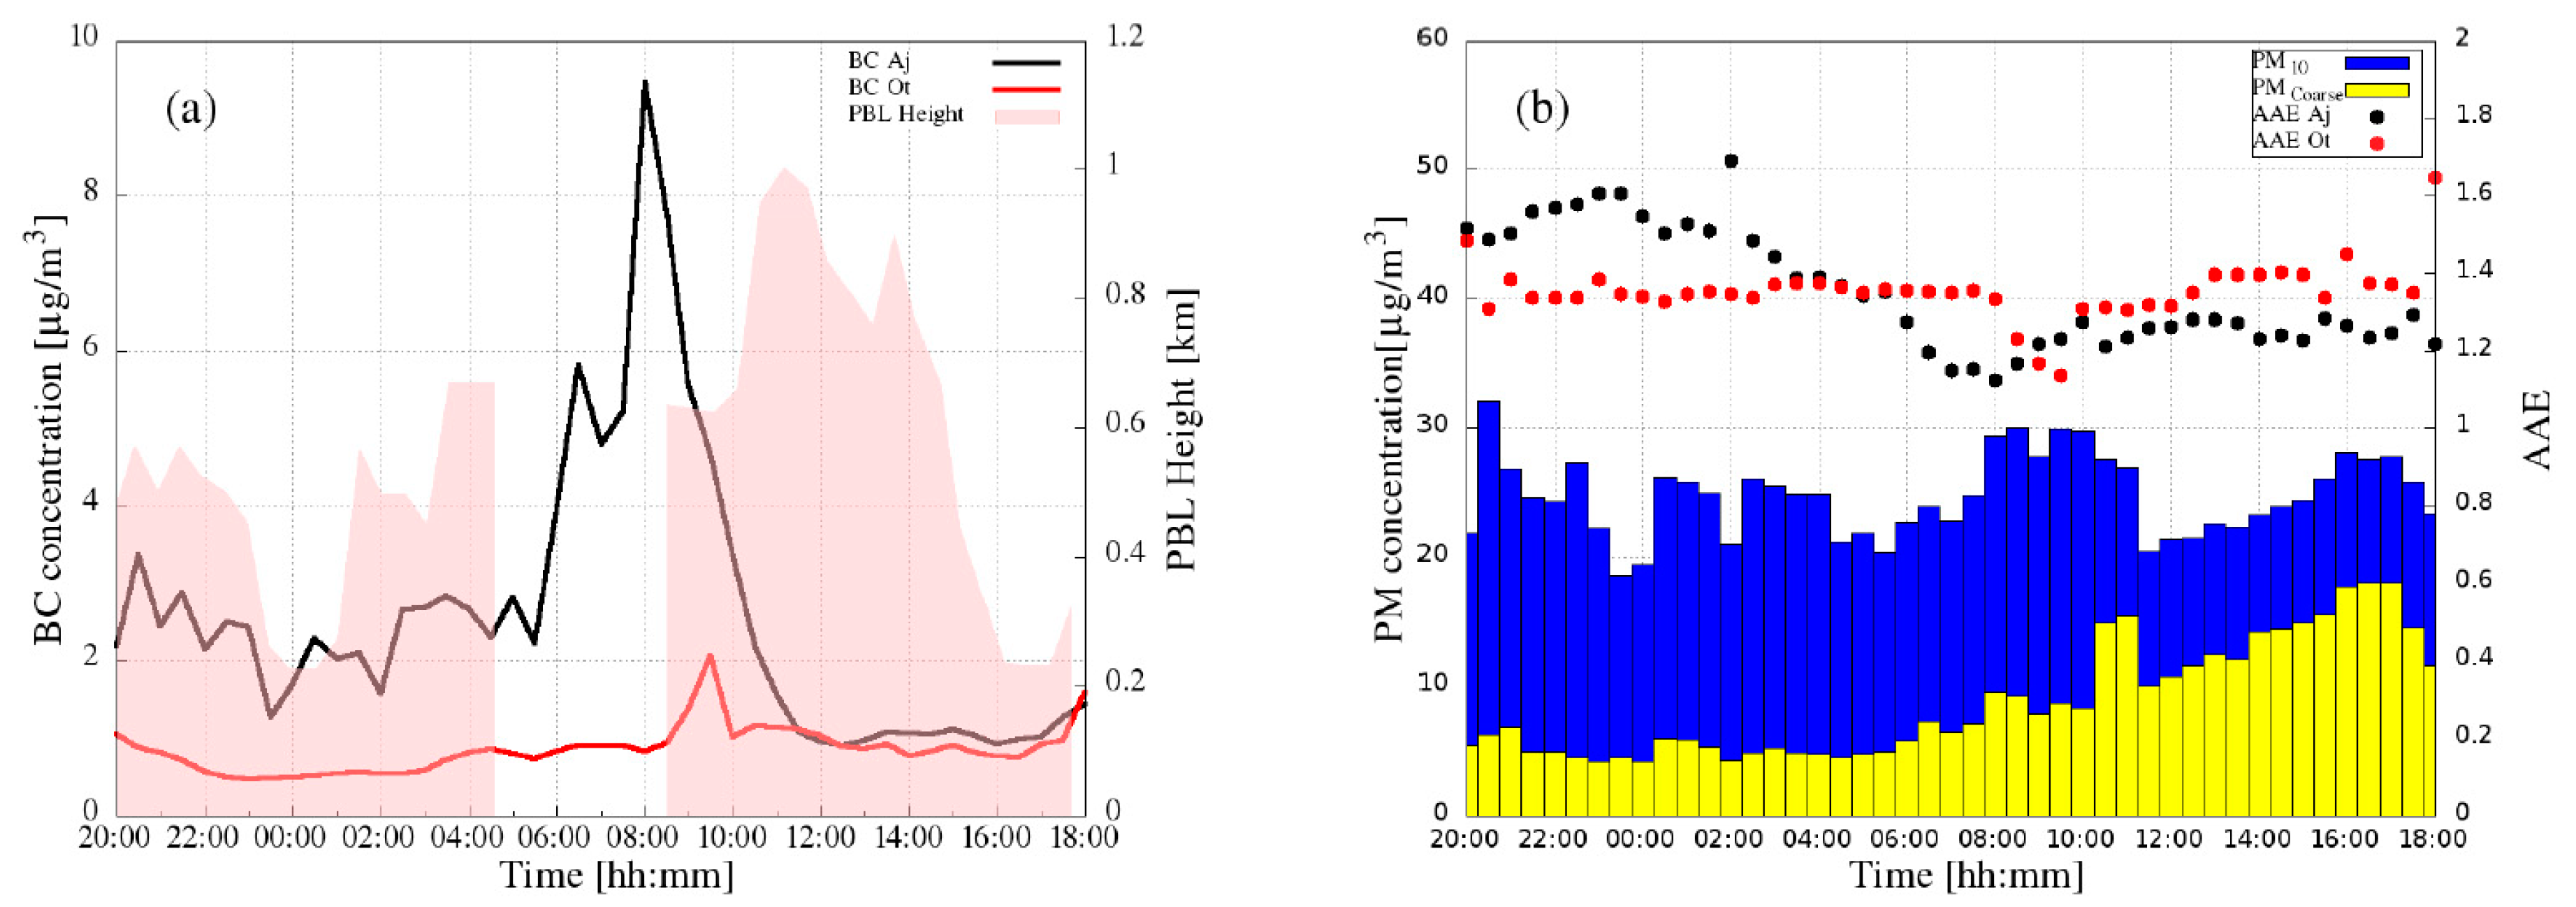
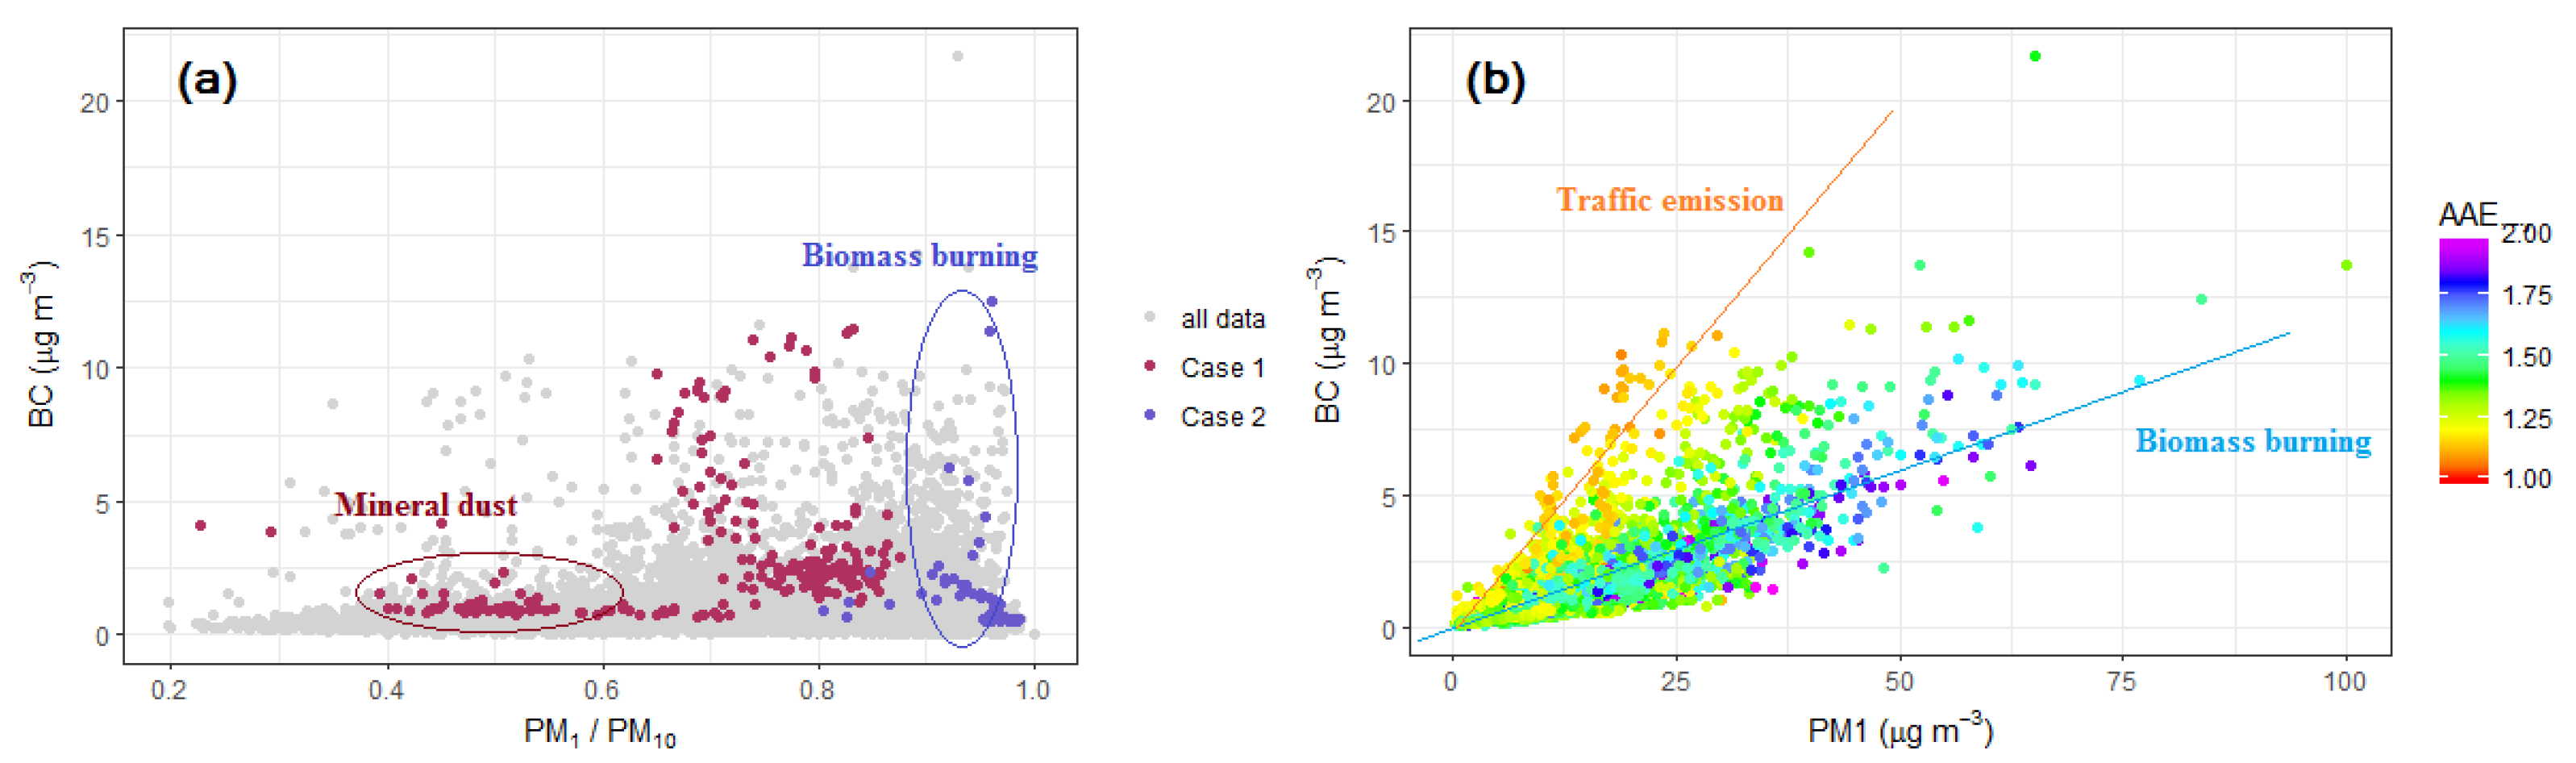
3.2. Case 1: Mineral Dust

Case 1, based on the data from 5–6 April 2016, is an example of Saharan dust presence in and above the Vipava valley. High concentrations of mineral dust were predicted by the DREAM model (Figure 4a), and the prediction was also supported by the HYSPLIT backward air flow trajectories, which showed that dust originated from Northern Africa and arrived over Vipava valley at 5:00 CET (UTC+1) on 6 April 2016 (Figure 4b). The forecasted transport time was about 3 days, based on which a mixture of aged Saharan dust and local aerosols was expected to be found by our measurements. Lidar measurements were performed during cloud-free periods on 5–6 April 2016. Temporal variation of aerosol layers over the Vipava valley, in terms of the range-corrected lidar signal, is presented in Figure 5. A thick and homogeneous elevated dust layer existed between 1 km and 2.5 km above the surface, and its height gradually decreased with time. The PBL was at about 0.5 km above the ground during the night and gradually lifted up to above 1 km in the daytime. Around 2:00 CET, an elevated dust layer at about 1 km above the ground started to mix with the PBL. After 10:00 CET on 6 April, the elevated aerosol layer could no longer be seen—thus, we assumed that the aerosols had dropped and mixed into the PBL.
Additional information on the observed elevated aerosol layer was obtained from meteorological data, in particular the information on the height of the elevated aerosol layer and the PBL, which were obtained from two radiosonde launch stations, at Ljubljana and Udine (Figure 6). Change in relative humidity and potential temperature at the height between 0.5 and 0.7 km corresponds well to the PBL, and the first elevated aerosol level is just above the PBL. Weak height dependence of the virtual potential temperature θ v between 1 km and 2 km indicates a well-mixed layer. The observed wind direction at both sites also agrees well with HYSPLIT prediction. The extent of aerosol mixing within the Vipava valley was checked by comparing BC concentration measurements from local emissions in Ajdovščina (valley floor) and Otlica (valley rim). We found that, in the night, the PBL height was below 0.8 km and the BC measurements at the two sites differed considerably. After the large BC emission peak in the morning and the increase of the PBL due to convection, BC concentrations at both sites became almost the same, which implies that the PBL was well-mixed in the afternoon (Figure 7a). In a well mixed PBL, the gradual increase of coarse particles at the valley floor (Figure 7b) indicates their deposition into the PBL, which was also observed using lidar (Figure 5). Similar AAE values at the two sites indicated that the aerosol type was nearly the same, in this time period. The highest value of the PM C o a r s e /PM 10 ratio, observed around 16:00 CET, was found to be more than 50%, which means that the Saharan dust was, at that time, the predominant aerosol type.

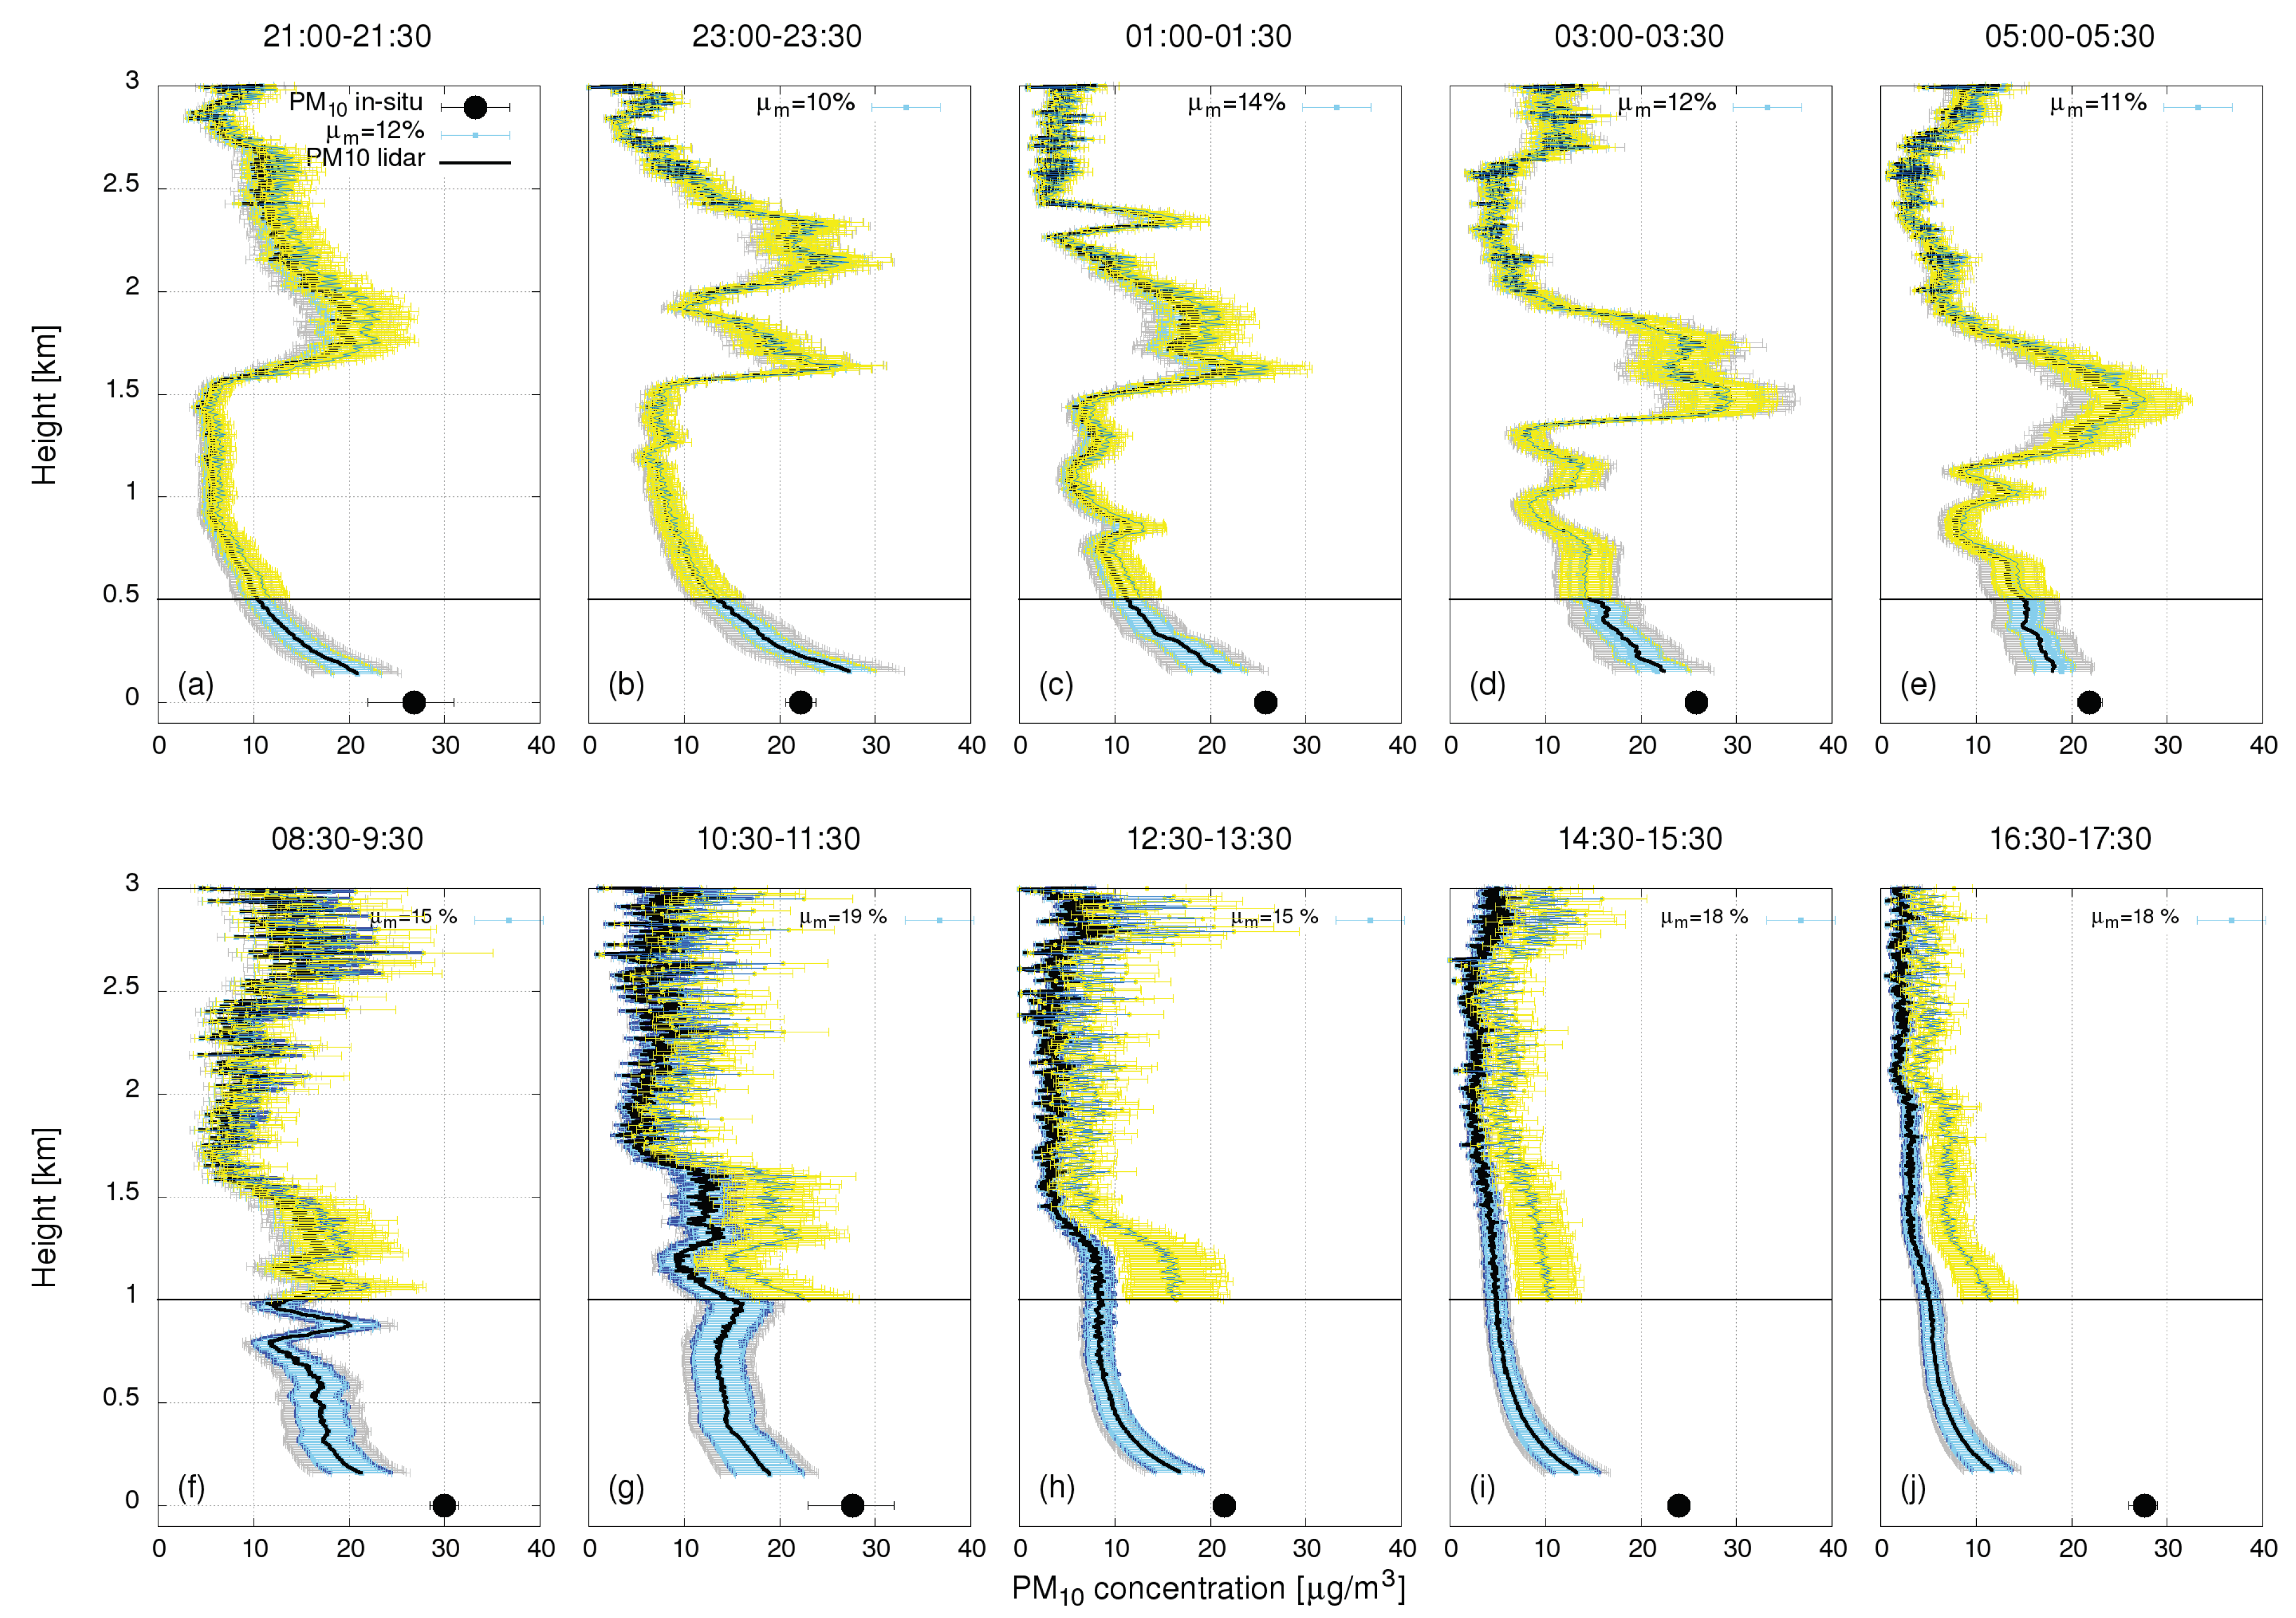
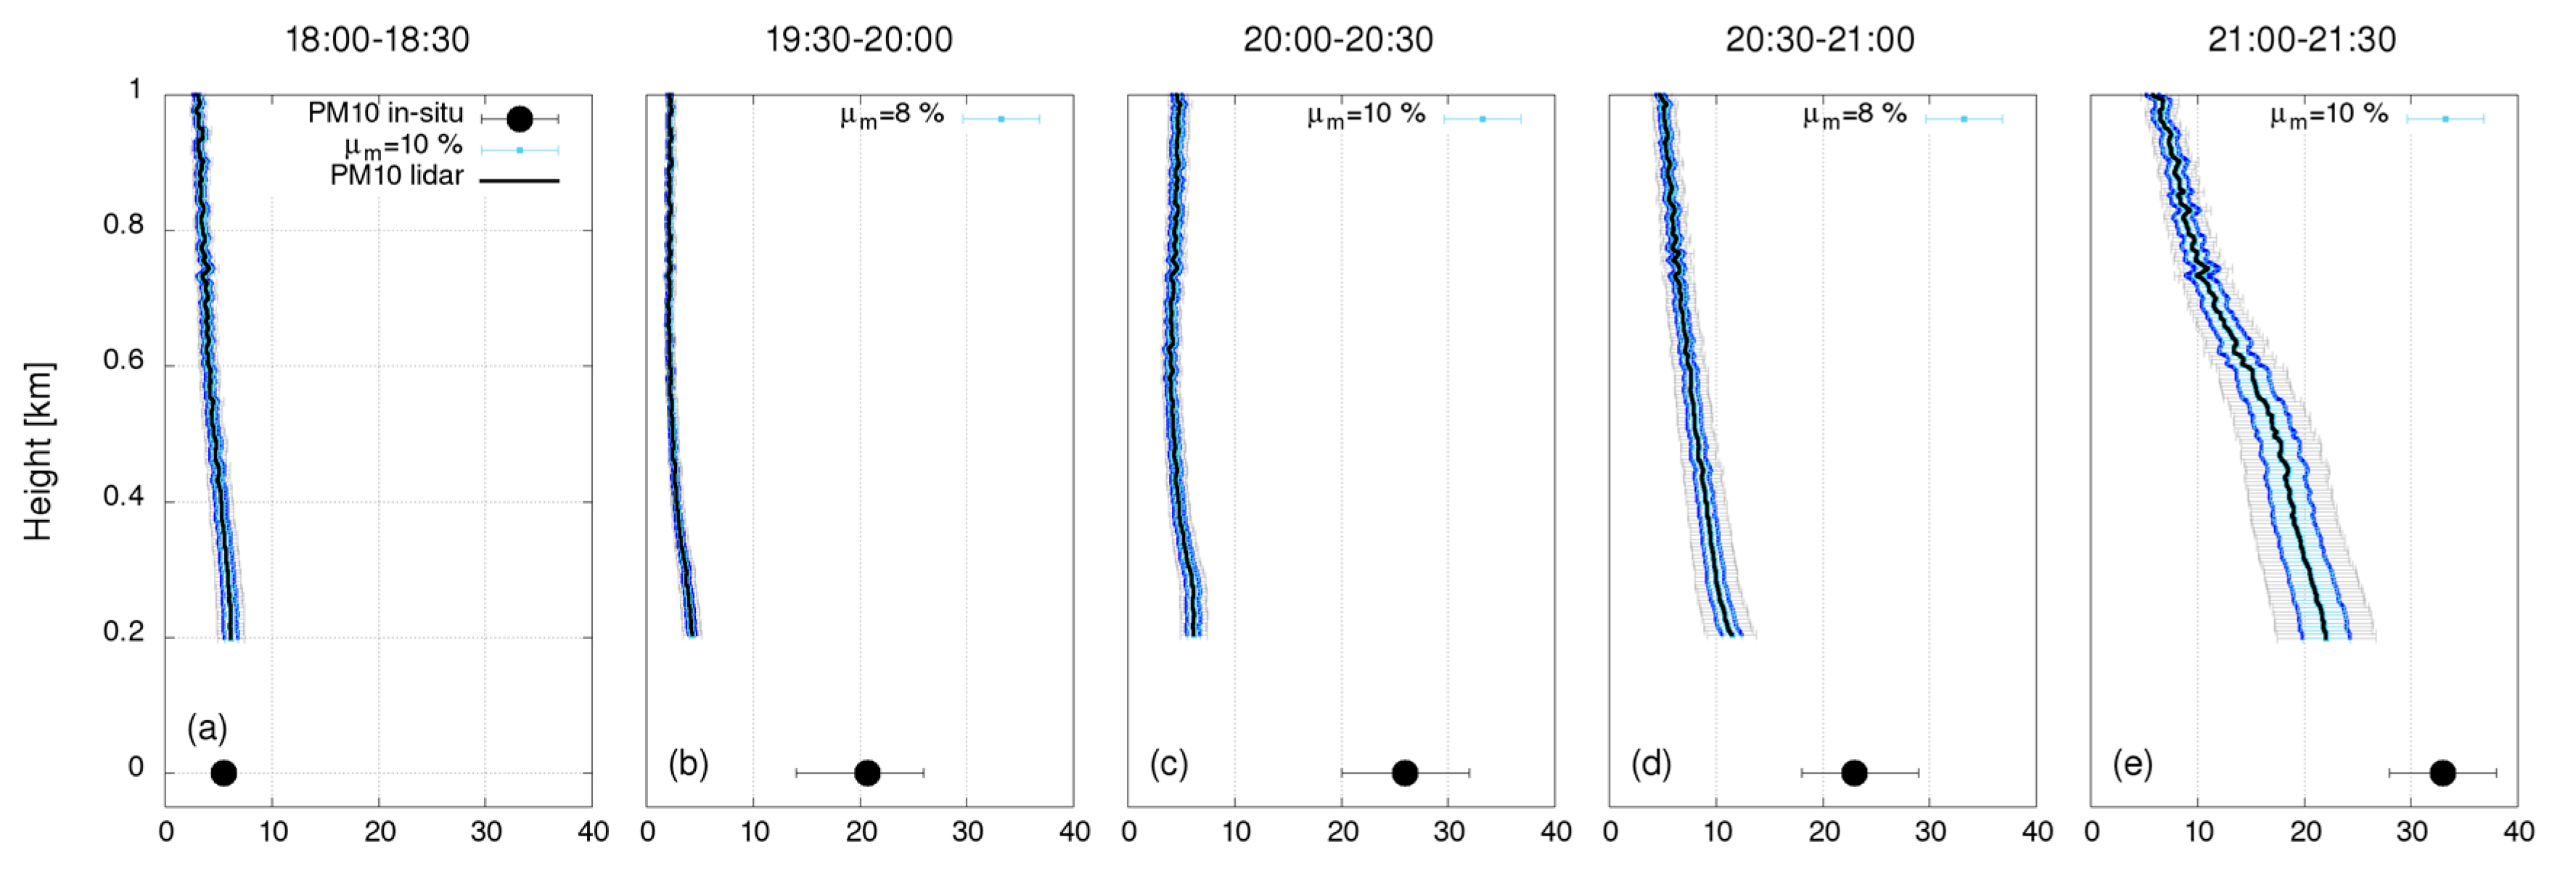
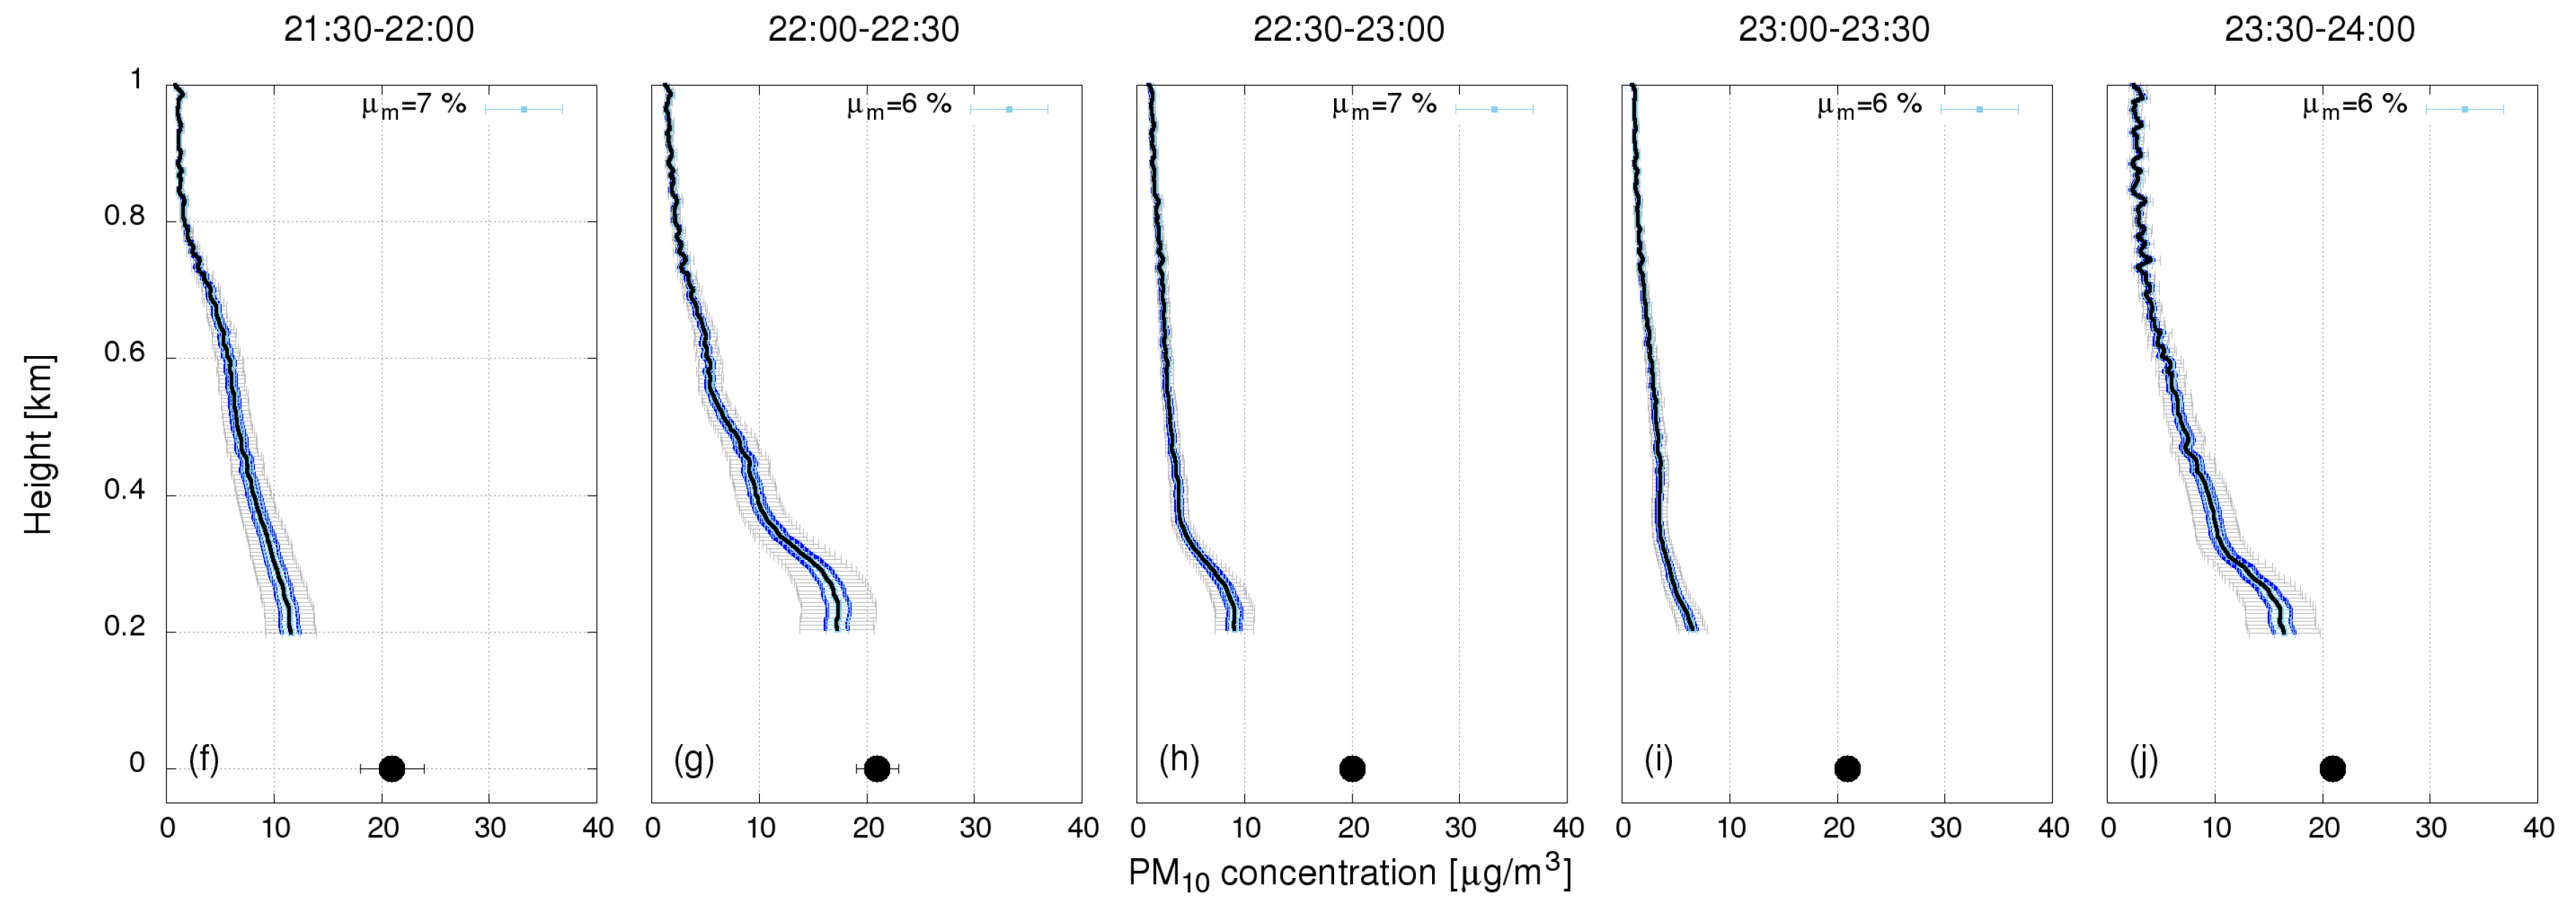
3.2.1. Mass Concentration Profiles

Vertical profiles of mass concentration in the troposphere were obtained over ten consecutive intervals for heights between 0.2 km–3 km above the ground from lidar and OPC data, according to (1). On 5–6 April 2016, similar aerosol size and type distribution were assumed within the PBL, while above the PBL the elevated aerosol layer was verified to predominantly contain mineral dust from Northern Africa. Temporal evolution of the mass concentration profiles, together with OPC measured PM 10 concentration at the ground, is shown in Figure 8. During the time when the elevated aerosol layer was very distinct and mineral dust was predominant in the PBL, the agreement between mass concentration profiles obtained using the conversion factor from 1 (blue), and those obtained using the conversion factor based on [15] was found to be very good. The highest aerosol concentration above the PBL was found to be about 30 μ g/m 3 between 03:00-03:30 CET at 1.5 km above the ground (Figure 8d). After 10:30 CET, when Saharan dust could no longer be observed (the concentration decreased to about 10 μ g/m 3 when the elevated aerosol layer merged into the PBL), the discrepancy gradually increased and reached up to 50%. Lower values of the blue profile are a direct consequence of a gradual change of the predominant aerosol type in the PBL from mineral dust to carbonaceous aerosols in the free troposphere.

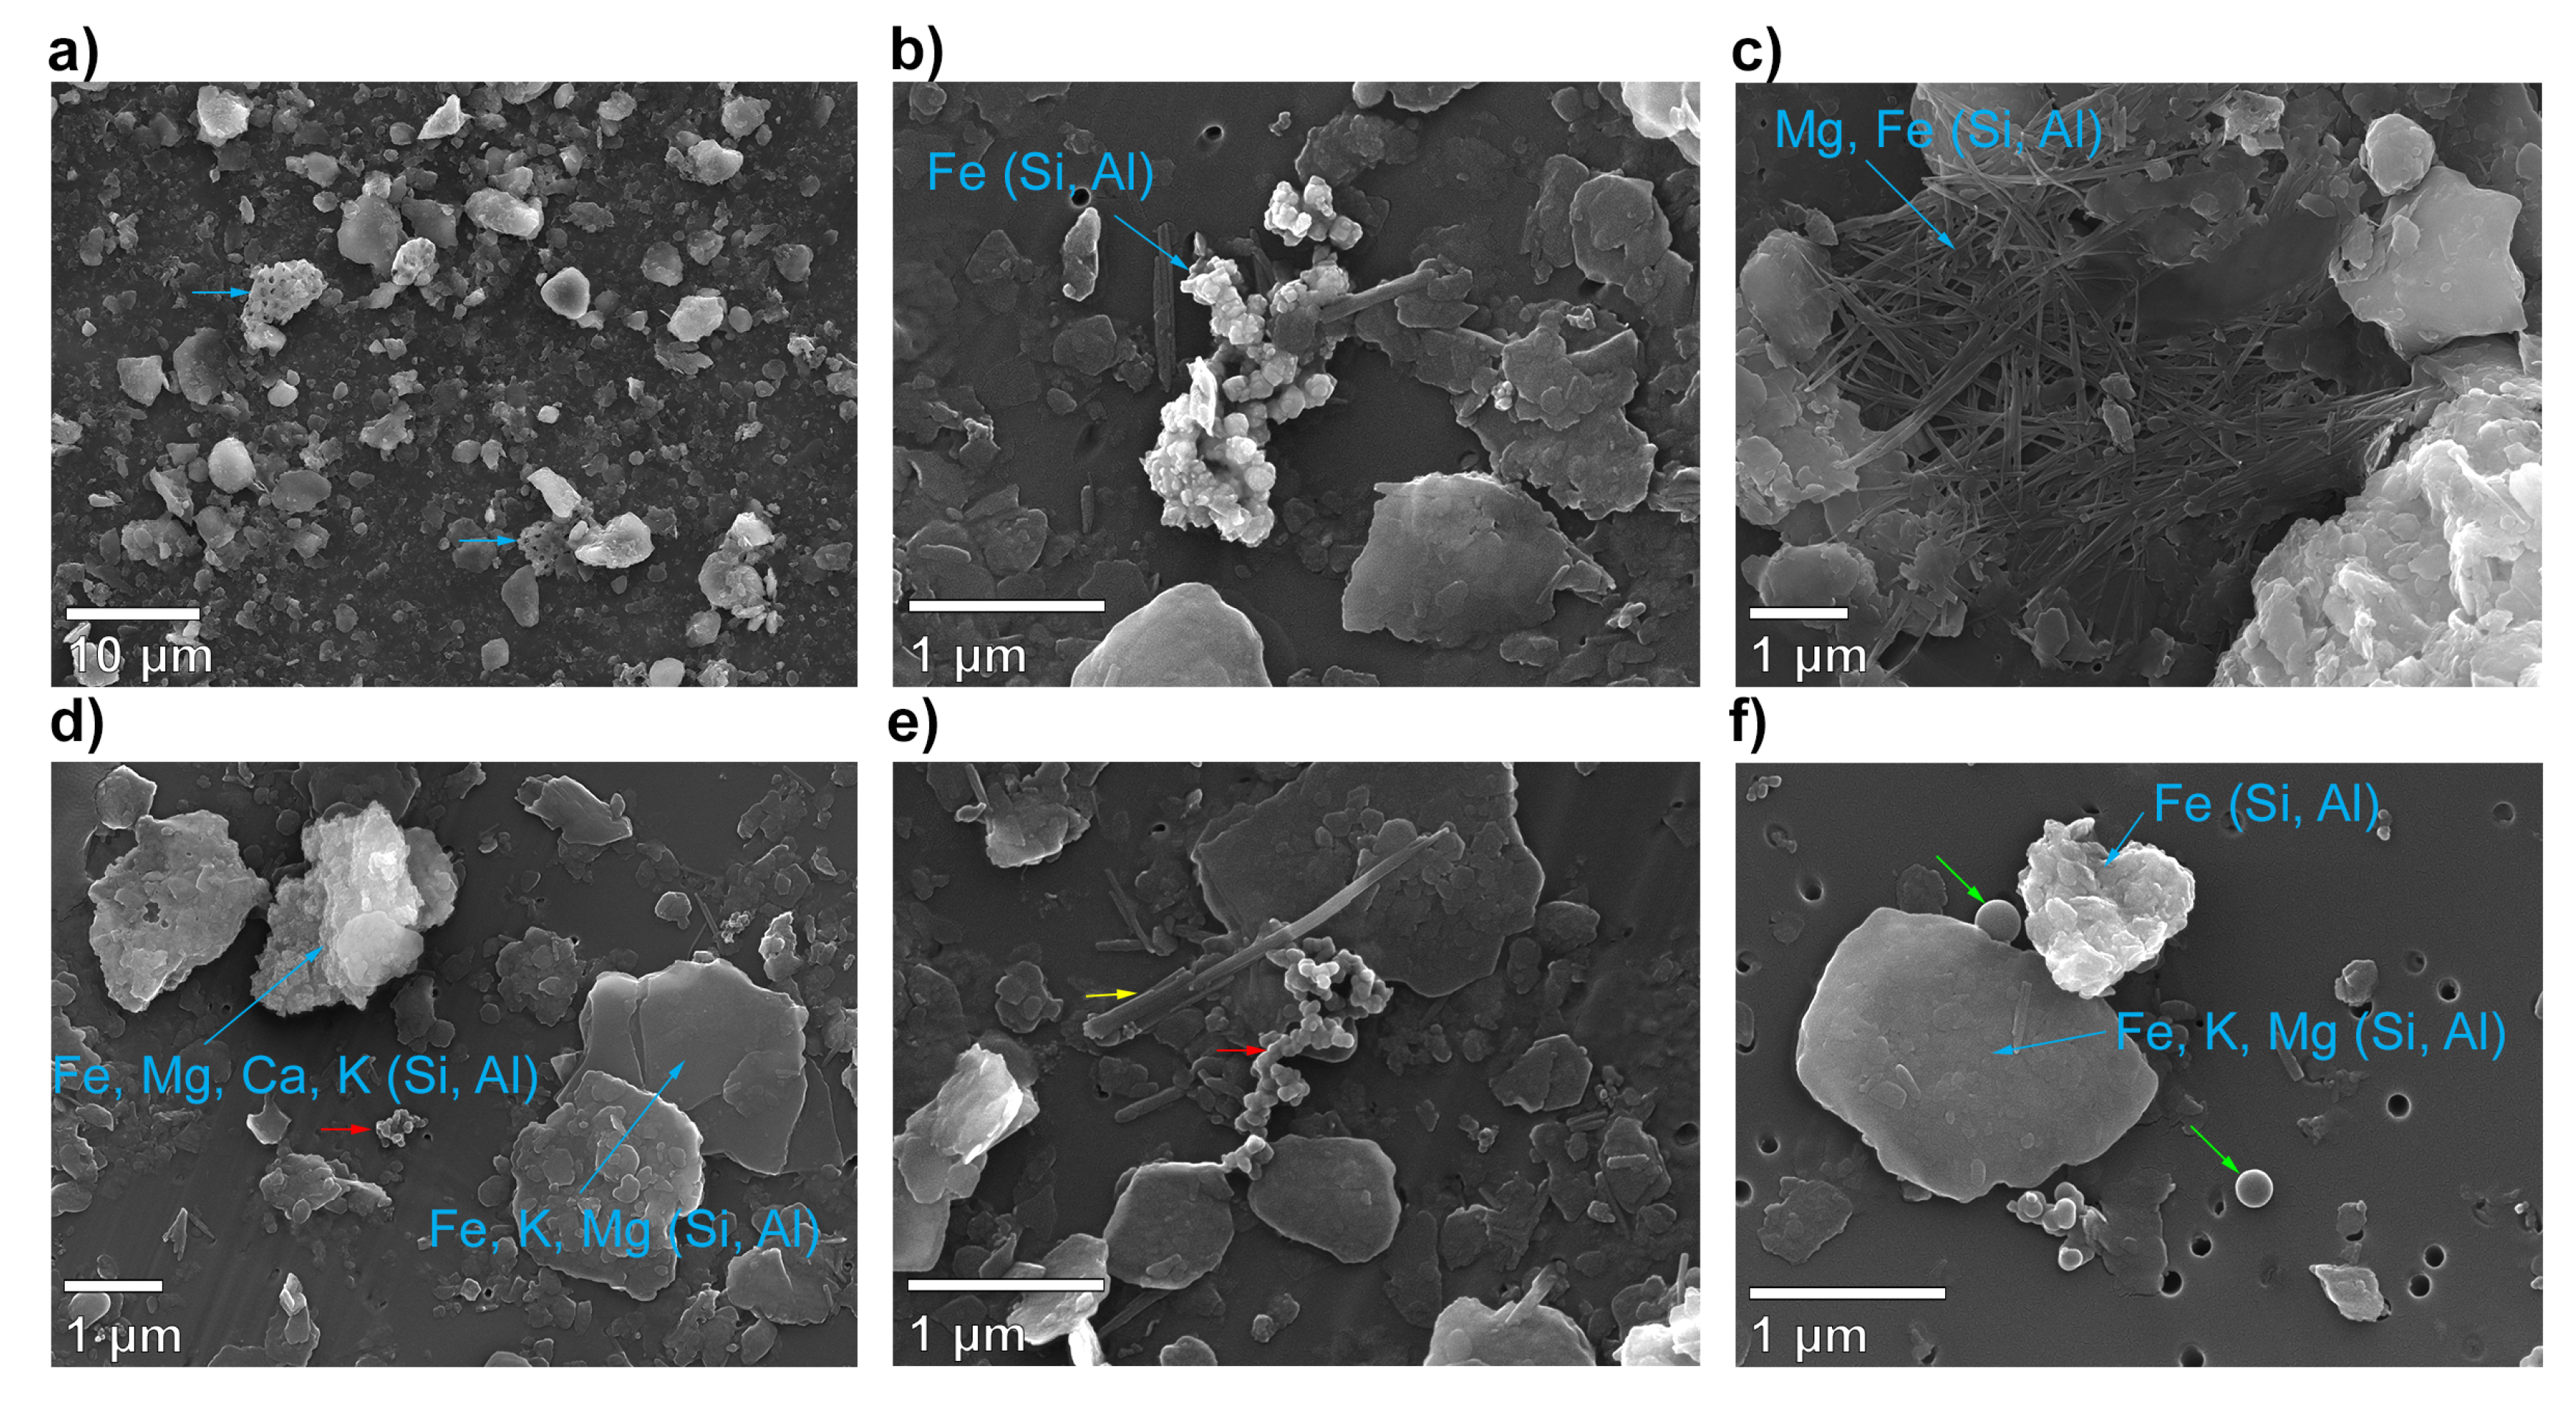
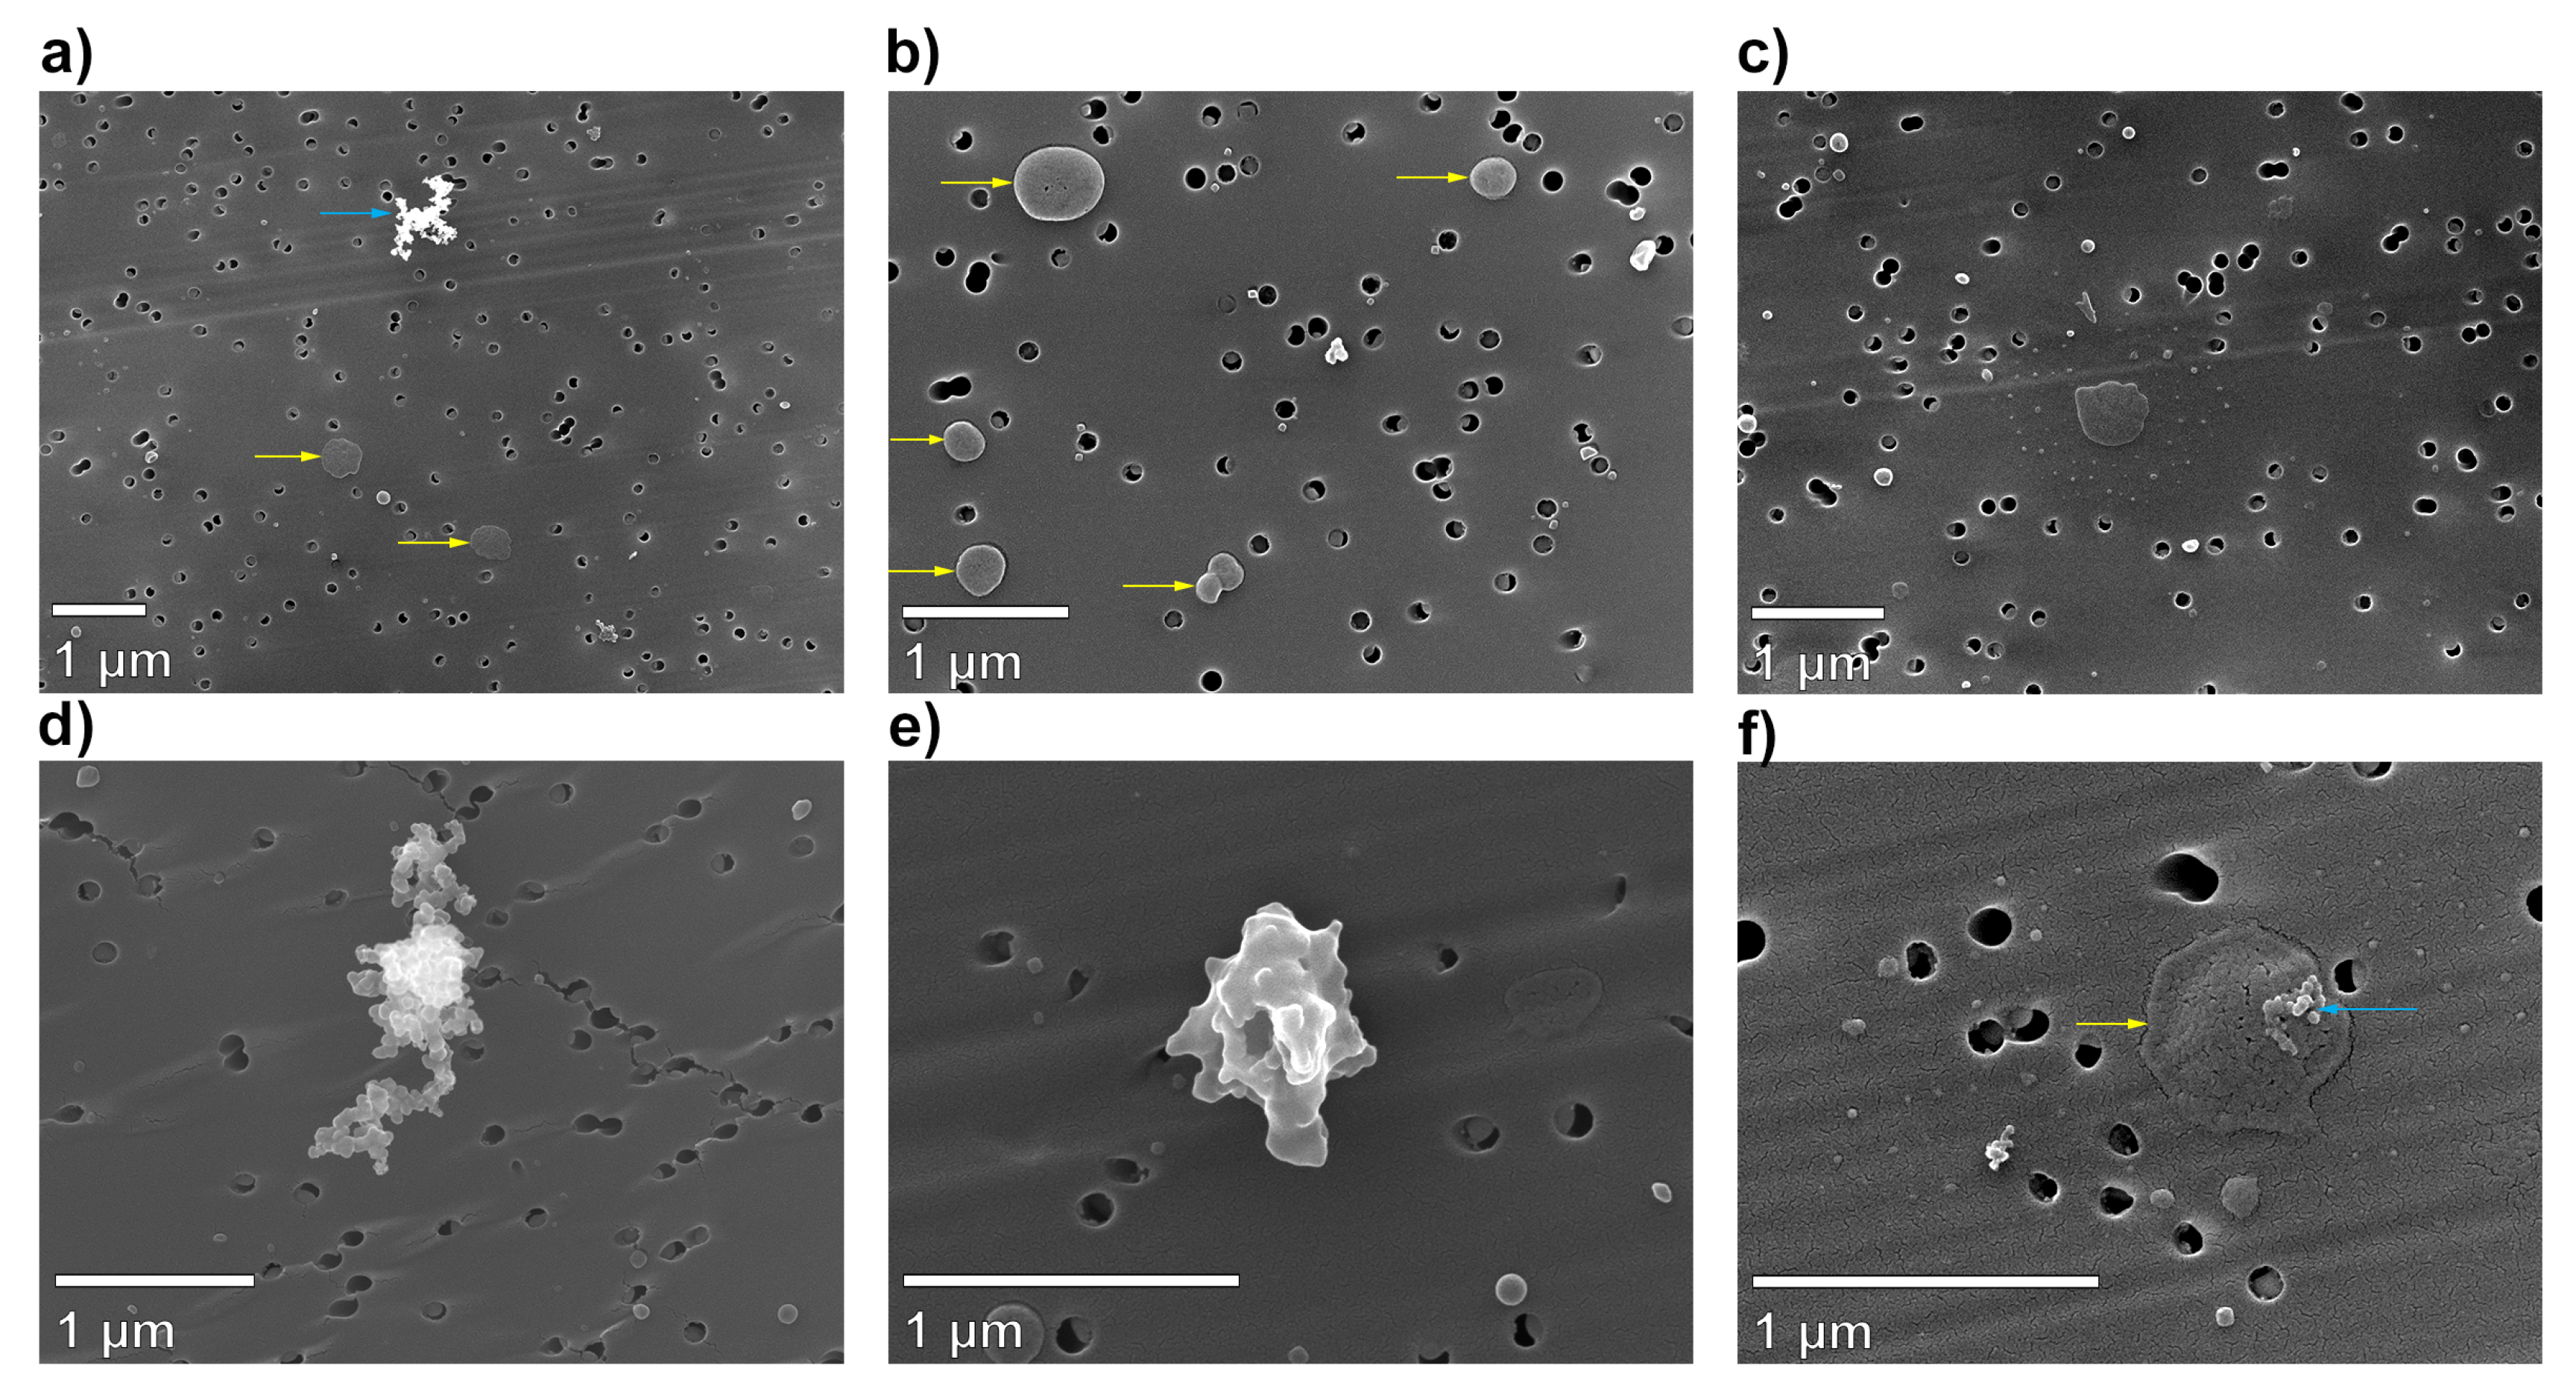
3.2.2. Saharan Dust Characterization

Aerosol particles were extracted from precipitation, according to the sampling procedure described in Section 2.3. Rainwater was collected during a light rain period from 9:00 to 12:00 on 8 April 2016, which was the first rain after the beginning of the investigation case. SEM analyses of the collected aerosol samples revealed a heterogeneous size distribution of particles. Different mineral particles were identified, based on their morphological characteristics and elemental composition. Since the purpose of sampling was to distinguish between local aerosols and those transported over long ranges, only qualitative analysis was performed. The dominating component of the analyzed aerosol sample was found to be mineral dust, with particle diameter in the range of a few hundred nm, up to around 10 μ m. Mineral particles were mixed with particles of anthropogenic origin, mainly soot agglomerates, which are mainly in the size range below 1 μ m (Figure 9d,e: Red arrow), and fly-ash (Figure 9f: Green arrow). Anthropogenic particles could be of local origin or transported together with mineral dust. Most of the mineral particles shown in Figure 9a can be assigned to the group of alumino-silicate minerals (mainly feldspars, clay, and mica) with fragments of diatoms composed of amorphous silica. The Fe-oxide mineral aggregate is presented in Figure 9b. Quartz was mainly observed in the form of well-rounded particles. Mg-dominated fibrous alumino-silicate (Figure 9c), which can be classified as a palygorskite clay mineral, is abundant in sample. Besides a few larger palygorskite agglomerates, separate small fibers are mixed with other particles. According to [43], palygorskite is a suitable source marker for the potential source area in north-western Africa, which, along with diatom fragments, confirms long-range transport of sampled particles. Since particles were collected in water, it was not possible to draw any conclusions about the particle mixing state. Water could also have partly influenced the morphology and mineralogy of some mineral particles, and also caused the formation of authigenic particles (crystallization during drying of filters).

3.3. Case 2: Biomass Burning Aerosols

Case 2 describes elevated concentrations of BB aerosols in the Vipava valley, connected to traditional bonfires during the international labor day celebration (lit every year in the night from 30 April to 1 May). Wood was used as the main fuel. Several fires were lit along the Vipava valley and on the surrounding hills, one of them also near the lidar measurement location in Ajdovščina. This particular bonfire was lit around 20:00 CET on 30 April 2016 and lasted for 2 h. Lidar measurements were performed between 18:00 and 24:00 CET on 30 April 2016. Temporal variation of aerosol loading, in terms of the range-corrected lidar signal, is presented in Figure 10. The aerosol loading was low before the bonfire started, but sharply increased after 20:30 CET. The PBL was initially lower than 0.5 km above the ground. It lifted up to above 800 m after 20:30 CET, which implies high aerosol loading and vertical mixing due to the buoyant lift of hot air. Aerosol loading close to the surface kept gradually increasing as more and more particles were emitted into the air. After 23:00 CET, when the fire burned out, aerosol loading decreased due to dispersion.
BC concentrations were constantly monitored by the aethalometers at Ajdovščina and Otlica. Before the wood burning started, both BC and PM concentrations were very low, mainly caused by local traffic emissions, according to the AAE, which was lower than 1.3. The peaks in BC and PM 10 in Ajdovščina were observed at the same time, at about 21:00 CET, about 20 min after the wood burning started. The evolution of BC and PM 10 concentrations at both sites are shown in Figure 11. Higher AAE during the BB event indicates the presence of primary and secondary organic particulate matter, which is known to absorb in the UV range, the so-called brown carbon [44]. A correlation was found between the PBL height and the BC concentration. The PBL height increased from 0.3 km to 0.8 km due to the burning, and decreased again after BC concentration subsided (Figure 11a). Together with elevated particle concentration, mixing height increased due to convection. Hot air from bonfires lifted particles from the lower altitudes to higher altitudes, due to the thermally driven upslope and compensation of the downslope motions [4]. Vertical mixing of wood smoke contributed to slightly increased BC concentration at Otlica (from 0.4 to 1 μ g/m 3 ) in the period from 20:00 to 23:00 CET.
The AAE from the two sites has a peak value of 1.7 corresponding to the peak of PM concentration (Figure 11b), which indicates the presence of pure BB [38]. The very low fraction of PM C o a r s e (only 6%) within PM 10 implies that predominant aerosols were small (PM 1 ). Since particles smaller than 1 μ m represented the dominant aerosol fraction, we assumed that there were no other sources of aerosols than primary and secondary particles from incomplete wood combustion [45]. This assumption was confirmed by SEM analysis of sampled aerosols.

3.3.1. Mass Concentration Profiles

Vertical mass concentration profiles were extracted in the same way as in Case 1, the only difference being the selection of the refractive index value. The validation of the choice of m by comparison of the OPC and aethalometer based absorption coefficient yielded a discrepancy of less than 10%. The profile for the first period, before the burning started, was taken as a background aerosol distribution. The PM 10 concentration was found to be below 6 μ g/m 3 and slowly decreased with height (Figure 12a). After the burning started, increased PM 10 and BC were found at the surface, as well as above it with a certain time delay. First, the PM 10 with peak concentrations of 32 μ g/m 3 at the surface, then about 1 hour later the PM 10 increased to about 22 μ g/m 3 at 0.2 km (Figure 12e). The aerosol source was further confirmed by the aethalometer measurements, where the AAE value above 1.6 indicated higher content of brown carbon from the BB (Figure 11). This observation was additionally confirmed by SEM analyses of sampled aerosols (Figure 13). The step in the gradient of PM 10 caused by BB emission was gradually shifted up to about 0.6 km (Figure 12f), indicating the height of the plume layer. After the bonfires died out, particulate emission decreased and vertical mixing calmed down, so the gradient between PM 10 concentration at the surface and at 0.2 km decreased again (Figure 12j).

3.3.2. Characterization of Biomass Burning Aerosols

Ambient aerosols were continuously sampled using an electrostatic precipitator. The sampling started before the bonfire events, from 9:30 CET on 30 April, and ended on 5:40 CET on the next day. Since BC and PM concentrations were low during the whole day, we expected that most of particles were collected in the evening and during the night, when aerosol concentration increased due to bonfires. Based on SEM analysis, the dominant aerosol type was carbonaceous aerosol, consisting of an external or internal mixture of primary particles—soot agglomerates (Figure 13) and organic particles (OM). Analyzed particles were all below 1 μ m in size, which is consistent with the OPC-based measurements of particle size distribution during this period. Beside carbon and oxygen, sulfur was also found in small quantities in the OM particles.

3.4. Analysis of Aerosol Properties

In the Saharan dust (Case 1) and biomass burning (Case 2) we investigated the presence of very different aerosol types in similar, calm weather conditions. The most indicative in-situ measured parameters for the identification of aerosol type were found to be PM 1 /PM 10 and BC/PM 10 ratios, as well as the AAE and MEE. A comparison of their mean values is shown in Table 1. A combination of these parameters alone may be used to distinguish between different aerosol types, which we attempted to do on the entire dataset (1–30 April 2016).
Based on ground-based measurements of BC concentration and particle size distribution, a clear difference was observed between anthropogenic emission from the biomass burning source (Case 2) and mineral dust (Case 1) (Figure 14a). While a high PM 1 /PM 10 ratio was characteristic for biomass burning episode, contribution of mineral dust to local aerosol resulted in lower PM 1 /PM 10 ratio. During the Case 1 period, when transported mineral dust was gradually mixed with aerosols emitted from ground-based sources, PM 1 /PM 10 ratio gradually decreased from 0.9 to 0.4. A higher concentration of BC was observed during the morning, when PBL height was still low. After PBL started to rise in the late morning, BC concentration decreased, while the concentration of coarse particles increased due to inclusion of the mineral dust layer to the PBL. Comparison of BC to PM 1 contribution for different dominating BC sources (Figure 14b) shows a significant difference between traffic and biomass burning sources, which were distinguished based on BC optical properties (AAE). During periods when traffic was considered the dominant BC source (AAE < 1.1), BC represented around 40% of PM 1 . On the other hand, during biomass burning emissions (AAE > 1.7) BC represented only around 10% of PM 1 , implying significant contribution of primary organic aerosol, emitted together with BC. This finding is also supported by SEM analyses, where considerable contribution of organic aerosol particles was observed (Figure 13).

4. Conclusions

The combined study of aerosol properties and distributions using Mie scattering lidar, OPC, and aethalometer was the first attempt to identify aerosol types in a small scale valley (or region), such as the Vipava valley. A one-month measurement campaign was carried out, which covered two specific phenomena (arrival of mineral dust and a local BB event, identified by aerosol sampling and SEM/EDX analysis, PBL height evolution, and by modeling). In the calculation of aerosol optical properties, the values of refractive index were applied for specific aerosol types, based on the previous studies and our aerosol sampling composition analysis. However, the uncertainty of the assumed refractive index can be estimated from the comparison with absorption coefficient measurements by aethalometer. Using all available measurements, the vertical aerosol mass concentration profile PM 10 lidar was obtained. Its uncertainty was estimated to be less than 30% within the valley. From in-situ aerosol measurements at two sites, the aerosol mixing states were checked in both horizontal and vertical distributions, which provides evidence to prove that aerosol vertical profiles can correctly represent a small scale region, such as a valley. In Case 1, Saharan dust was confirmed to be mixed into the PBL and had influence on the surface. In Case 2, aerosols from BB with sizes below 1 μ m were found to be lifted thermally above the PBL. We have demonstrated that aerosols composed primarily of mineral dust can be distinguished from those originating from BB not only at ground level, but also throughout the valley ridges. The combination of lidar and in-situ measurements was thus found to be a more powerful tool for study of vertical mixing and dilution of particulates, than either method alone. The accuracy of the method could be further improved by using refractive index values retrieved by a co-located sunphotometer.

Author Contributions

All the authors made contributions on this research work and manuscript. In particular, Data curation, L.D., J.V., M.M., M.G., and A.G.; Investigation, L.W., W.E., and A.G.; Methodology, L.W., W.E, G.M., L.D., and A.G.; Project administration, S.S.; Software, L.W. and A.G.; Supervision, S.S. and W.E; Writing—original draft, L.W.; Writing—review & editing, S.S., K.B., W.E., G.M., J.V., M.M., M.G., and A.G.

Funding

This research was funded by Javna Agencija za Raziskovalno Dejavnost RS (grant numbers P1-0385, P1-0025, P1-0020 and Z1-7187) and Fulbright Scholar program.

Acknowledgments

We acknowledge Aeronautica Militare and OSMER—ARPA FVG for help with sounding data from Udine, and Aerosol d.o.o., the manufacturer of the Aethalometer instruments, which were provided by them to measure black carbon in the study.

Conflicts of Interest

The authors declare no conflict of interest. At the time of the research, A.G., G.M., and L.D. were part-time employed by Aerosol d.o.o., the manufacturer of the Aethalometer instruments, which were provided by them to measure black carbon in the study. Funding agencies or Aerosol d.o.o. had no role in the design of the study; in the collection, analyses, or interpretation of data; in the writing of the manuscript, and in the decision to publish the results.

References

  1. Brunekreef, B.; Holgate, S. Air pollution and health. Lancet 2002, 360, 1233–1242. [Google Scholar] [CrossRef]
  2. Organization, W.H. Health Aspects of Air Pollution with Particulate Matter, Ozone and Nitrogen Dioxide; Report on a WHO Working Group; World Health Organization: Bonn, Germany, 2003. [Google Scholar]
  3. Weissmann, M.; Braun, F.; Gantner, L.; Mayr, G.; Rahm, S.; Reitebuch, O. The Alpine mountain–Plain circulation: Airborne Doppler lidar measurements and numerical simulations. Mon. Weather Rev. 2005, 133, 3095–3109. [Google Scholar] [CrossRef]
  4. Ding, K.; Liu, J.; Ding, A.; Liu, Q.; Zhao, T.; Shi, J.; Han, Y.; Wang, H.; Jiang, F. Uplifting of carbon monoxide from biomass burning and anthropogenic sources to the free troposphere in East Asia. Atmos. Chem. Phys. 2015, 15, 2843–2866. [Google Scholar] [CrossRef] [Green Version]
  5. Lang, M.N.; Gohm, A.; Wagner, J. The impact of embedded valleys on daytime pollution transport over a mountain range. Atmos. Chem. Phys. 2015, 15, 11981–11998. [Google Scholar] [CrossRef] [Green Version]
  6. Henne, S.; Furger, M.; Nyeki, S.; Steinbacher, M.; Neininger, B.; De Wekker, S.; Dommen, J.; Spichtinger, N.; Stohl, A.; Prévôt, A. Quantification of topographic venting of boundary layer air to the free troposphere. Atmos. Chem. Phys. 2004, 4, 497–509. [Google Scholar] [CrossRef] [Green Version]
  7. Belis, C.; Cancelinha, J.; Duane, M.; Forcina, V.; Pedroni, V.; Passarella, R.; Tanet, G.; Douglas, K.; Piazzalunga, A.; Bolzacchini, E.; et al. Sources for PM air pollution in the Po Plain, Italy: I. Critical comparison of methods for estimating biomass burning contributions to benzo (a) pyrene. Atmos. Environ. 2011, 45, 7266–7275. [Google Scholar] [CrossRef]
  8. Ferrero, L.; Castelli, M.; Ferrini, B.; Moscatelli, M.; Perrone, M.; Sangiorgi, G.; D’Angelo, L.; Rovelli, G.; Moroni, B.; Scardazza, F.; et al. Impact of black carbon aerosol over Italian basin valleys: high-resolution measurements along vertical profiles, radiative forcing and heating rate. Atmos. Chem. Phys. 2014, 14, 9641–9664. [Google Scholar] [CrossRef] [Green Version]
  9. Larsen, B.; Gilardoni, S.; Stenström, K.; Niedzialek, J.; Jimenez, J.; Belis, C. Sources for PM air pollution in the Po Plain, Italy: II. Probabilistic uncertainty characterization and sensitivity analysis of secondary and primary sources. Atmos. Environ. 2012, 50, 203–213. [Google Scholar] [CrossRef]
  10. Bucci, S.; Cristofanelli, P.; Decesari, S.; Marinoni, A.; Sandrini, S.; Größ, J.; Wiedensohler, A. Vertical distribution of aerosol optical properties in the Po Valley during the 2012 summer campaigns. Atmos. Chem. Phys. 2018, 18, 5371–5389. [Google Scholar] [CrossRef]
  11. Bigi, A.; Ghermandi, G. Trends and variability of atmospheric PM 2.5 and PM 10–2.5 concentration in the Po Valley, Italy. Atmos. Chem. Phys. 2016, 16, 15777–15788. [Google Scholar] [CrossRef]
  12. Ferrero, L.; Mocnik, G.; Ferrini, B.; Perrone, M.; Sangiorgi, G.; Bolzacchini, E. Vertical profiles of aerosol absorption coefficient from micro-Aethalometer data and Mie calculation over Milan. Sci. Total Environ. 2011, 409, 2824–2837. [Google Scholar] [CrossRef] [PubMed]
  13. Gao, F.; Stanič, S.; Bergant, K.; Bolte, T.; Coren, F.; He, T.; Hrabar, A.; Jerman, J.; Mladenovič, A.; Turšič, J.; et al. Monitoring presence and streaming patterns of Icelandic volcanic ash during its arrival to Slovenia. Biogeosciences 2011, 8, 2351. [Google Scholar] [CrossRef]
  14. Denjean, C.; Cassola, F.; Mazzino, A.; Triquet, S.; Chevaillier, S.; Grand, N.; Bourrianne, T.; Momboisse, G.; Sellegri, K.; Schwarzenbock, A.; et al. Size distribution and optical properties of mineral dust aerosols transported in the western Mediterranean. Atmos. Chem. Phys. 2016, 16, 1081–1104. [Google Scholar] [CrossRef] [Green Version]
  15. Córdoba-Jabonero, C.; Sicard, M.; Ansmann, A.; Águila, A.; Baars, H. Separation of the optical and mass features of particle components in different aerosol mixtures by using POLIPHON retrievals in synergy with continuous polarized Micro-Pulse Lidar (P-MPL) measurements. Atmos. Meas. Tech. 2018, 11, 4775–4795. [Google Scholar] [CrossRef]
  16. He, T.; Stanič, S.; Gao, F.; Bergant, K.; Veberič, D.; Song, X.; Dolžan, A. Tracking of urban aerosols using combined LIDAR-based remote sensing and ground-based measurements. Atmos. Meas. Tech. 2012, 5, 891–900. [Google Scholar] [CrossRef] [Green Version]
  17. He, T.Y.; Gao, F.; Stanič, S.; Veberič, D.; Bergant, K.; Dolžan, A.; Song, X.Q. Scanning mobile lidar for aerosol tracking and biological aerosol identification. Remote Sens. Int. Soc. Opt. Photonics 2010, 7832. [Google Scholar] [CrossRef]
  18. Drinovec, L.; Močnik, G.; Zotter, P.; Prévôt, A.; Ruckstuhl, C.; Coz, E.; Rupakheti, M.; Sciare, J.; Müller, T.; Wiedensohler, A.; et al. The “dual-spot” Aethalometer: An improved measurement of aerosol black carbon with real-time loading compensation. Atmos. Meas. Tech. 2015, 8, 1965. [Google Scholar] [CrossRef]
  19. Sandradewi, J.; Prévôt, A.S.; Szidat, S.; Perron, N.; Alfarra, M.R.; Lanz, V.A.; Weingartner, E.; Baltensperger, U. Using aerosol light absorption measurements for the quantitative determination of wood burning and traffic emission contributions to particulate matter. Environ. Sci. Technol. 2008, 42, 3316–3323. [Google Scholar] [CrossRef]
  20. Schnaiter, M.; Horvath, H.; Möhler, O.; Naumann, K.H.; Saathoff, H.; Schöck, O. UV-VIS-NIR spectral optical properties of soot and soot-containing aerosols. J. Aerosol Sci. 2003, 34, 1421–1444. [Google Scholar] [CrossRef]
  21. Healy, R.M.; Sofowote, U.; Su, Y.; Debosz, J.; Noble, M.; Jeong, C.H.; Wang, J.; Hilker, N.; Evans, G.J.; Doerksen, G.; et al. Ambient measurements and source apportionment of fossil fuel and biomass burning black carbon in Ontario. Atmos. Environ. 2017, 161, 34–47. [Google Scholar] [CrossRef]
  22. Liu, Y.; Daum, P. The effect of refractive index on size distributions and light scattering coefficients derived from optical particle counters. J. Aerosol Sci. 2000, 31, 945–957. [Google Scholar] [CrossRef]
  23. Weinzierl, B.; Sauer, D.; Esselborn, M.; Petzold, A.; Veira, A.; Rose, M.; Mund, S.; Wirth, M.; Ansmann, A.; Tesche, M.; et al. Microphysical and optical properties of dust and tropical biomass burning aerosol layers in the Cape Verde region—an overview of the airborne in situ and lidar measurements during SAMUM-2. Tellus B Chem. Phys. Meteorol. 2011, 63, 589–618. [Google Scholar] [CrossRef]
  24. Willis, W.B.; Eichinger, W.E.; Prueger, J.H.; Hapeman, C.J.; Li, H.; Buser, M.D.; Hatfield, J.L.; Wanjura, J.D.; Holt, G.A.; Torrents, A.; et al. Lidar method to estimate emission rates from extended sources. J. Atmos. Ocean. Technol. 2017, 34, 335–345. [Google Scholar] [CrossRef]
  25. Scarnato, B.; China, S.; Nielsen, K.; Mazzoleni, C. Perturbations of the optical properties of mineral dust particles by mixing with black carbon: A numerical simulation study. Atmos. Chem. Phys. 2015, 15, 6913–6928. [Google Scholar] [CrossRef]
  26. Kitchen, M. Representativeness errors for radiosonde observations. Q. J. R. Meteorol. Soc. 1989, 115, 673–700. [Google Scholar] [CrossRef]
  27. Mole, M. Study of the Properties of Air Flow Over Orographic Barrier. Ph.D. Thesis, University of Nova Gorica, Nova Gorica, Slovenia, 2017. [Google Scholar]
  28. Klett, J.D. Stable analytical inversion solution for processing lidar returns. Appl. Opt. 1981, 20, 211–220. [Google Scholar] [CrossRef]
  29. Vaughan, M.; Winker, D.M.; Powell, K. CALIOP algorithm theoretical basis document, part 2: Feature detection and layer properties algorithms. Rep. PC-SCI 2005, 202, 87. [Google Scholar]
  30. Liu, J.; Huang, J.; Chen, B.; Zhou, T.; Yan, H.; Jin, H.; Huang, Z.; Zhang, B. Comparisons of PBL heights derived from CALIPSO and ECMWF reanalysis data over China. J. Quant. Spectrosc. Radiat. Transf. 2015, 153, 102–112. [Google Scholar] [CrossRef]
  31. Willis, W.B.; Eichinger, W.E.; Prueger, J.H.; Hapeman, C.J.; Li, H.; Buser, M.D.; Hatfield, J.L.; Wanjura, J.D.; Holt, G.A.; Torrents, A.; et al. Particulate capture efficiency of a vegetative environmental buffer surrounding an animal feeding operation. Agric. Ecosyst. Environ. 2017, 240, 101–108. [Google Scholar] [CrossRef]
  32. Mätzler, C. MATLAB functions for Mie scattering and absorption, version 2. IAP Res. Rep. 2002, 8, 1–24. [Google Scholar]
  33. He, C.; Liou, K.; Takano, Y.; Zhang, R.; Levy Zamora, M.; Yang, P.; Li, Q.; Leung, L.R. Variation of the radiative properties during black carbon aging: theoretical and experimental intercomparison. Atmos. Chem. Phys. 2015, 15, 11967–11980. [Google Scholar] [CrossRef] [Green Version]
  34. China, S.; Scarnato, B.; Owen, R.C.; Zhang, B.; Ampadu, M.T.; Kumar, S.; Dzepina, K.; Dziobak, M.P.; Fialho, P.; Perlinger, J.A.; et al. Morphology and mixing state of aged soot particles at a remote marine free troposphere site: Implications for optical properties. Geophys. Res. Lett. 2015, 42, 1243–1250. [Google Scholar] [CrossRef] [Green Version]
  35. Reid, J.; Eck, T.; Christopher, S.; Koppmann, R.; Dubovik, O.; Eleuterio, D.; Holben, B.; Reid, E.; Zhang, J. A review of biomass burning emissions part III: Intensive optical properties of biomass burning particles. Atmos. Chem. Phys. 2005, 5, 827–849. [Google Scholar] [CrossRef]
  36. Bond, T.C.; Bergstrom, R.W. Light absorption by carbonaceous particles: An investigative review. Aerosol Sci. Technol. 2006, 40, 27–67. [Google Scholar] [CrossRef]
  37. Schkolnik, G.; Chand, D.; Hoffer, A.; Andreae, M.; Erlick, C.; Swietlicki, E.; Rudich, Y. Constraining the density and complex refractive index of elemental and organic carbon in biomass burning aerosol using optical and chemical measurements. Atmos. Environ. 2007, 41, 1107–1118. [Google Scholar] [CrossRef]
  38. Zotter, P.; Herich, H.; Gysel, M.; El-Haddad, I.; Zhang, Y.; Močnik, G.; Hüglin, C.; Baltensperger, U.; Szidat, S.; Prévôt, A.S.H. Evaluation of the absorption Ångström exponents for traffic and wood burning in the Aethalometer-based source apportionment using radiocarbon measurements of ambient aerosol. Atmos. Chem. Phys. 2017, 17, 4229–4249. [Google Scholar] [CrossRef] [Green Version]
  39. Platt, S.M.; Haddad, I.; Zardini, A.A.; Clairotte, M.; Astorga, C.; Wolf, R.; Slowik, J.G.; Temime-Roussel, B.; Marchand, N.; Ježek, I.; et al. Secondary organic aerosol formation from gasoline vehicle emissions in a new mobile environmental reaction chamber. Atmos. Chem. Phys. 2013, 13, 9141–9158. [Google Scholar] [CrossRef] [Green Version]
  40. Kumar, N.K.; Corbin, J.C.; Bruns, E.A.; Massabó, D.; Slowik, J.G.; Drinovec, L.; Močnik, G.; Prati, P.; Vlachou, A.; Baltensperger, U.; et al. Production of particulate brown carbon during atmospheric aging of residential wood-burning emissions. Atmos. Chem. Phys. 2018, 18, 17843–17861. [Google Scholar] [CrossRef]
  41. Kahnert, M.; Nousiainen, T.; Lindqvist, H. Models for integrated and differential scattering optical properties of encapsulated light absorbing carbon aggregates. Opt. Express 2013, 21, 7974–7993. [Google Scholar] [CrossRef] [PubMed]
  42. Adler, B. Boundary-Layer Processes Producing Mesoscale Water-Vapour Variability Over a Mountainous Island; KIT Scientific Publishing: Karlsruhe, Germany, 2014; Volume 67. [Google Scholar]
  43. Formenti, P.; Schütz, L.; Balkanski, Y.; Desboeufs, K.; Ebert, M.; Kandler, K.; Petzold, A.; Scheuvens, D.; Weinbruch, S.; Zhang, D. Recent progress in understanding physical and chemical properties of African and Asian mineral dust. Atmos. Chem. Phys. 2011, 11, 8231–8256. [Google Scholar] [CrossRef] [Green Version]
  44. Saleh, R.; Hennigan, C.; McMeeking, G.; Chuang, W.; Robinson, E.; Coe, H.; Donahue, N.; Robinson, A. Absorptivity of brown carbon in fresh and photo-chemically aged biomass-burning emissions. Atmos. Chem. Phys. 2013, 13, 7683–7693. [Google Scholar] [CrossRef] [Green Version]
  45. Aouizerats, B.; Van der Werf, G.R.; Balasubramanian, R.; Betha, R. Importance of transboundary transport of biomass burning emissions to regional air quality in Southeast Asia during a high fire event. Atmos. Chem. Phys. 2015, 15, 363–373. [Google Scholar] [CrossRef] [Green Version]
  46. Omar, A.; Winker, D.; Vaughan, M.; Hu, Y.; Trepte, C.; Ferrare, R.; Lee, K.; Hostetler, C.; Kittaka, C.; Rogers, R.; et al. The CALIPSO automated aerosol classification and lidar ratio selection algorithm. J. Atmos. Ocean. Technol. 2009, 26, 1994–2014. [Google Scholar] [CrossRef]
Figure 1. Terrain configuration across the Vipava valley (126 m a.s.l.), which is to the north closed by the Trnovski gozd and to the south by the Karst plateau. Both lidar and in-situ monitoring stations were located in Ajdovščina. An additional in-situ station was at Otlica (826 m a.s.l., horizontally displaced by 5 km). Both stations are denoted by red dots. The prevailing wind directions in April 2016 were from NE to SE (inlaid figure), where the color bar represents wind speed in m/s. Wind measurements were performed in Ajdovščina.
Remotesensing 11 00106 g001
Figure 2. (a) Linear correlation between the aethalometer- and OPC-based absorption coefficients ( b AE 33 and b OPC ) at 950 nm; (b) Linear correlation between the PM concentrations obtained from lidar measurements at the beginning of the complete overlap range (0.2 km) and PM concentration obtained from the OPC. The results are based on the April 2016 data.
Remotesensing 11 00106 g002
Figure 3. (a) Meteorological conditions in the Vipava valley. Wind speed is shown in blue and rainfall in red. Rainy periods, highlighted by gray shades, separate four episodes (EP1, EP2, EP3, EP4). (b) Temporal evolution of PM 10 (red), PM C o a r s e (1 μ m < particle size < 10 μ m, green) and BC concentration (black) at Ajdovščina, where the two selected cases are marked by light shades. (c) Daily average of the PBL height from each 30 min sampling, and corresponding standard deviation at Ajdovščina. Retrieved from lidar measurements, which were performed during cloud-free periods. All datasets were collected between 1–30 April 2016.
Remotesensing 11 00106 g003
Figure 4. (a) DREAM model forecast of vertical and horizontal distribution of Saharan dust concentration. Vertical dashed line represents Otlica. (b) HYSPLIT backward trajectories over 72 h, arriving over Vipava valley at 6:00 CET on 6 April 2016. Different trajectory colors indicate different altitudes (0.5 km is green, 1 km is blue and 2 km is red). Trajectories mainly originate from North Africa.
Remotesensing 11 00106 g004
Figure 5. Temporal variation of aerosol layers over the Vipava valley between 5 April 2016 at 20:00 and 6 April 2016 at 5:00 CET, in terms of the range-corrected lidar signal. The gap in the lidar data is due to technical issues. Two elevated aerosol layers can be seen during the measurement, the higher one at 1.5–2.5 km, and the lower one at 0.8–1.2 km above the ground.
Remotesensing 11 00106 g005
Figure 6. Radiosonde profiles from Ljubljana (blue) at 5:00 CET and Udine (red) at 1:00 CET on 6 April 2016. (a) Virtual potential temperature ( θ V ), (b) temperature, (c) relative humidity, (d) wind speed, and (e) wind direction. The two black horizontal lines represent the range of PBL heights between the two measurements.
Remotesensing 11 00106 g006
Figure 7. (a) Variation of BC and PM concentrations and PBL height (estimated from Lidar measurements). The peak of BC concentration was found to be 9 μ g/m 3 , between 8:00 and 10:00 CET. Due to the increase of the PBL height in the daytime, the BC concentrations at Otlica and Ajdovščina are comparable after 12:00 CET. (b) PM 10 and PM C o a r s e were derived from measurements in Ajdovščina, while the AAE was measured at both sites. Comparable values of AAE at Otlica and Ajdovščina imply similar composition of aerosol types.
Remotesensing 11 00106 g007
Figure 8. Profiles of PM 10 lidar , obtained between 5 April 2016, 21:00 CET and 6 April 2016, 17:30 CET. Black dots represent the mean value of mass concentration obtained using the conversion factor measured at Ajdovščina. Yellow dots represent the mass concentration obtained using the conversion factor for mineral dust, based on [15]. Error bars show total uncertainty on PM 10 lidar , where the blue error bars correspond only to the uncertainty ( μ m ) due to the refractive index. The horizontal black line denotes the top of the PBL. The black circle represents the average value of the OPC measurement of PM 10 , and the error bar its temporal variation.
Remotesensing 11 00106 g008
Figure 9. SEM images of water-insoluble particles collected from rainwater on 8 April 2016. (a) Coarse crystalline mineral particles with several fragments of diatoms (marked with blue arrows) composed mainly of Si, well-rounded quartz, and different alumino-silicate minerals (feldspars, clay minerals, micas); (b) agglomerate of Fe-oxide alumino-silicate mineral; (c) Mg-dominated fibrous alumino-silicate mineral, most probably palygorskite; (d) alumino-silicate minerals with dominating Fe, Mg, K probably biotite; (e) mixture of mineral particles and soot agglomerate (red arrow), fibrous mineral (yellow arrow) represents palygorskite; and (f) alumino-silicates (blue arrow) and tar balls (green arrow).
Remotesensing 11 00106 g009
Figure 10. Temporal variation of aerosol distribution over the Vipava valley between 19:00 to 24:00 CET on 30 April 2016, in terms of the range-corrected lidar signal. Two significant high aerosol loading periods can be seen during the measurement, which started around 21:00 and 22:30.
Remotesensing 11 00106 g010
Figure 11. Evolution of concentrations of BC, PM concentrations at both sites, and and PBL height between 18:00 to 00:00 on 2016, 30th April: (a) The BC at two measurement sites and PBL height are used for checking the aerosol mixing state; (b) the PM 10 , PM C o a r s e were measured at Ajdovščina station, and AAE was monitored at both sites.
Remotesensing 11 00106 g011
Figure 12. Profiles of PM 10 lidar , obtained between 18:00 and 24:00 CET on 30 April 2016. Black dots represent the mean value of mass concentration obtained using the conversion factor measured at Ajdovščina. Error bars show total uncertainty on PM 10 lidar , where the blue error bars correspond only to the uncertainty ( μ m ) due to the refractive index. The black circle represents the average value of the OPC measurement of PM 10 and the error bar its temporal variation.
Remotesensing 11 00106 g012aRemotesensing 11 00106 g012b
Figure 13. SEM images of aerosol sample collected on 30 April—the bonfire night: (a) Externally mixed soot particles (blue arrow) and particles consisting of organic material (OM, yellow arrow); (b) OM (yellow arrow); (c) OM; (d) fresh soot agglomerate; (e) aged soot; (f) internal mixture of soot agglomerate and OM-soot is imbedded in OM. Black circles are holes in nuclepore filter.
Remotesensing 11 00106 g013
Figure 14. Correlation between BC concentration and PM 1 / PM 10 ratio (a) and between BC and PM 1 (b) for the entire campaign (1–30 April 2016). In (a), data points corresponding to Case 1 (mineral dust) are plotted in red and those corresponding to Case 2 (biomass burning) in violet. In (b), the color of the data points represents AAE value.
Remotesensing 11 00106 g014
Table 1. Mean values of the in-situ measured quantities during the presence of mineral dust (Case 1, 5–6 April 2016) and BB aerosols (Case 2, 30 April 2016). Ratios of PM 1 /PM 10 and BC/PM 10 are the most indicative for the identification of aerosol type. LR values are, within uncertainties (20 %), in agreement with previous studies [46], performed under similar conditions.
MeasuredCase 1Case 2
QuantitiesAjdovščinaOtlicaAjdovščinaOtlica
PM 10 [ μ g/m 3 ] 25.1 29.9
PM 1 [ μ g/m 3 ] 11.0 28.9
BC [ μ g/m 3 ] 1.2 1.10 3.4 0.6
MEE [m 2 /g] 2.5 3.0
LR [sr]55 50
AAE 1.2 1.30 1.6 1.6
PM 1 /PM 10 0.44 0.94
BC/PM 10 0.05 0.11

