The Effect of Eutypella parasitica on the Wood Decay of Three Maple Species


1
Department of Forest Protection, Slovenian Forestry Institute, 1000 Ljubljana, Slovenia
2
Department of Forestry and Renewable Forest Resources, Biotechnical Faculty, University of Ljubljana, 1000 Ljubljana, Slovenia
3
Department of Wood Science and Technology, Biotechnical Faculty, University of Ljubljana, 1000 Ljubljana, Slovenia
4
Department of Forest Yield and Silviculture, Slovenian Forestry Institute, 1000 Ljubljana, Slovenia
*
Author to whom correspondence should be addressed.
Forests 2020, 11(6), 671; https://doi.org/10.3390/f11060671
Submission received: 21 May 2020
/
Revised: 8 June 2020
/
Accepted: 10 June 2020
/
Published: 12 June 2020
(This article belongs to the Special Issue Wood Decay Fungi)
Abstract
:Eutypella parasitica R.W. Davidson & R.C. Lorenz is the causative agent of Eutypella canker of maple, a destructive disease of maples in Europe and North America. The fungus E. parasitica is known to cause wood stain and decay. However, it is not known how effectively it decomposes the wood of the most widespread maple species in Europe. Wood samples of Acer pseudoplatanus L., A. platanoides L., and A. campestre L. were exposed to four isolates of E. parasitica and nine other fungal species for comparison, according to the modified EN 113 standard. After 15 weeks of incubation, mass loss and microscopical analysis of samples showed evidence of colonization and different wood decay potentials among fungal species. A highly significant positive correlation was found between mass loss and moisture content for all fungal species. Similarly, the measured cell wall thickness correlated well with the calculated mass loss of the samples. On average, the fungal species caused the lowest mass loss in A. pseudoplatanus (10.0%) and the highest in A. campestre (12.6%) samples. Among the samples exposed to E. parasitica isolates, the highest mass loss was recorded in A. pseudoplatanus (6.6%). Statistical analysis showed significant differences in mass loss and moisture content between different E. parasitica isolates. Based on the results of staining, we discuss the type of decay caused by E. parasitica. Although E. parasitica isolates caused smaller mass loss of samples compared to other more effective decay species, we should not disregard its capability of degrading maple wood. Because E. parasitica usually infects the lower portion of the trunk, which is the largest and most valuable part of the tree, any damage can cause significant economic and resource loss.
1. Introduction
Wood decay is the biological process by which cell wall components (cellulose, hemicellulose, and lignin) are converted to carbon dioxide and water with a release of energy [1,2]. Within a wide spectrum of different types of decay, three main categories are commonly recognized: brown rot, white rot, and soft rot [3]. Different fungi utilize different strategies for degradation and attack the main chemical components of wood [4,5]. When wood-degrading fungi grow through vascular tissues and metabolize wood, a decrease in wood mass and strength usually occurs [2,5]. It is estimated that a 10% loss of wood mass can result in a 70 to 90% loss in wood strength, depending on the wood species and type of decay [2]. Not all fungal infestations cause degradation [5]. Various host species can be affected differently by the same fungus [6].
Non-basidiomycete fungi (predominantly ascomycete) can cause substantial degradation of wood, but comprehensive studies on the effects of such fungi are rare [7,8,9]. Eutypella parasitica R.W. Davidson & R.C. Lorenz, the causative agent of Eutypella canker of maple, causes a serious disease that affects the aesthetic and economic value of infected maple trees [10]. The fungus is believed to originate from North America [11] and represents a considerable risk for an extensive area of naturally distributed maples in Europe [12]. According to the data of French [13], the decay of Acer saccharum Marshall, A. rubrum L., and A. saccharinum L. wood exposed to E. parasitica is extremely slow. His study did not identify differences in the effect of different isolates on the degradation of wood. In general, French [11] recorded greater mass loss in sapwood than in false heartwood.
Based on a literature study, we found that there is no consistency in decay type caused by Eutypella species. Worrall, Anagnost and Zabel [7] suggested that E. parasitica has the ability to cause soft rot decay. In contrast, data on wood colonization suggest that, in early stages, Eutypella species could be considered as a soft rot fungus, but, in more advanced stages, they show a uniform degradation similar to white rot [14]. Pildain, Novas, and Carmarán [14] stated that the type of decay is difficult to define and differentiate because of the difference in observed features in enzyme tests and anatomical studies. After Worrall, Anagnost, and Zabel [7], they suggested the use of the taxonomy of the causal agent as the defining factor in such cases. One of the possible reasons for the observed differences is the fact that the same fungi can cause different types of decay depending on the environmental conditions, predominantly moisture content in the living or dead tree [15].
Eutypella parasitica is known to cause wood stain and decay. However, it is not known how effectively it decomposes the wood of the most widespread European maple species. Therefore, the aim of our study was to determine the mass loss and moisture content of Acer pseudoplatanus L., A. platanoides L. and A. campestre L. samples after exposure to several E. parasitica isolates. The results were compared to the impact of five frequently isolated fungal species from the wood of dead branches of A. pseudoplatanus [16] and to two well-known basidiomycete decay fungi—Trametes versicolor (L.) Lloyd and Gloeophyllum trabeum (Pers.) Murrill. In addition, light and scanning electron microscopy were used to examine the differences in wood structure between exposed and control samples of A. pseudoplatanus. We expected relatively low mass loss of maple wood due to E. parasitica compared to other fungal species included in the experiment since there are at least two (T. versicolor and G. trabeum) known as significant rot fungi.
2. Materials and Methods
2.1. Decay Test
Three maple species (Acer pseudoplatanus, A. platanoides, and A. campestre) were used in the experiment. The wood originated from the south-eastern part of Slovenia (45.8491° N, 15.6113° E, 390 m a.s.l.), where all three species grow naturally. Cross-sections were taken approximately 1 m above the ground from visually healthy trees. Until further processing they were stored in an LTH ZO 700 BEZ freezer cabinet (Loška hladilna tehnika, Škofja Loka, Slovenia) at −20 °C for 7 to 20 days. One hundred and sixty wood samples (30 × 10 × 5 mm) were made from each maple species. The initial dry mass of the samples was determined using a Kern ABJ220-4NM analytical balance (Kern & Sohn, Balingen, Germany) after oven drying the samples at 103 °C for 24 h in a Kambič SP-250 oven (Kambič, Semič, Slovenia). Thereafter, samples were steam sterilized (30 min, 121 °C, 0.12 MPa) in a Kambič A-65 V autoclave (Kambič, Semič, Slovenia) and further used in the decay test.
The decay test was performed according to the modified EN 113 standard [17,18,19,20]. Disposable Petri dishes (Ø = 90 mm, h = 15 mm) containing 3.9% (w/v) potato dextrose agar (PDA; Becton Dickinson, Sparks, MD, USA) were inoculated with ten different fungal species (Table 1). After one week of fungal growth, the wood samples were exposed to the different fungi. Two wood samples were placed on a sterilized plastic mesh, which was used to avoid direct contact between the samples and the nutrient medium in the Petri dish. Ten replicates per fungal isolate were used for each of the three maple species (450 samples in total). For comparison, ten control samples per maple species were placed in Petri dishes with sterile agar plugs. The assembled test dishes were incubated in a Kambič I-190 CK chamber (Kambič, Semič, Slovenia) at 23.9 ± 0.3 °C for 15 weeks. After incubation, the fungal mycelium was carefully removed from the samples, and they were weighed to obtain the mass of the wet sample. After 24 h of drying at 103 °C in a Kambič SP-250 oven (Kambič, Semič, Slovenia), the final dry mass was determined and the respective relative loss in mass was calculated using Equation (1). From the final dry and wet mass, the moisture content was calculated using Equation (2).
where m0 represents the initial dry mass, m1 the final wet mass, and m2 the final dry mass of the sample. Furthermore, the change in moisture content (ΔMC) was calculated using the following equation:
where MCE represents the average moisture content of samples exposed to the fungal species, and MCC is the average moisture content of the control samples.
Mass loss (%) = ((m0 − m2)/m0) × 100,
Moisture content (%) = ((m1 − m2)/m2) × 100,
ΔMC (%) = MCE − MCC,
A non-parametric Kruskal-Wallis test was used to compare average mass loss and moisture content between different isolates. Afterwards, a post-hoc multiple comparison Dunn test with Bonferroni correction was used. A paired t-test was used to compare the initial and final mean dry mass of samples exposed to different fungal isolates. For comparing mass loss and moisture content between the three maple species, the Welch two sample t-test was used. The Pearson correlation coefficient was calculated to investigate the relationship between mass loss and moisture content in all three maple species.
Additionally, the wood density of the samples was calculated using the equation:
where m0 represents the initial dry mass of a sample, and V is the volume of a single sample (1.5 × 10⁻⁶ m3 in our case). A non-parametric Kruskal-Wallis test with a post-hoc multiple comparison Dunn test with Bonferroni correction was used to compare the average wood density between the different maple species. The Pearson correlation coefficient was calculated to investigate the relationship between moisture content and wood density in all three maple species. The calculated average mass loss and average wood density were discussed and compared to other relevant studies.
Wood density (kg/m3) = m0/V,
2.2. Light and Scanning Electron Microscopy
Three randomly chosen wood samples (one per fungal isolate) of A. pseudoplatanus exposed to EP34, EP65, and TV were examined and compared to the control using light microscopy (LM) and scanning electron microscopy (SEM). For LM, halved samples were embedded in paraffin (Paraplast Plus, Leica Biosystems, Wetzlar, Germany) and cut with a Leica RM2245 rotary microtome (10 µm; Leica Biosystems, Wetzlar, Germany). Cross and tangential sections were stained with a safranin (Safranin T, Honeywell Fluka, Thermo Fisher Scientific, Waltham, Massachusetts, United States) (0.04%) and astra-blue (Astrablau FM, Carl Roth, Karlsruhe, Germany) (0.15%) water solution [21]. Safranin colors the polyphenol components, such as lignin, red, whereas astra-blue stains the cellulose/hemicellulose components of cell walls blue [22,23]. The sections were mounted on glass slides in Euparal (Waldeck, Münster, Germany), observed and photographed under a Leica DM4000 B light microscope with a Leica DCM 4500 camera and the Leica Application Suite software platform (Leica Microsystems, Wetzlar, Germany).
Wood colonization was also examined with SEM, using an Everhart-Thornley (ETD) detector in an FEI Quanta 250 scanning electron microscope (FEI, Hillsboro, Oregon, United States) at a working distance of between 7 and 9 mm and 1000× magnification. Prior to observation, samples were halved and smoothed at cross and tangential surfaces with a Leica SM2010R sliding microtome (Leica Biosystems, Wetzlar, Germany), adhered to the holder with carbon adhesive tabs and coated with Au/Pd sputter-coater (Q150R ES Coating System, Quorum technologies, Laughton, UK) for 30 s with 20 mA intensity. SEM micrographs were visualized with xT microscope control software v 6.2.11 build 3381 (Microsoft Corporation, Redmond, Washington, United States).
Histometric analysis of wood features was performed on cross-sections under an Olympus BX51 microscope (Olympus, Tokyo, Japan) with a Nikon Digital Sight DS-Fi1 camera (Nikon, Kanagawa, Japan) and NIS Elements BR software version 3.22.09 build 726 (Nikon, Tokyo, Japan). At 40× objective magnification, we measured the cell wall thickness (μm) of 30 randomly chosen fibers in the early, transition and late wood of A. pseudoplatanus. Additionally, 10 randomly chosen vessels were measured in the early, transition, and late wood of the same cross-sections. In total, the cell wall thickness of 90 fibers and 30 vessels was measured on cross-sections from each randomly chosen wood sample exposed to three fungal isolates and a control.
The Kruskal–Wallis test and a post-hoc Dunn test with Bonferroni correction were used to compare average fiber wall thickness between the three different parts of the wood increment (i.e., early, transition, and late wood) and between different isolates. For vessel wall thickness, an ANOVA and Tukey multiple comparison test was used. ANOVA with a post-hoc Tukey HSD test was used when the assumptions of normal distribution and homogeneity of variances had been met. In other cases, the non-parametric Kruskal-Wallis with a post-hoc Dunn test was used. To test the assumption of normality, the Shapiro-Wilk test was applied, and for testing the homogeneity of variances, the Levene test was used. In addition, the Pearson correlation coefficient was calculated to investigate the relationship between mass loss on the one hand, and average fiber and average vessel wall thickness on the other.
3. Results
3.1. Mass Loss
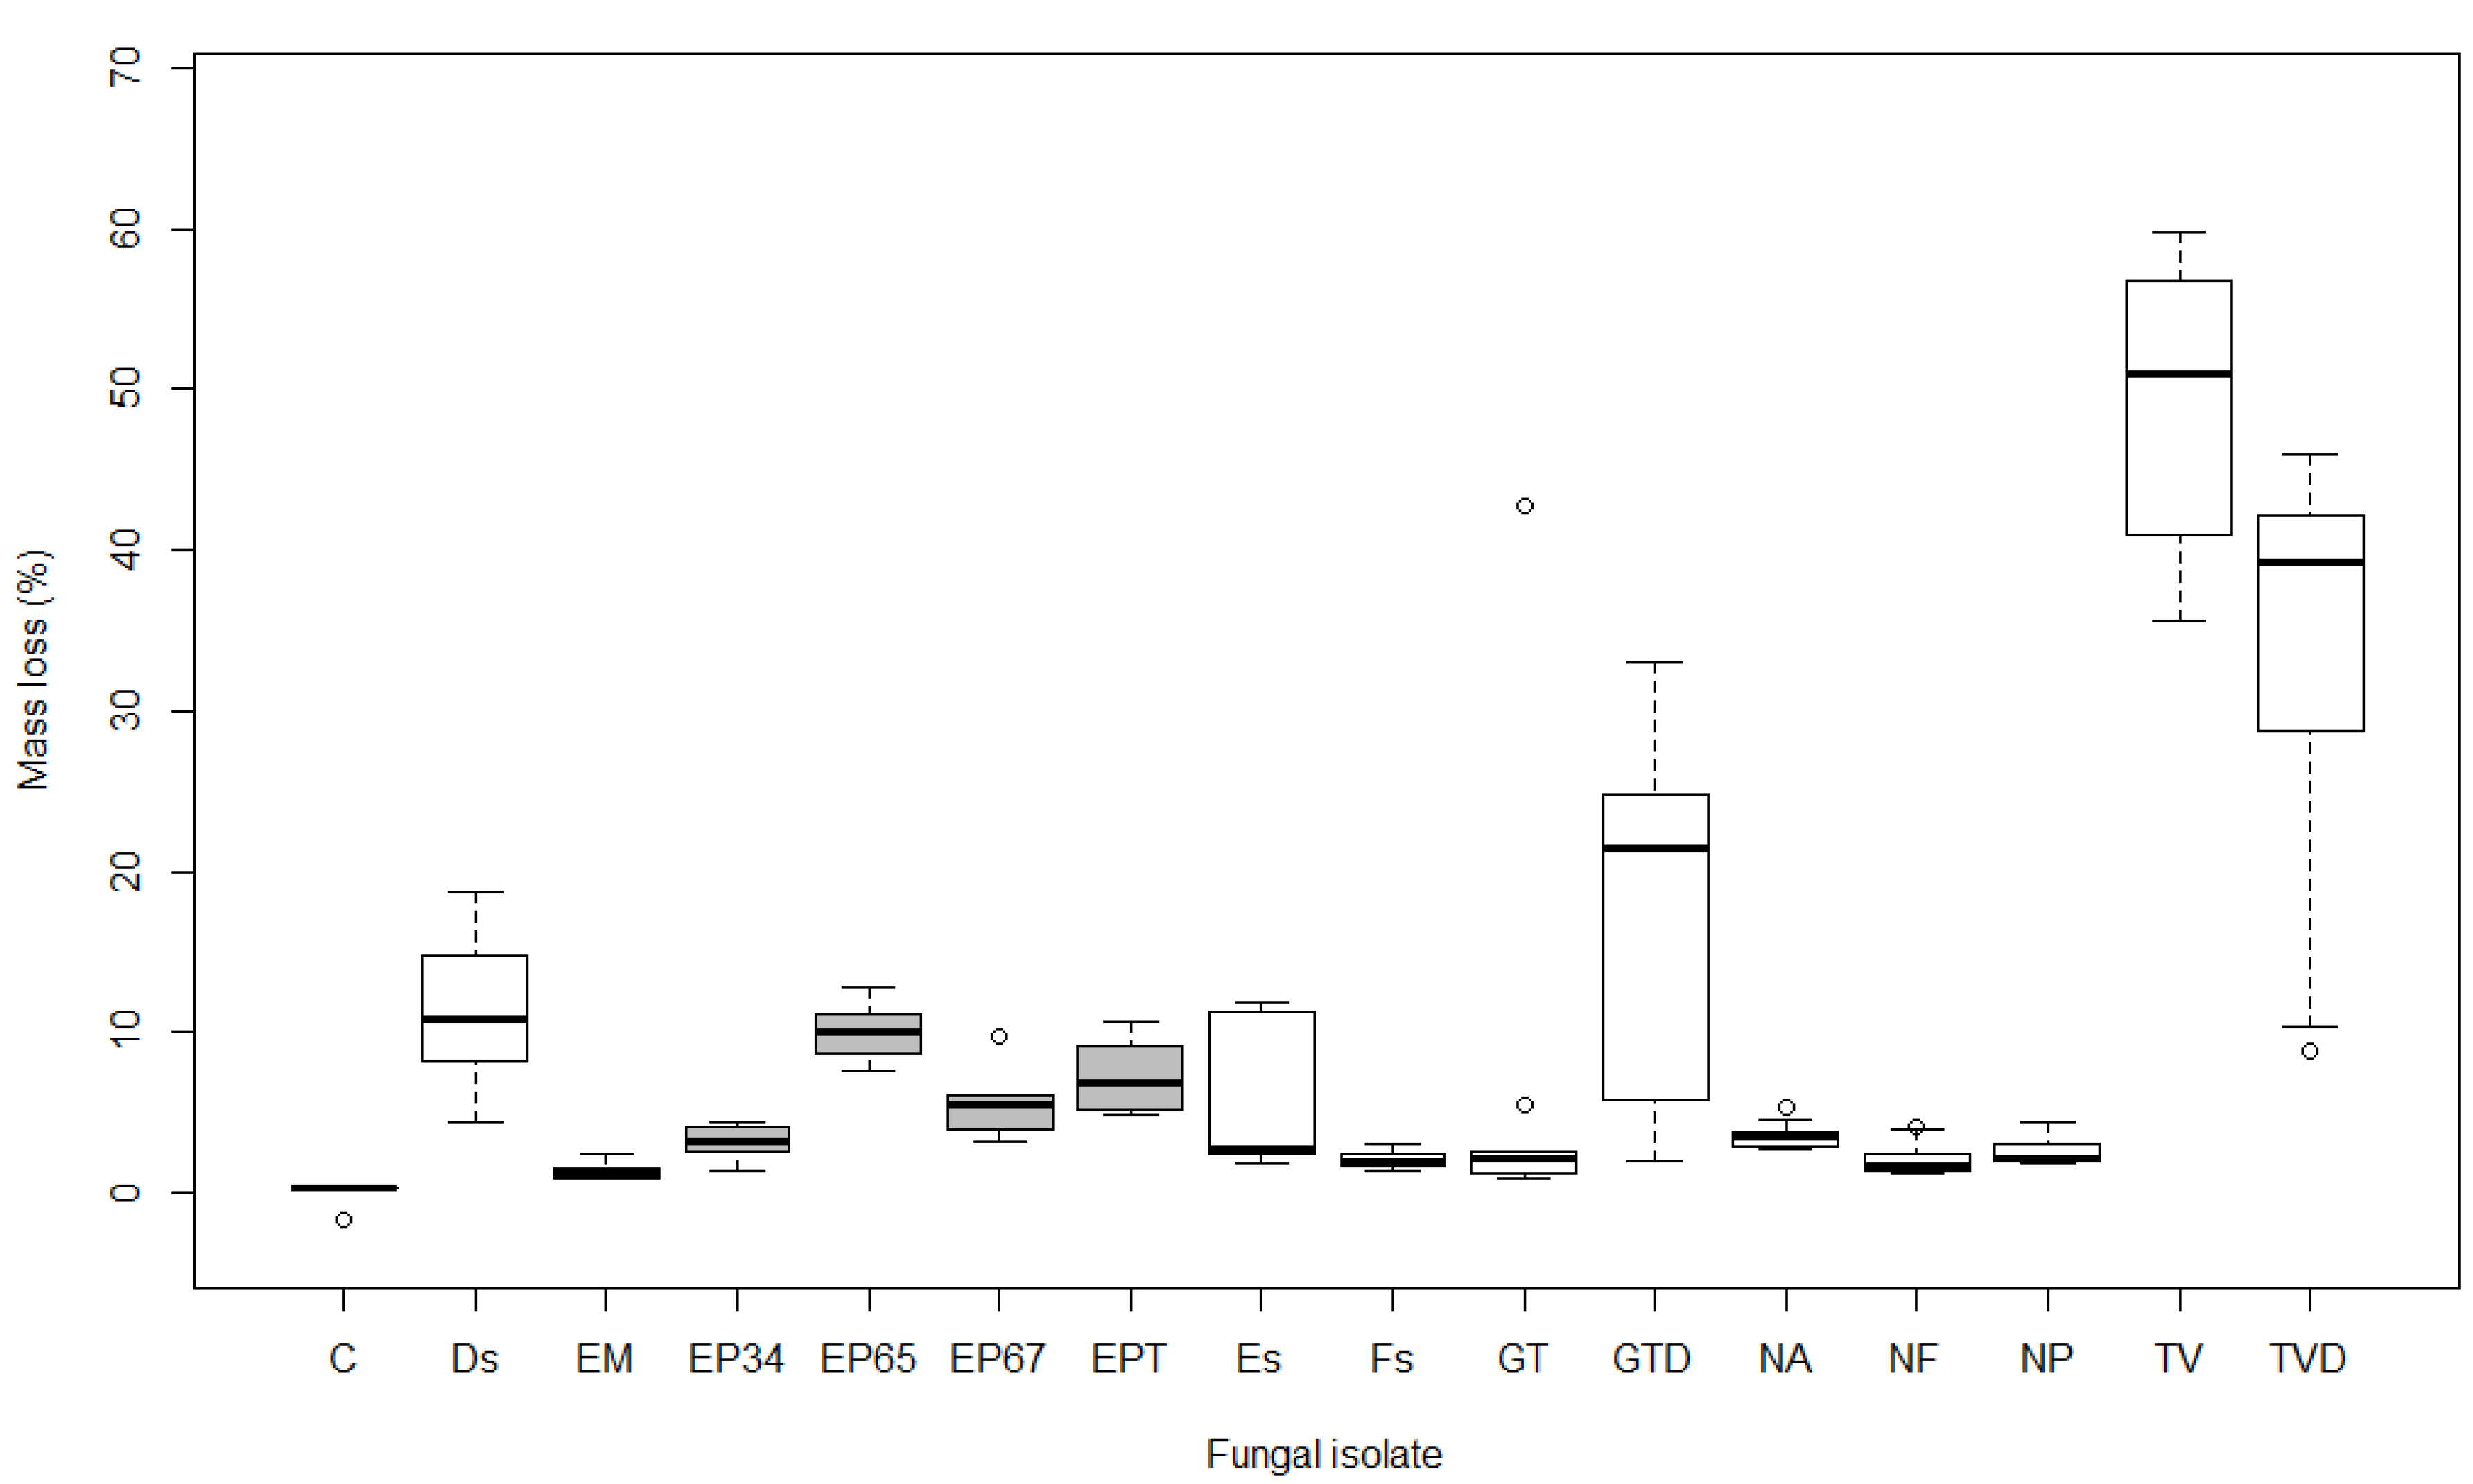
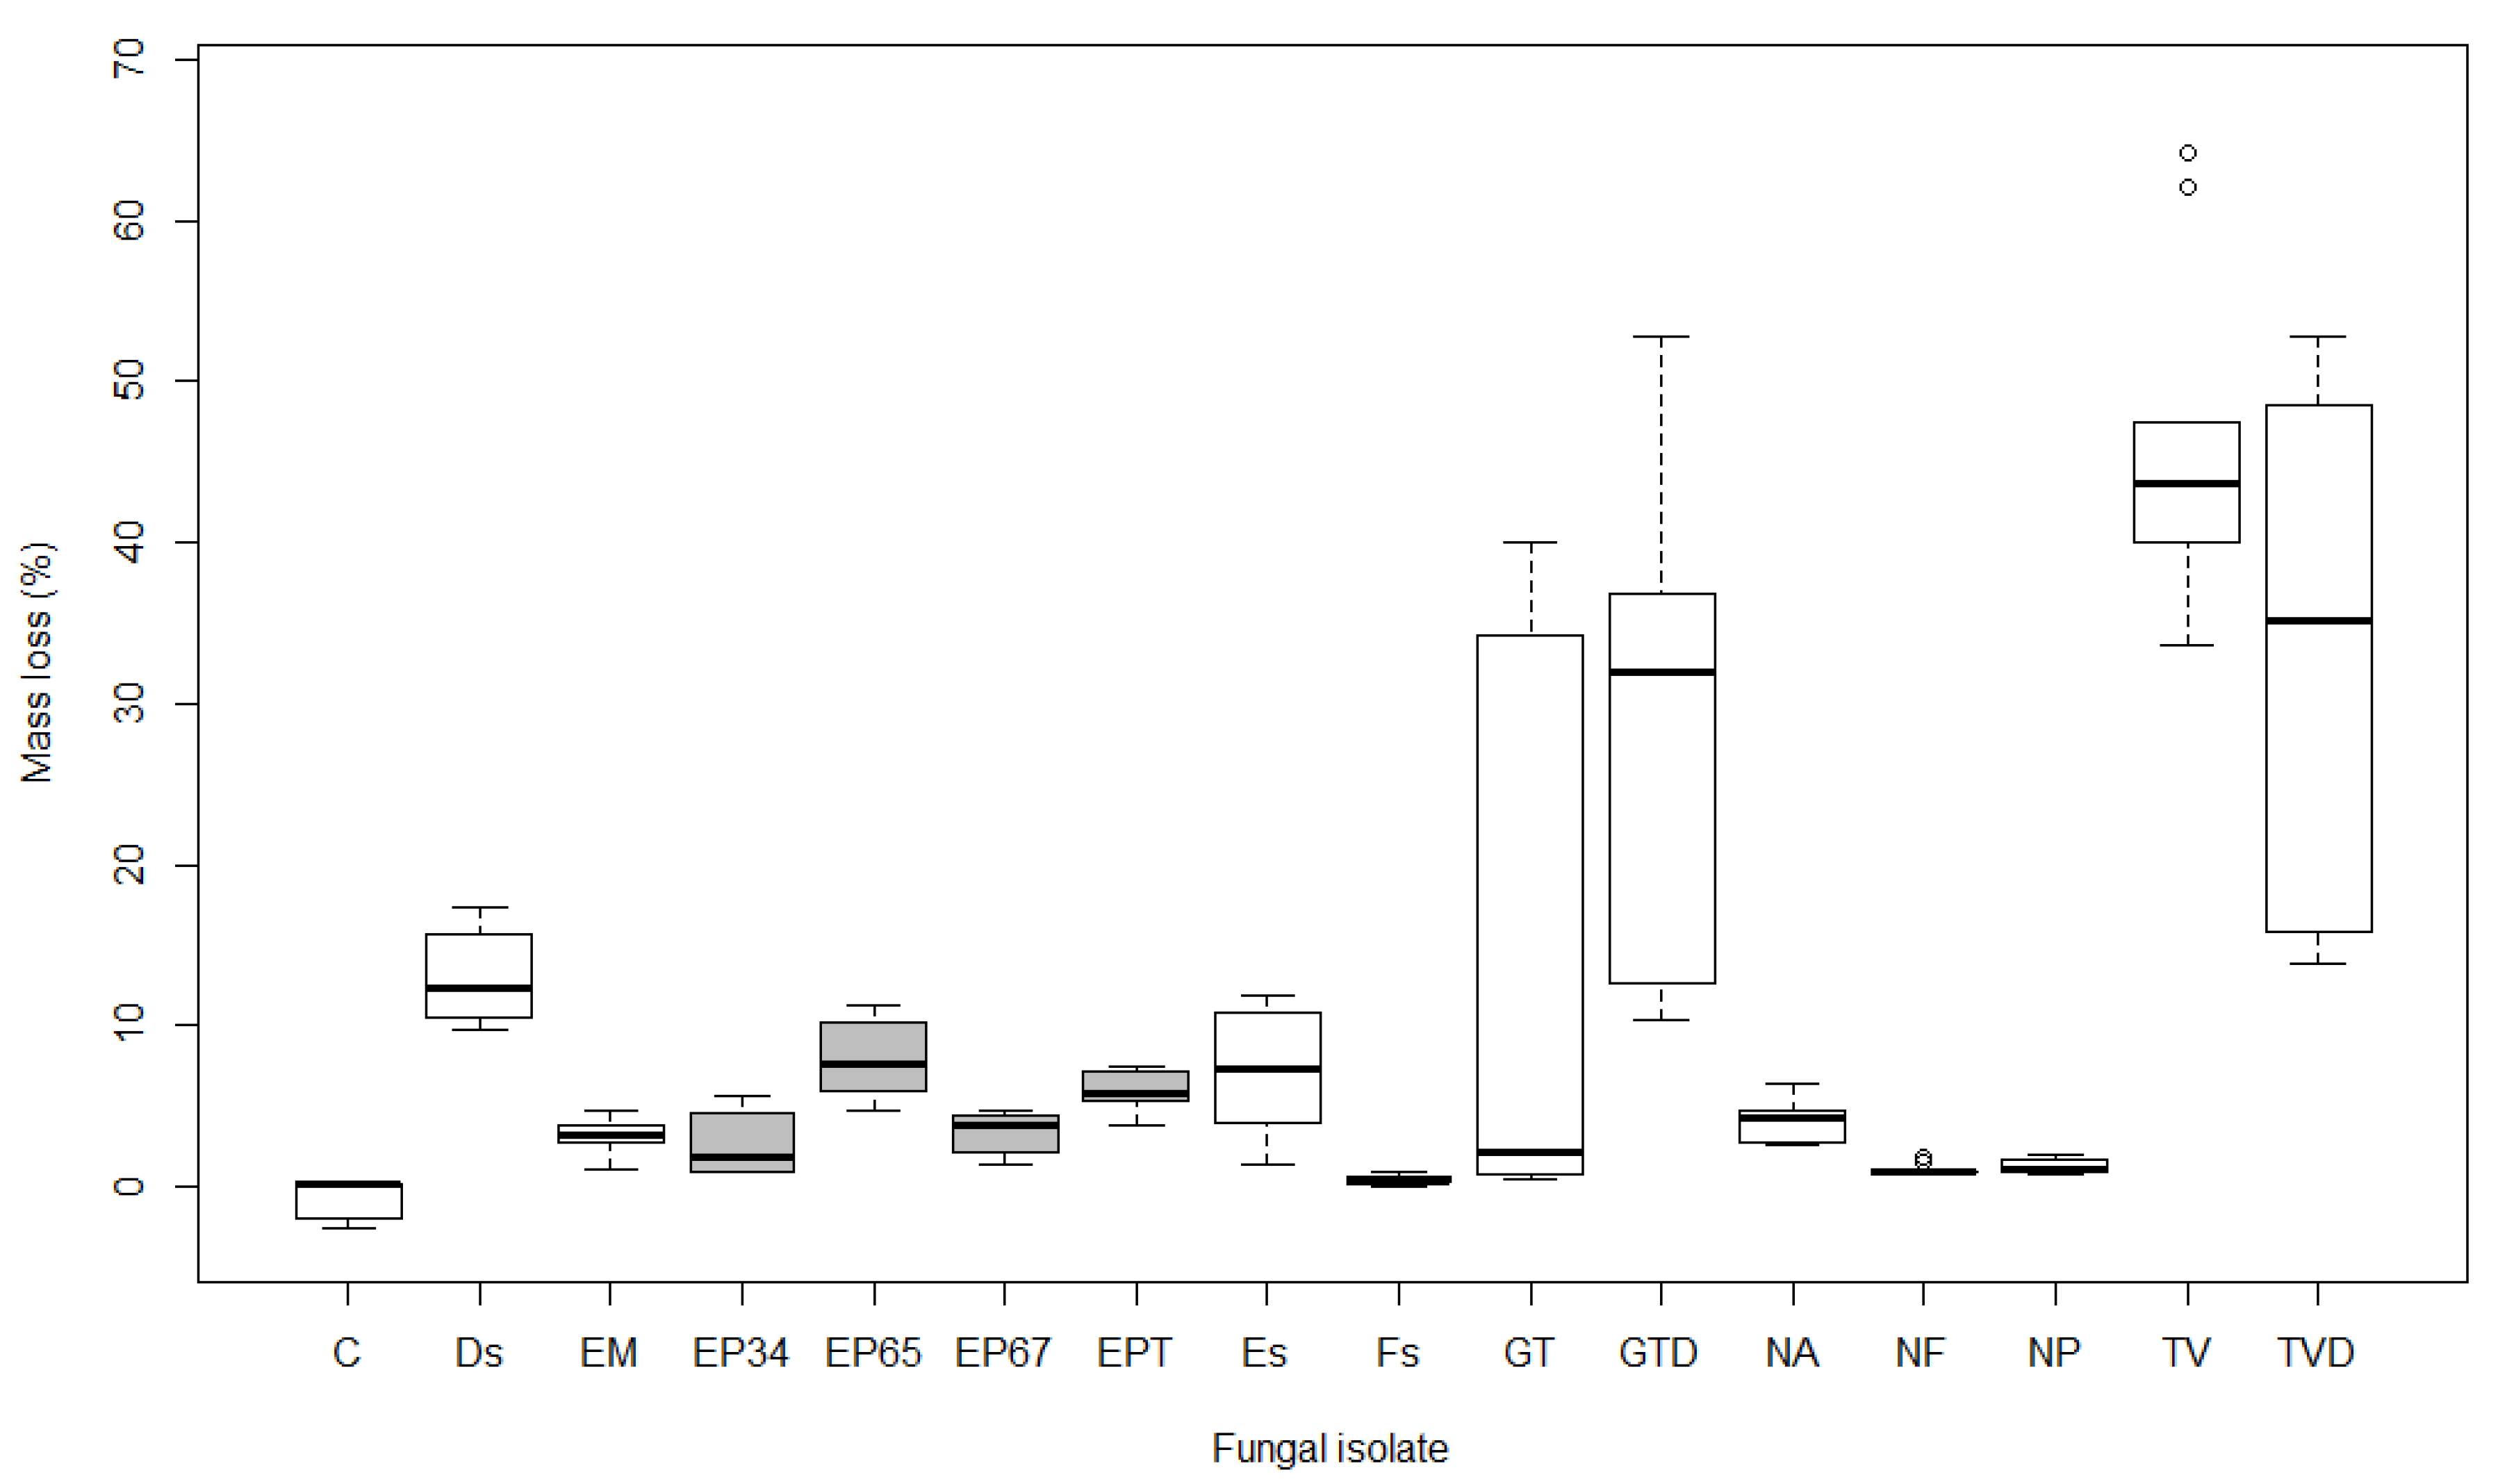
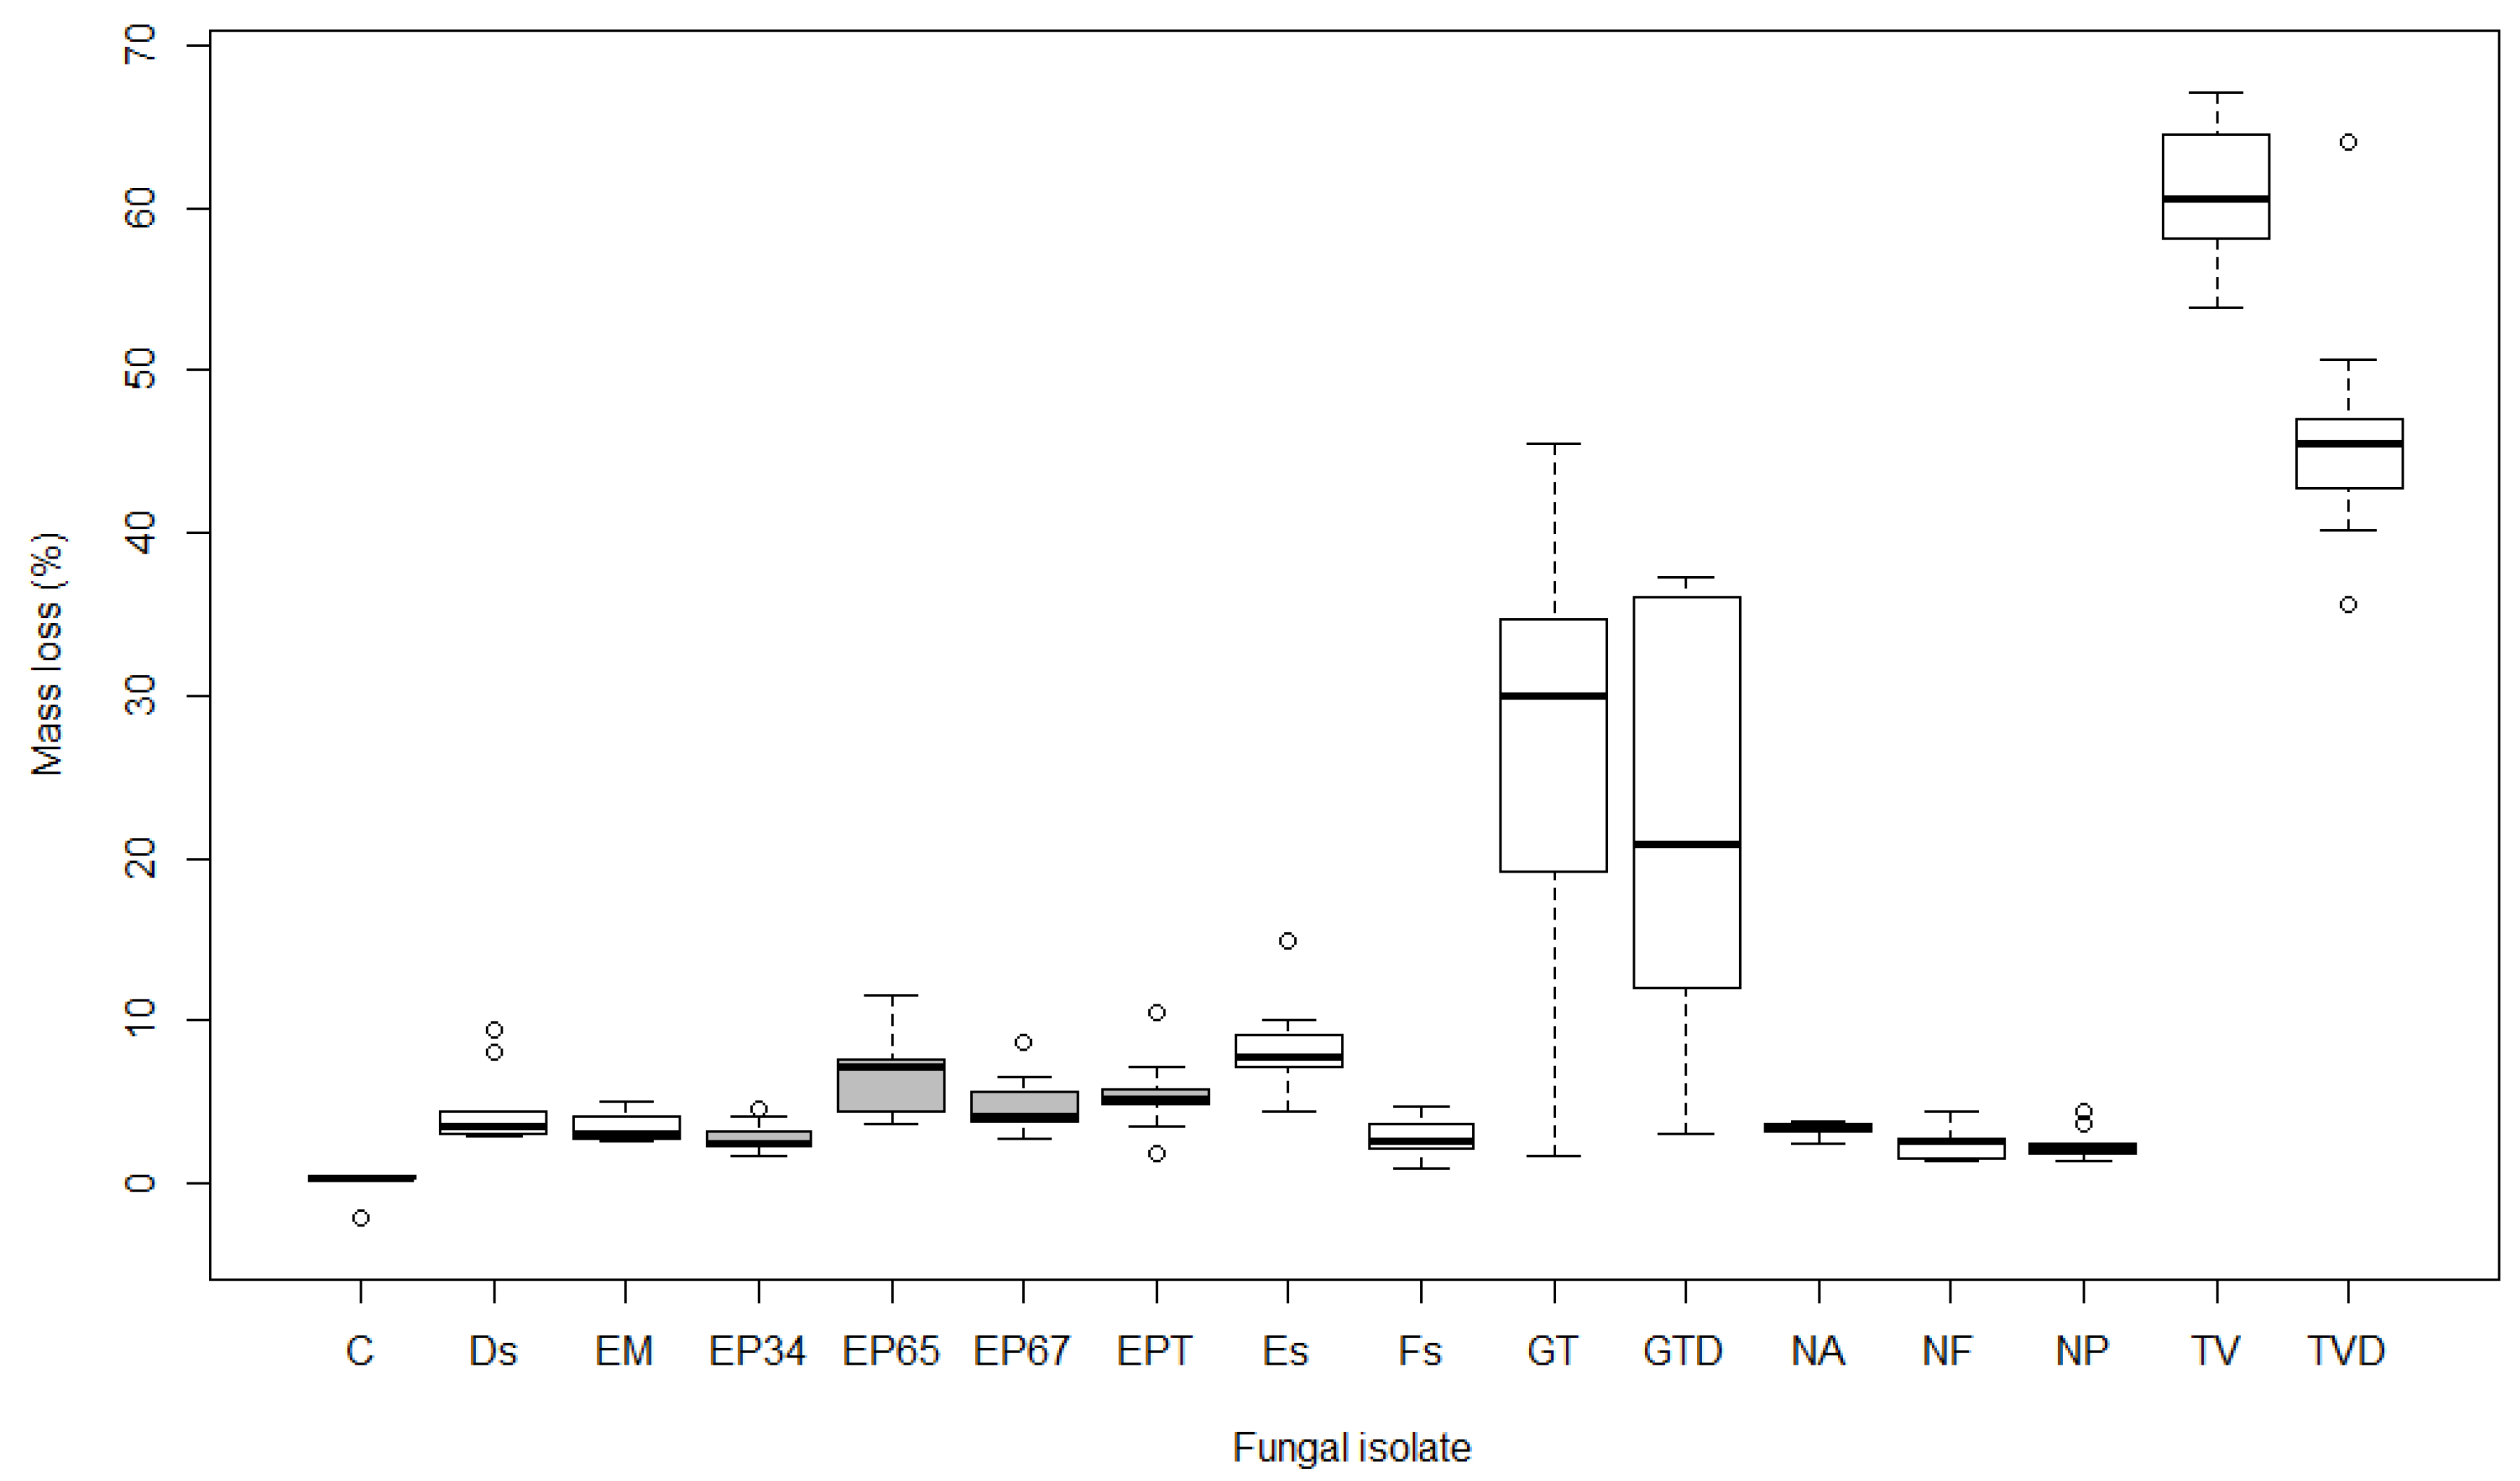
The mass loss of wood after 15 weeks averaged 10.0% in A. pseudoplatanus, 10.7% in A. platanoides, and 12.6% in A. campestre samples. The results of the non-parametric statistical test (Kruskal-Wallis) revealed significant differences (p < 0.001) in the average mass loss of samples between different isolates in all three maple species. Pairwise comparisons of mass loss in A. pseudoplatanus revealed statistically significant differences (p < 0.01) between the control and Ds, EP65, EP67, EPT, GTD, TV, and TVD. Samples of A. platanoides showed similar results, with the exception of EP67, which was not significantly different from the control, and Es, which was significant (p < 0.01). Mass loss of control A. campestre samples was significantly different (p < 0.05) from Es, EP65, EP67, EPT, GT, GTD, TV, and TVD, but not from Ds, EM, EP34, Fs, NA, NF, and NP (p > 0.05).
Both isolates of T. versicolor (TV and TVD) were the most effective, causing mass loss ranging from 33.1% in A. pseudoplatanus to 60.8% in A. campestre after 15 weeks of exposure. Similarly, isolates of G. trabeum (GT and GTD) caused average mass loss of 12.1% in A. pseudoplatanus (Figure 1), 20.6% in A. platanoides (Figure 2), and 24.3% in A. campestre (Figure 3). The other isolates were less effective, causing mass loss ranging from 1.3 to 11.2% in A. pseudoplatanus (Figure 1), 0.4 to 13.1% in A. platanoides (Figure 2), and 2.1 to 8.3% in A. campestre (Figure 3). The lowest mass loss in A. pseudoplatanus samples was obtained for EM, in A. platanoides for Fs and in A. campestre for NP. The most effective fungi among the five most frequently isolated species from the wood of the dead branches of A. pseudoplatanus were Ds in the case of A. pseudoplatanus and A. platanoides samples, and Es in the case of A. campestre.
Differences between average initial and final dry mass were significant for all isolates (p < 0.05), except for the controls in all three maple species and GT isolate in A. pseudoplatanus.
Pairwise comparisons between different isolates of E. parasitica revealed significant differences in average mass loss between EP34 and EP65 (p < 0.001), and between EP34 and EPT (p < 0.05), in all three tested maple species. Additionally, there were statistically significant differences between EP65 and EP67 in A. pseudoplatanus and A. platanoides (p < 0.05), and between EP67 and EPT in A. platanoides (p < 0.05). EP65 was the most effective in causing mass loss, followed by EPT, EP67, and EP34. This was the case in all three Acer species. The highest mass loss was determined for A. pseudoplatanus wood samples exposed to E. parasitica isolates (average 6.6%). In A. platanoides and A. campestre, E. parasitica isolates were less effective, causing an average mass loss of 4.9%. There were significant differences in average mass loss caused by E. parasitica isolates EP65 and EP67 between A. pseudoplatanus and A. platanoides (p < 0.05), and in the average mass loss of A. pseudoplatanus and A. campestre samples exposed to EP65 (p < 0.01).
3.2. Moisture Content
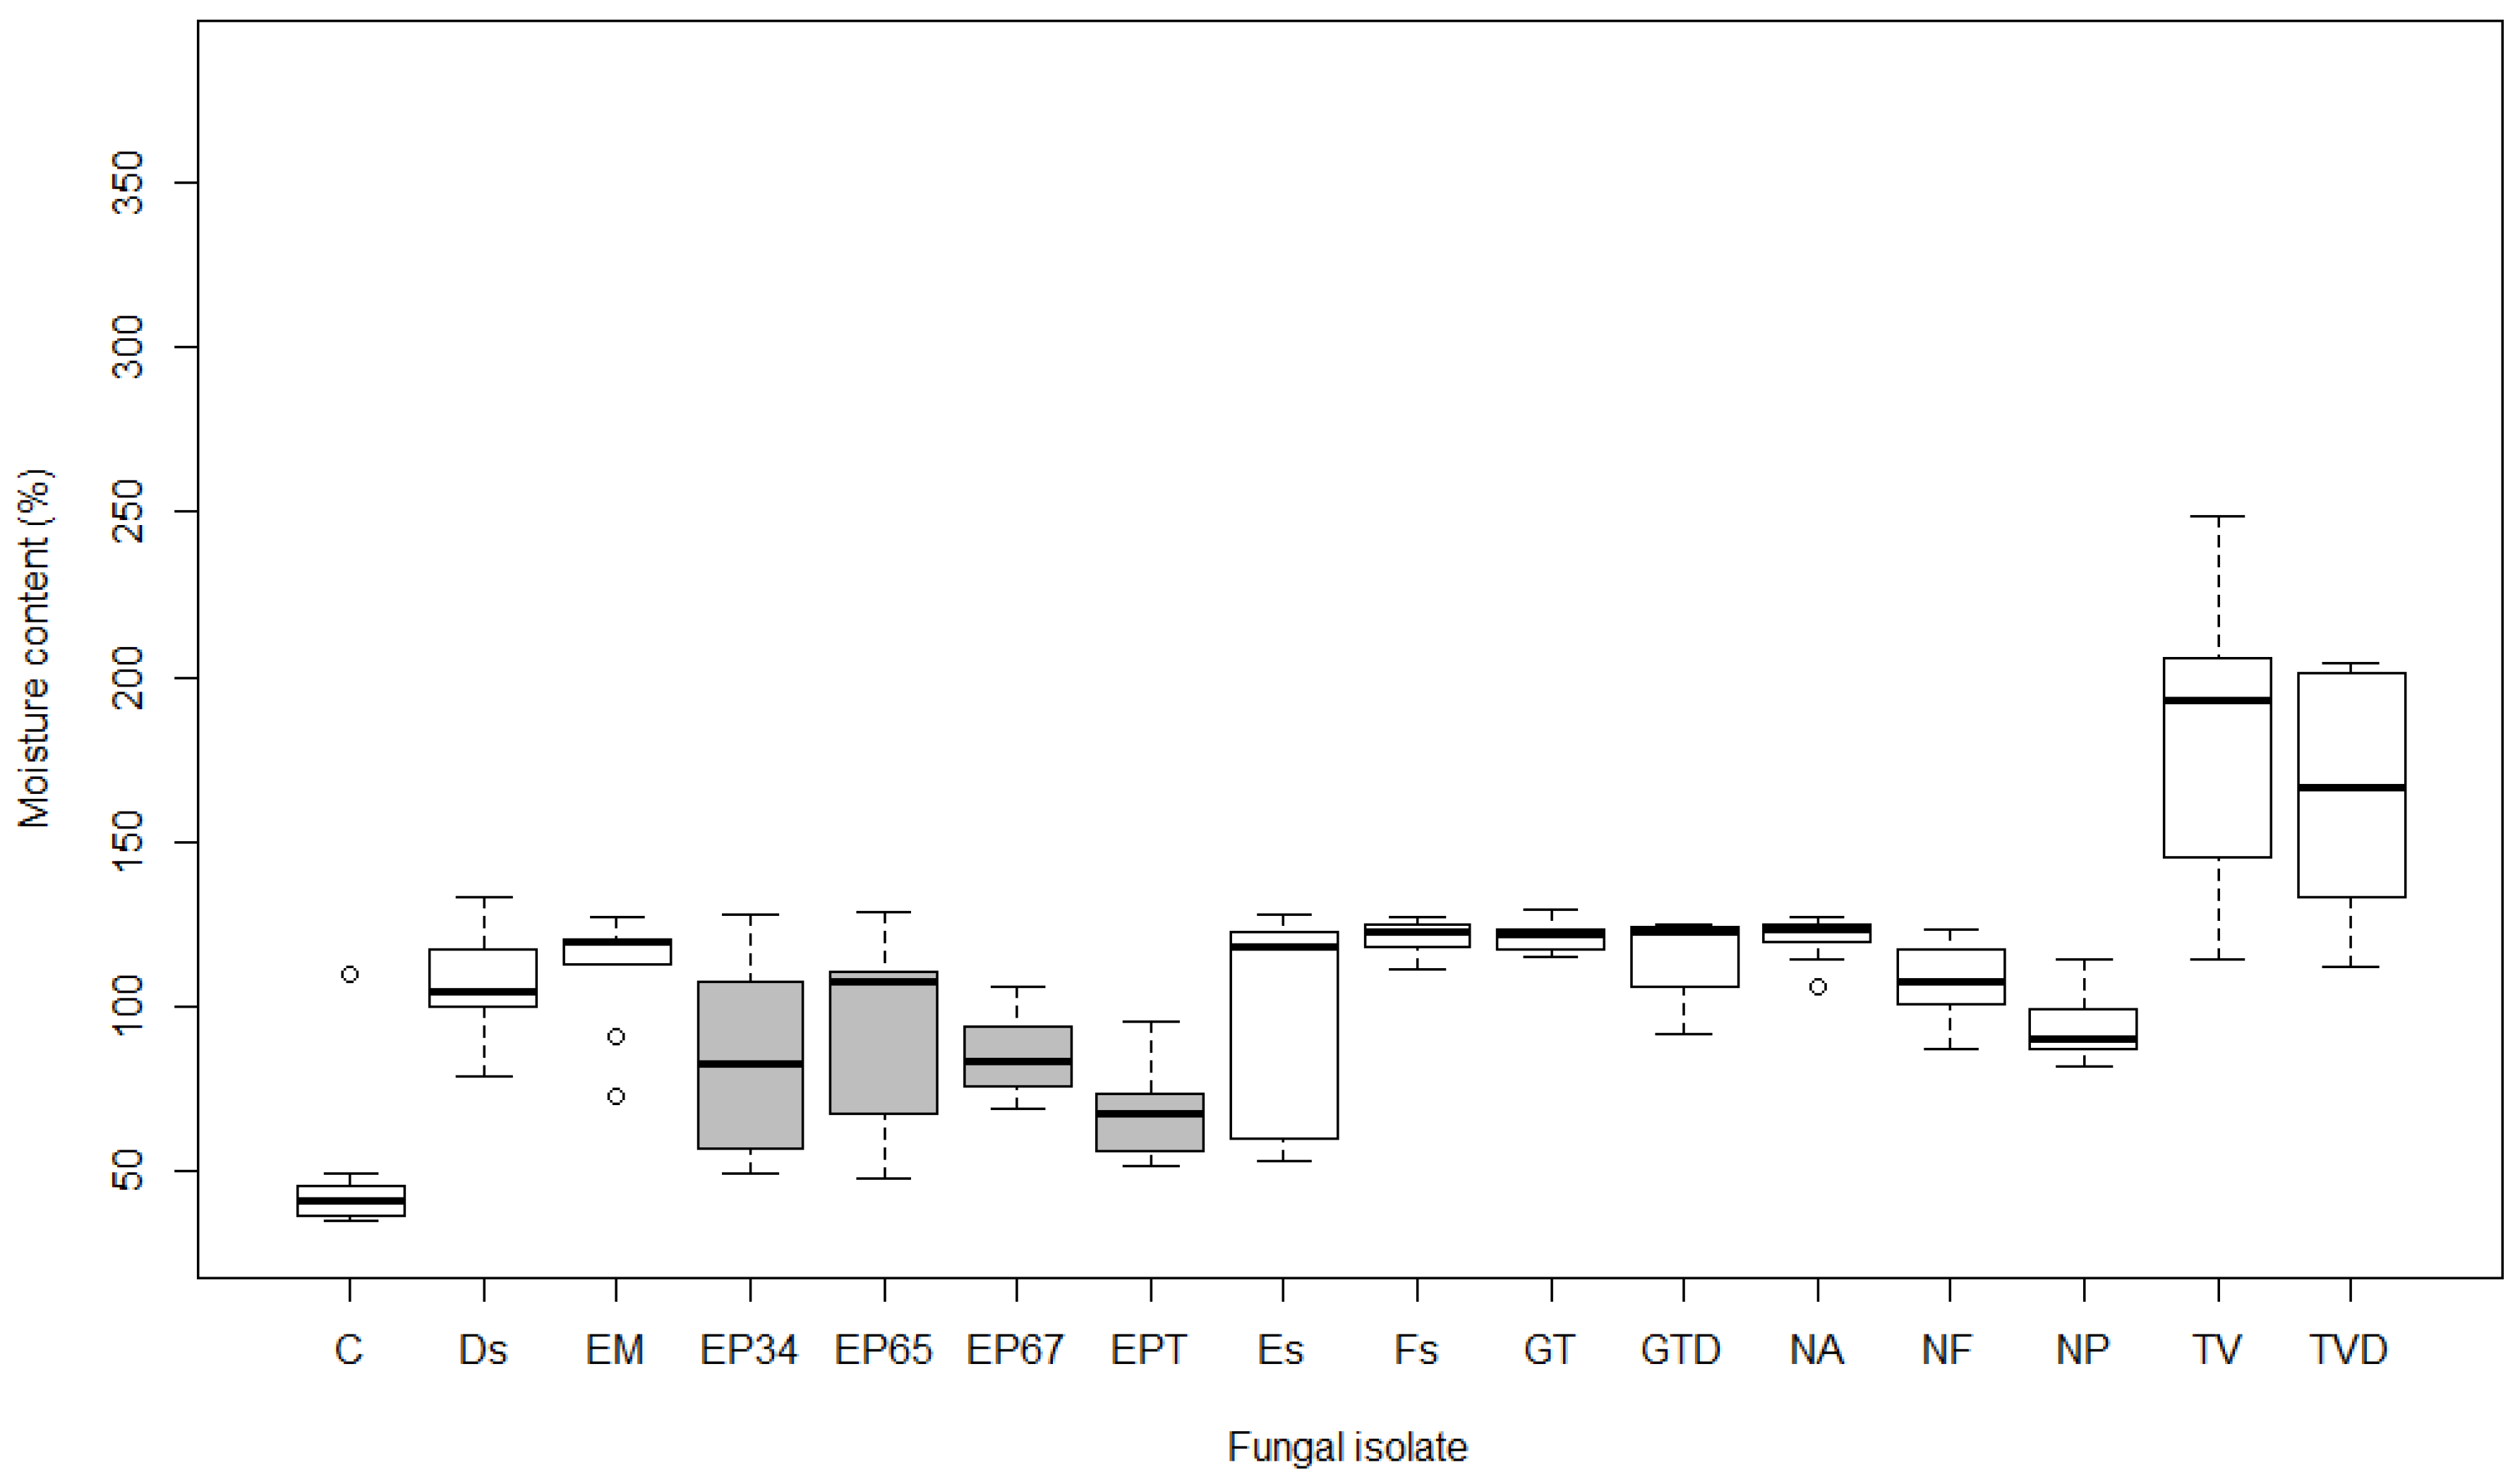
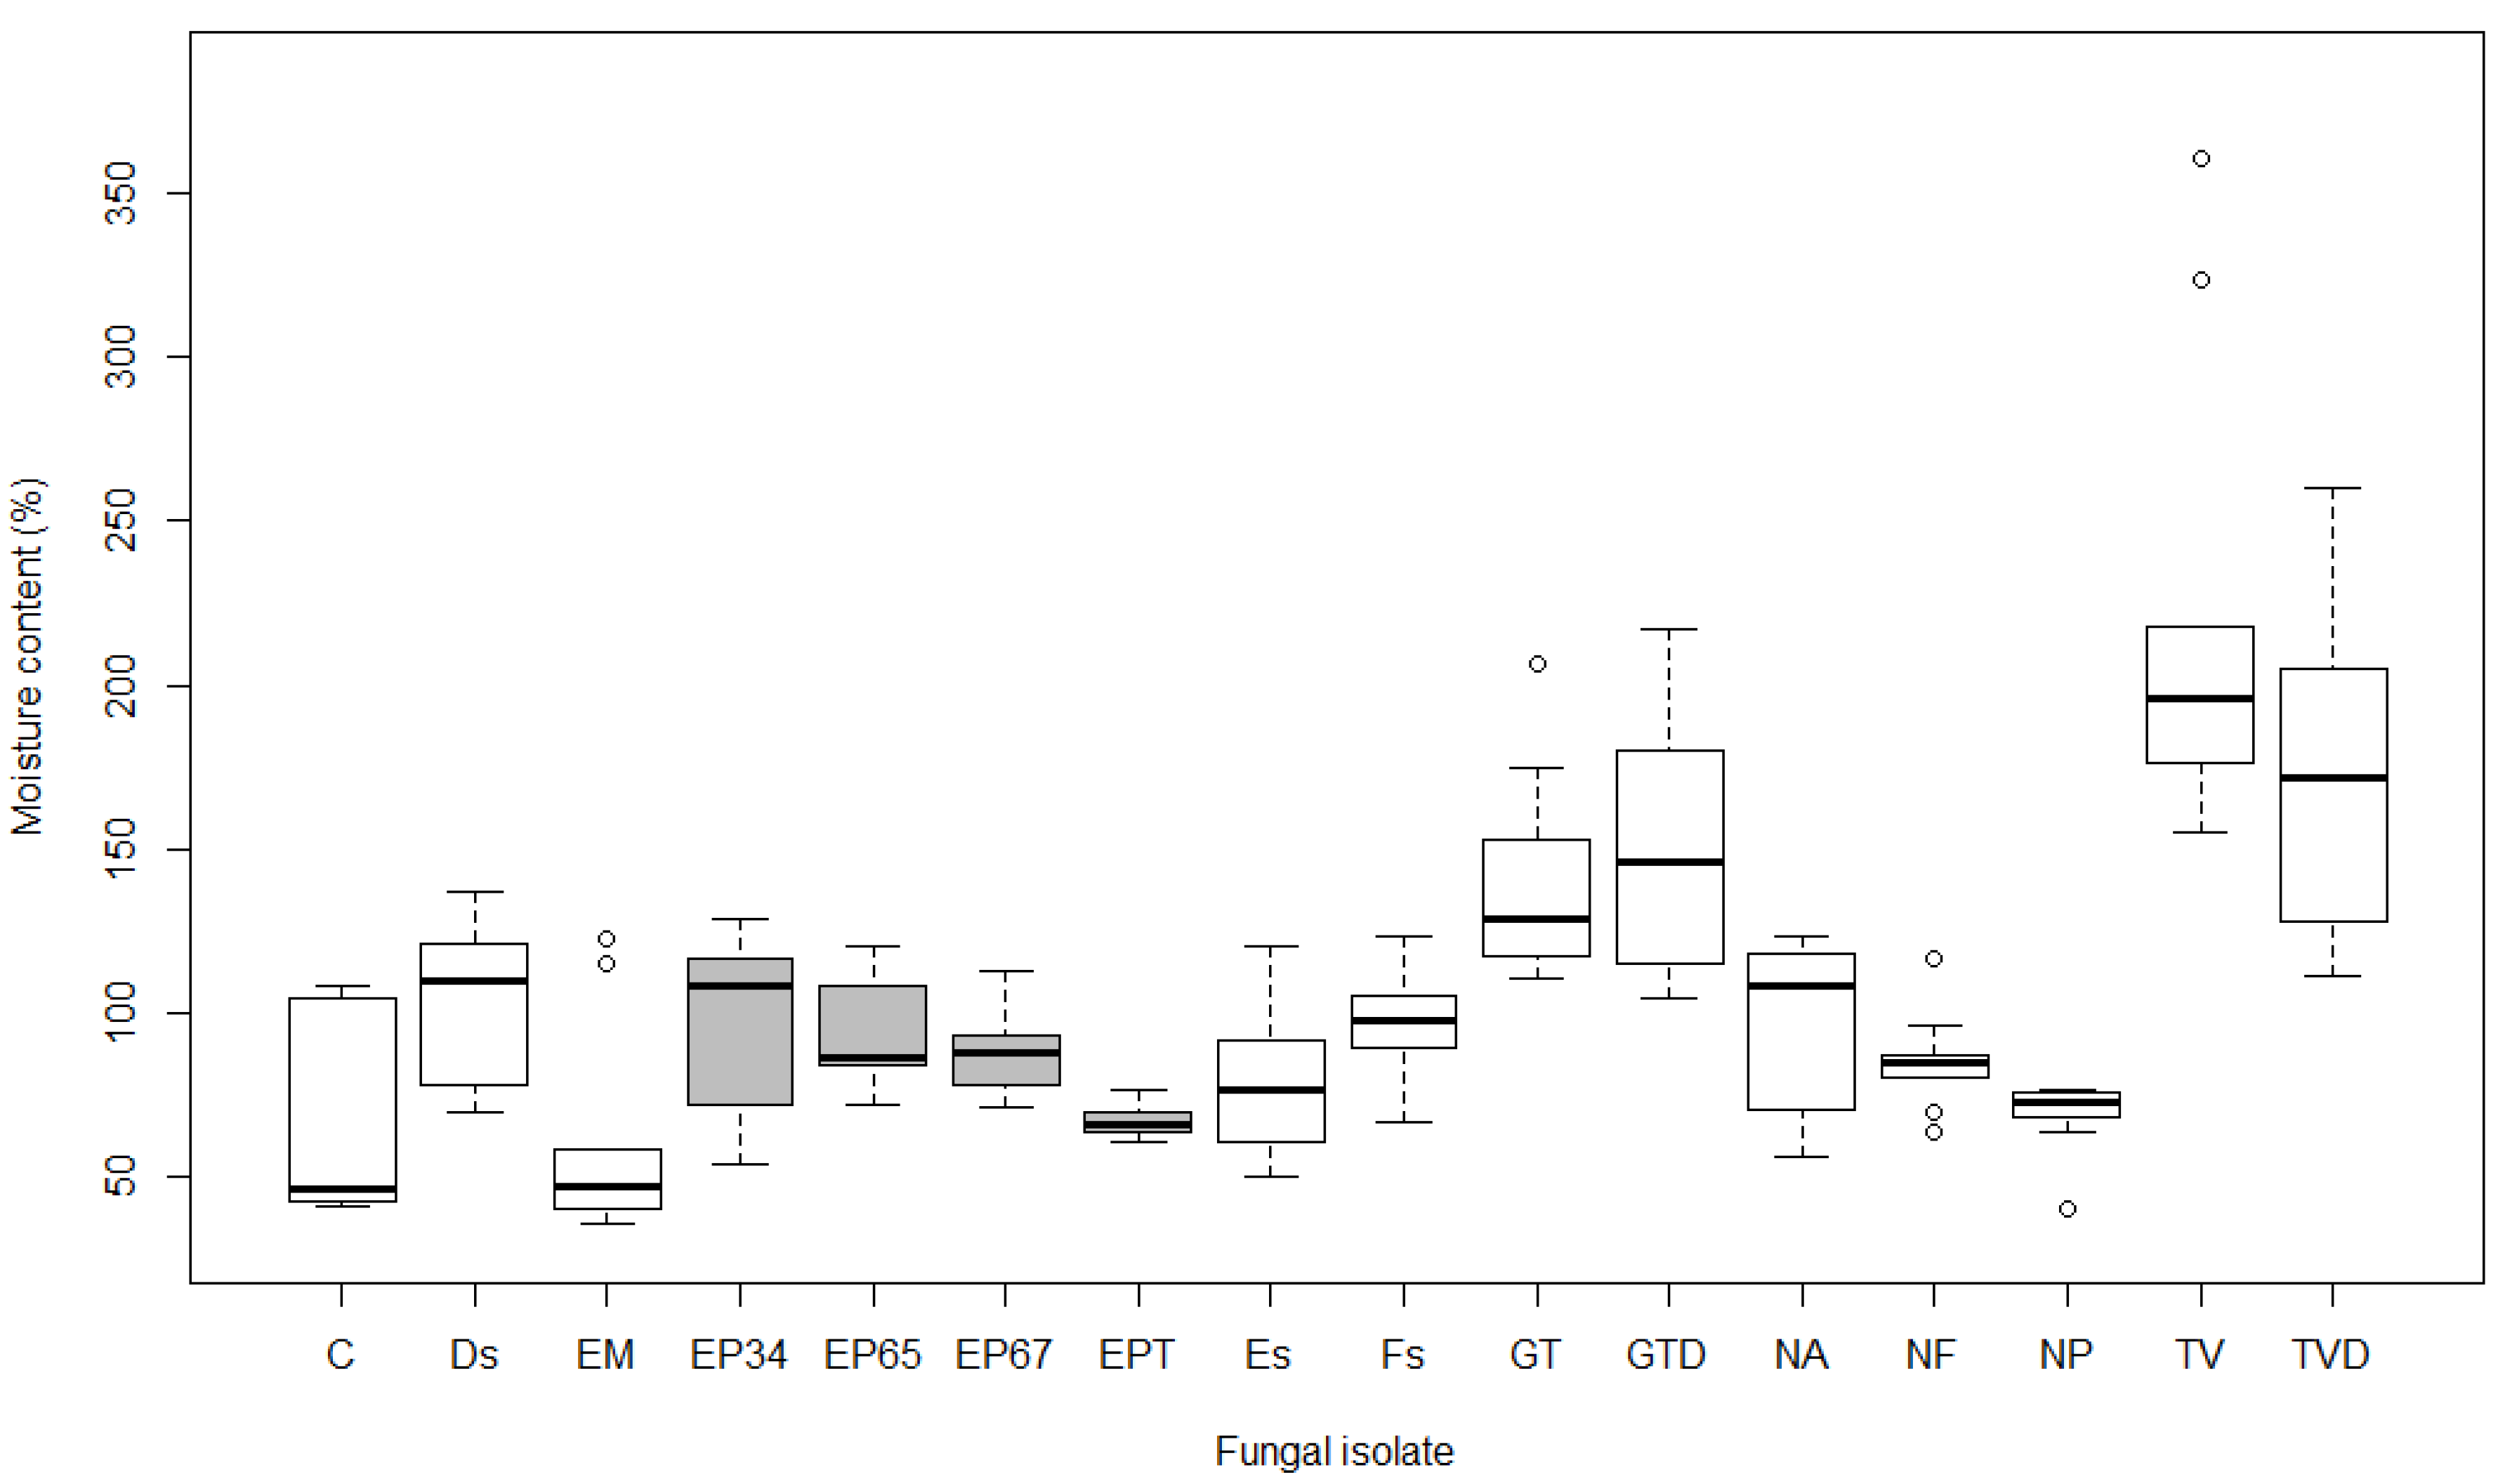
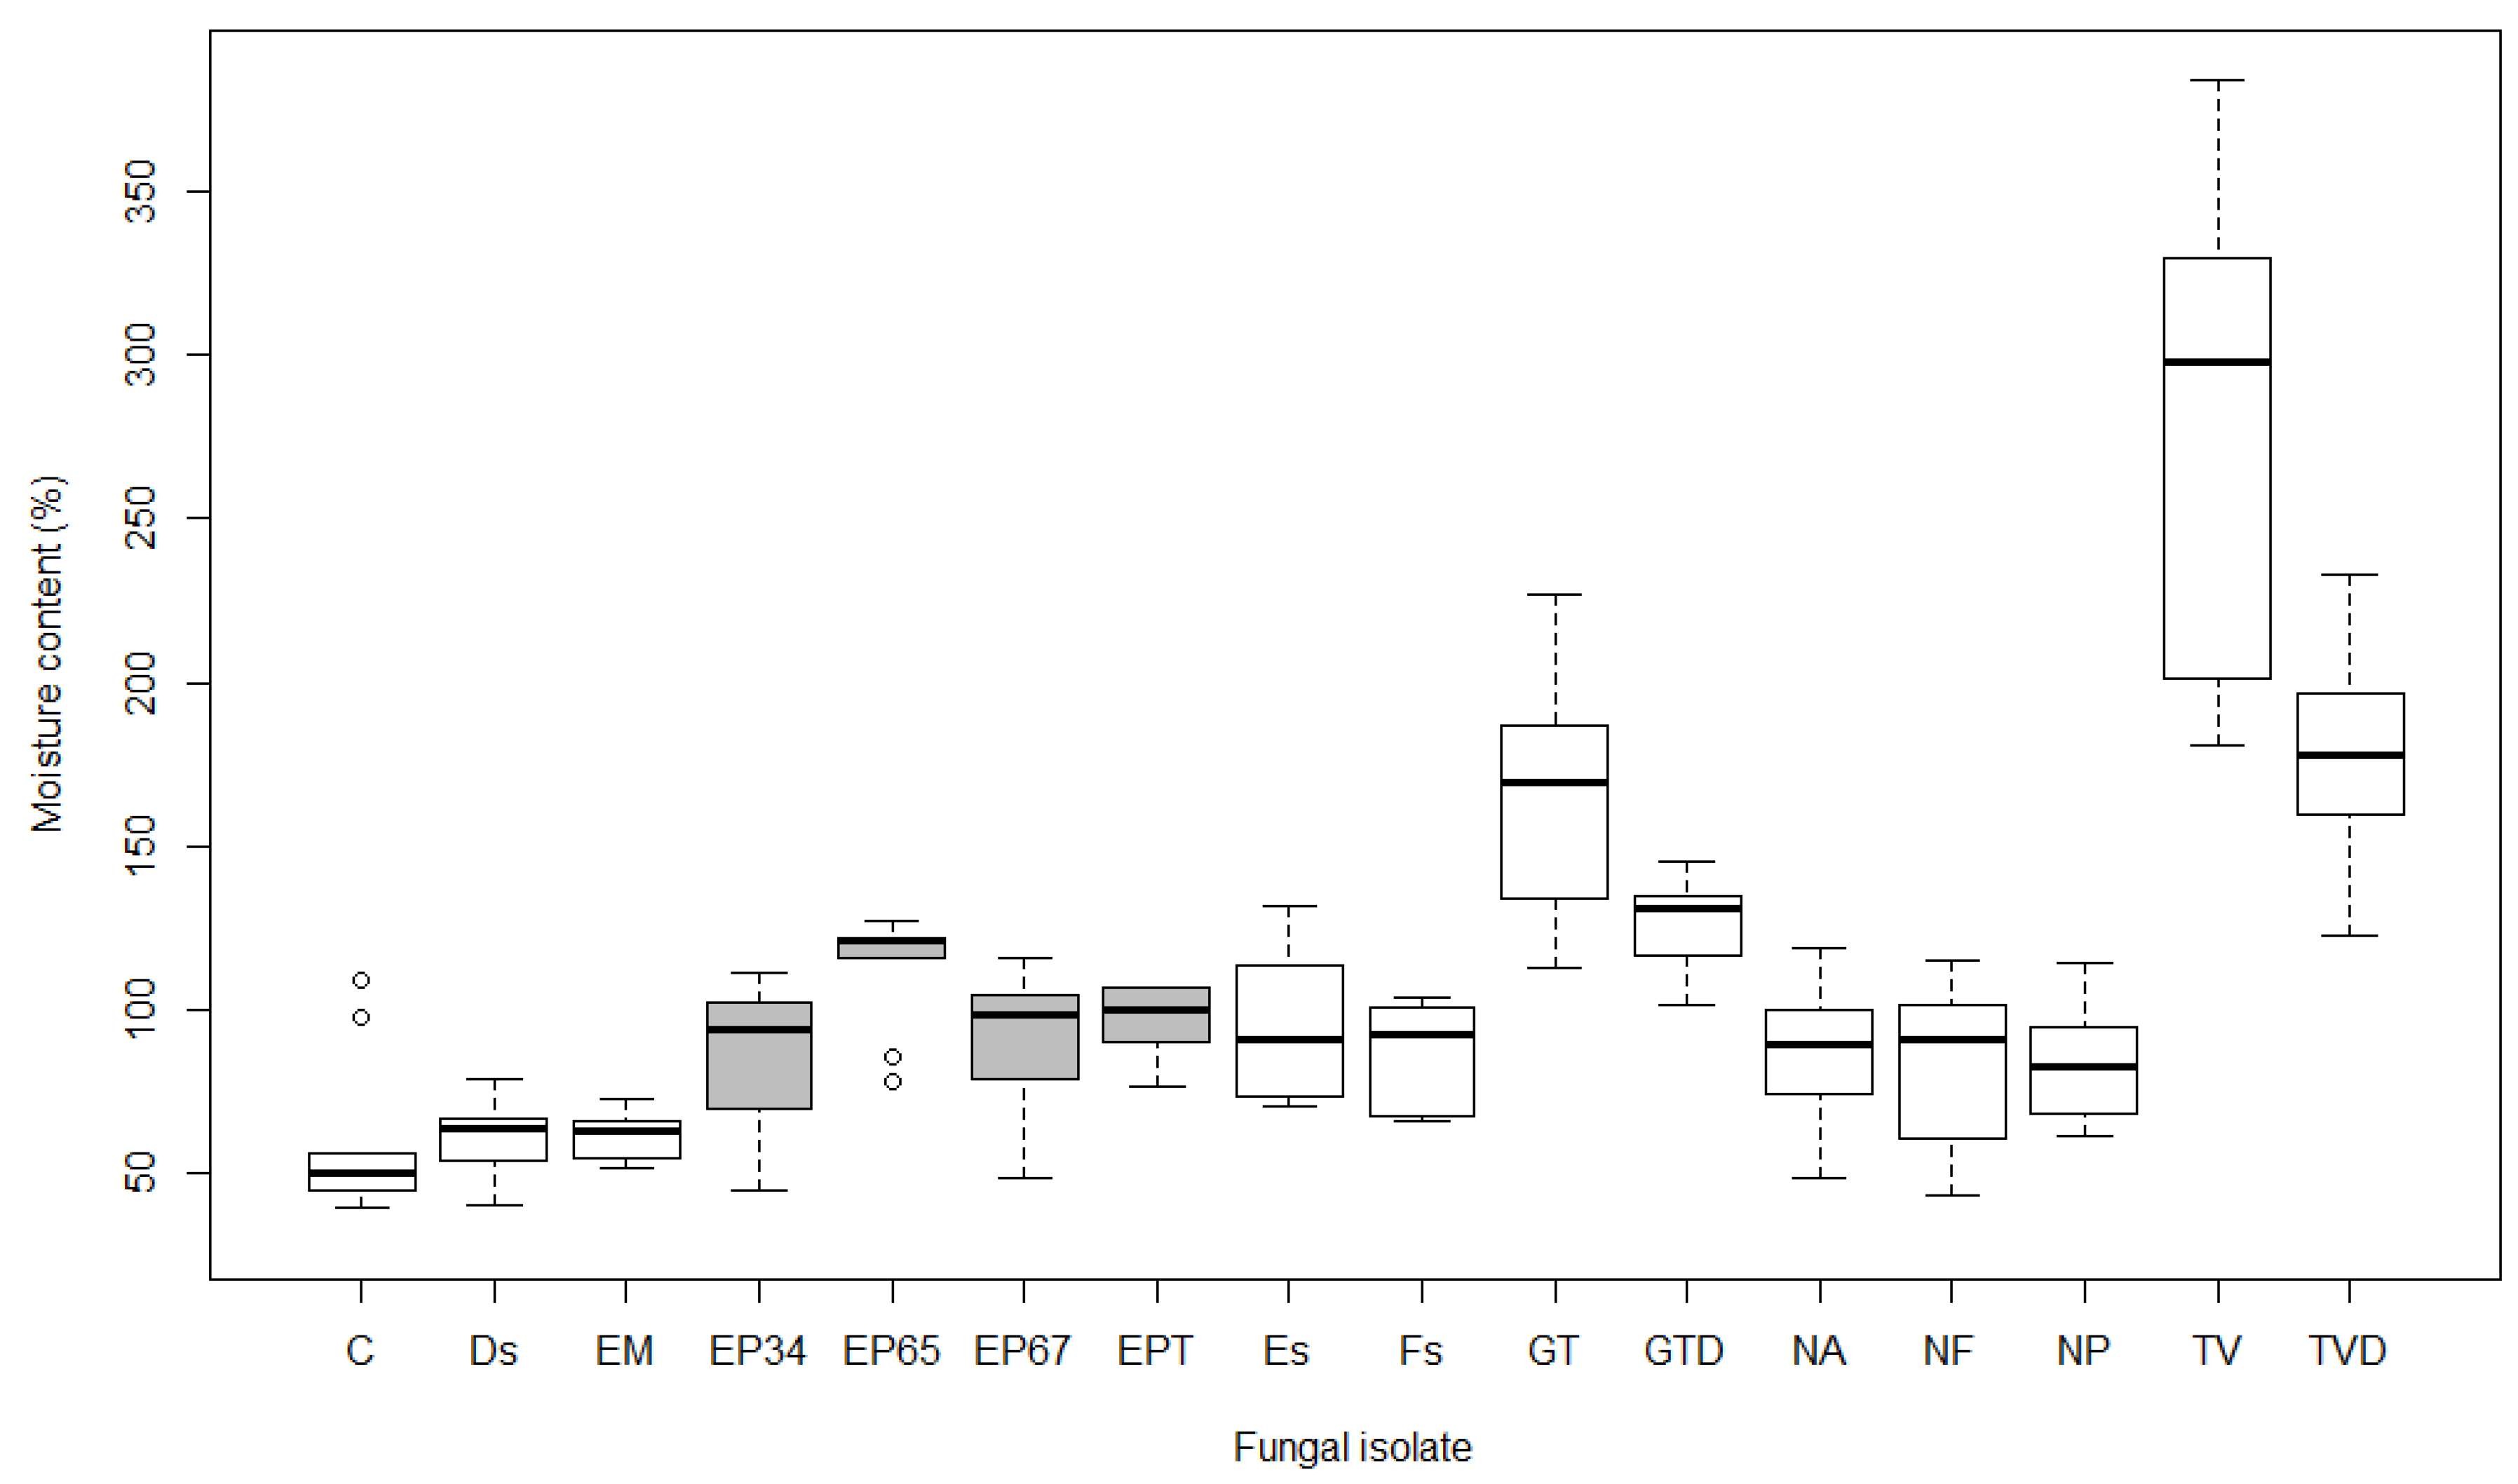
The average moisture content of samples exposed to fungi was 111.8% in A. pseudoplatanus, 107.7% in A. platanoides and 113.3% in A. campestre. Control samples had significantly lower values (57.2% on average) (p < 0.05). There were significant differences (p < 0.01) in the average moisture content of the control samples in comparison to samples exposed to GT, GTD, TV, and TVD in all tested maple species. Differences from control were also significant for EM, Fs, and NA in A. pseudoplatanus, and for EP65 in A. campestre (p < 0.05). In contrast, the average moisture content of samples exposed to Ds, Es, EP34, EP67, EPT, NF, and NP was not significantly different from control samples in all three maples (p > 0.05). In addition to these fungal isolates, the moisture content of samples exposed to EM, Fs, and NA in A. platanoides and A. campestre, and EP65 in A. pseudoplatanus and A. platanoides, were also not significant.
The average moisture content of samples exposed to E. parasitica isolates was the lowest in A. pseudoplatanus at 83.1% (Figure 4), followed by A. platanoides at 86.5% (Figure 5) and A. campestre at 97.1% (Figure 6). No statistical differences were found between the average moisture content of A. pseudoplatanus samples exposed to different E. parasitica isolates. Samples of A. platanoides exposed to EPT showed statistically significant differences in average moisture content in comparison with EP34 (p < 0.01), EP65, and EP67 (p < 0.05). In A. campestre, we found only one significant pairwise comparison, i.e., between EP34 and EP65 (p < 0.05). No statistically significant differences were found between the average moisture content of A. pseudoplatanus and A. platanoides samples exposed to different E. parasitica isolates (p > 0.05), but there was a statistically significant difference (p < 0.05) in average moisture content between A. pseudoplatanus and A. campestre exposed to EPT, and between A. platanoides and A. campestre exposed to EP65 and EPT.
The change in average moisture content (ΔMC) between samples exposed to fungal activity and control samples was positive for all fungal isolates and all maple species, except for A. platanoides exposed to EM, which showed a negative value (Table 2).
We found a highly significant (p < 0.001) positive correlation between mass loss and moisture content in all three maple species (A. pseudoplatanus r = 0.66, A. platanoides r = 0.84, and A. campestre r = 0.87).
3.3. Wood Density
An average wood density of 616 kg/m3 was calculated for the Acer spp. samples in our study. A significant difference was found with the Kruskal-Wallis test (p = 0.012) for the average wood density of the three maple species in the experiment. Only the wood density of A. campestre was significantly higher than that of A. platanoides. Other pairwise comparisons were not significant (Table 3). References on Acer spp. wood density usually report an average of 640 kg/m3 for A. pseudoplatanus and 590 kg/m3 for A. platanoides and A. campestre [30]. Furthermore, we did not find a statistically significant correlation (p > 0.05) between the moisture content and wood density of samples in any of the maple species.
3.4. Light and Scanning Electron Microscopy
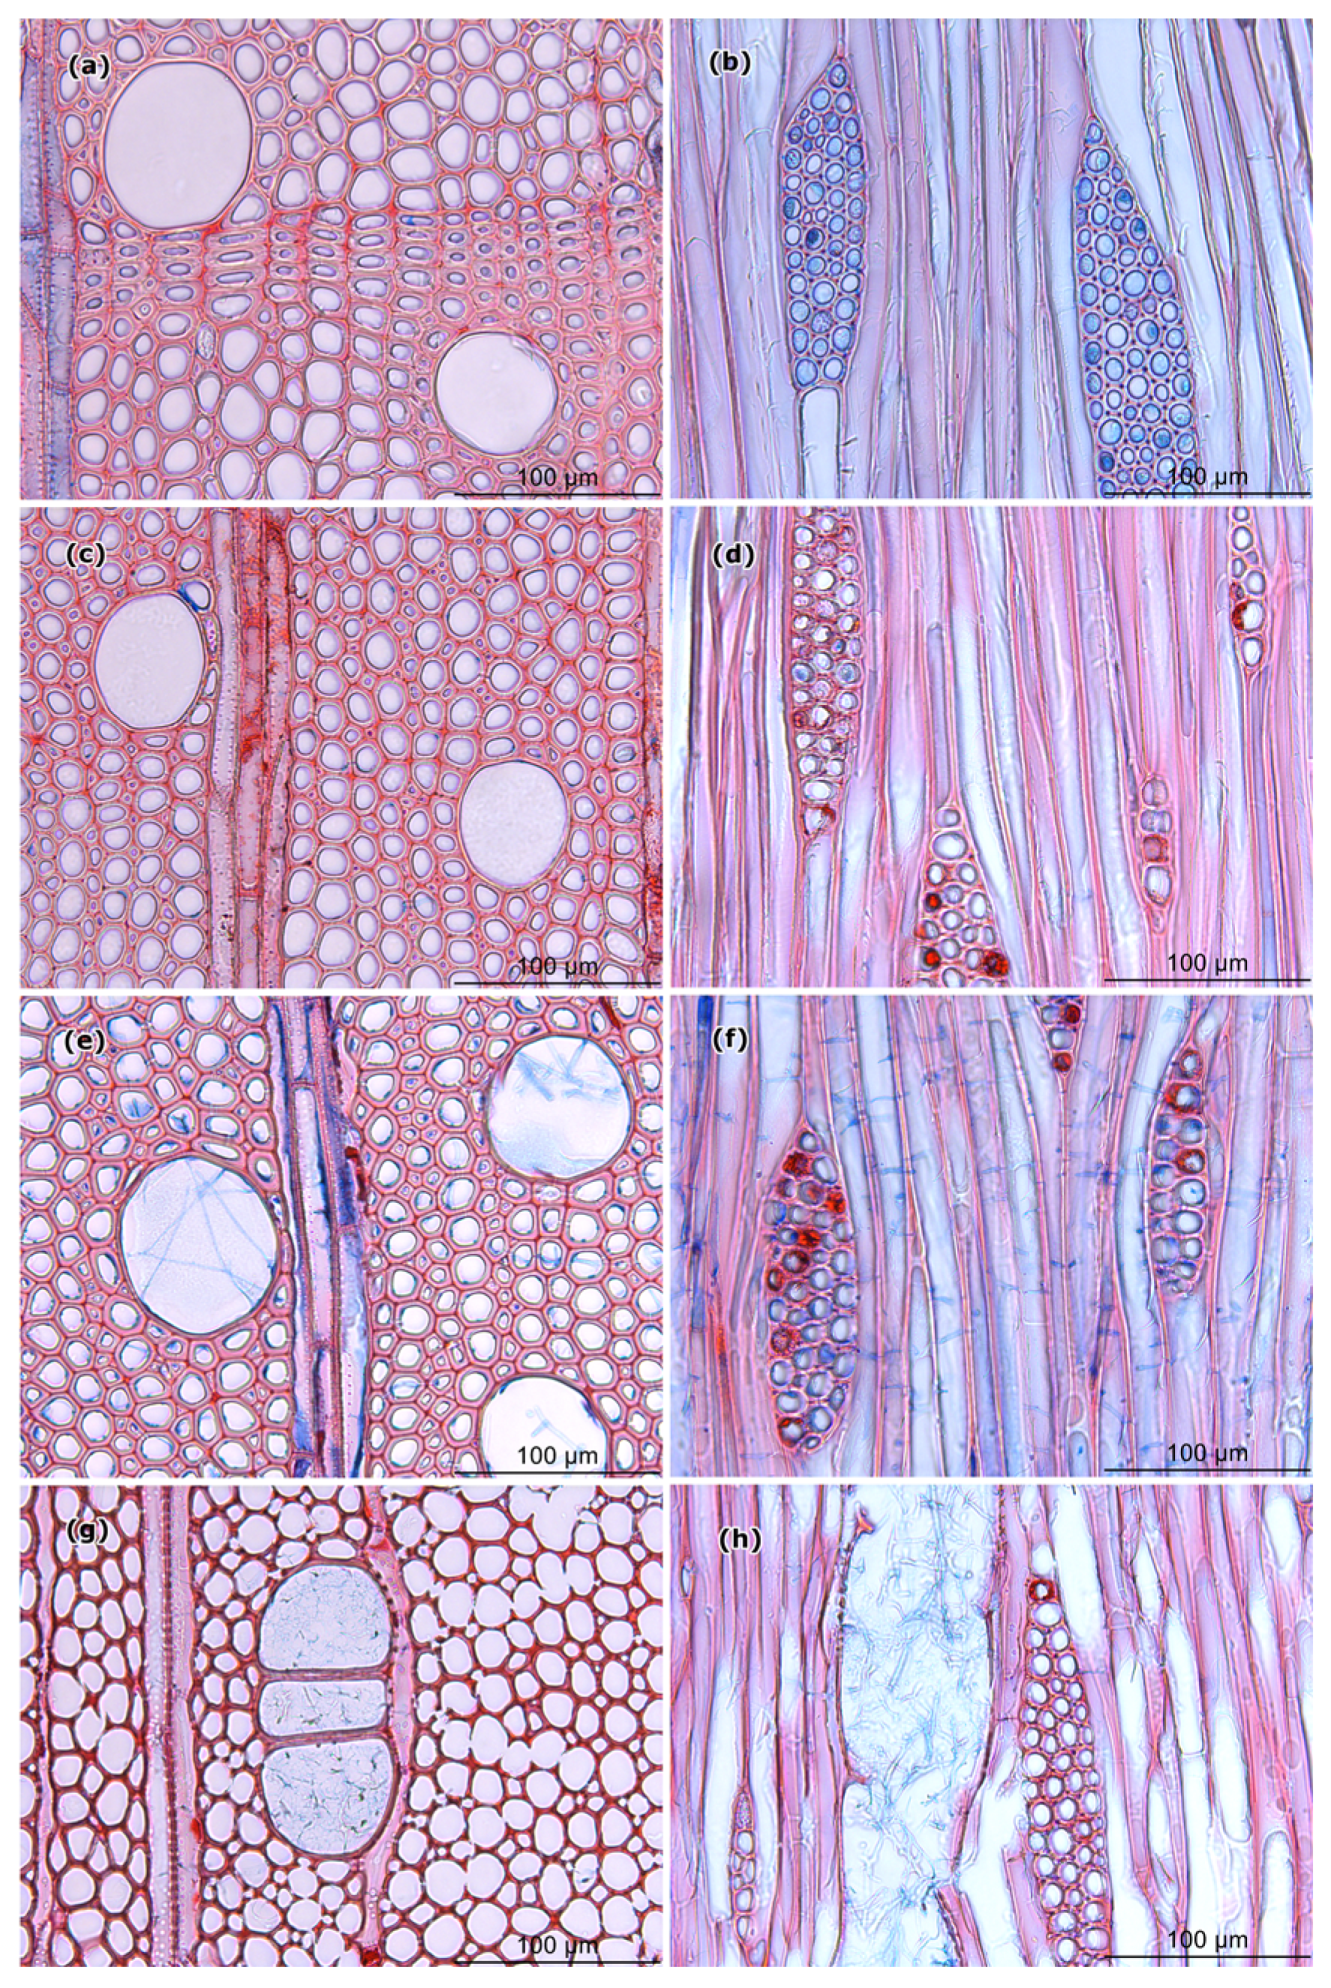
Light microscopy (LM) of the wood samples of A. pseudoplatanus exposed to EP34, EP65, and TV confirmed the obvious colonization and also occasional degradation of woody tissues. Vessels in wood samples exposed to EP65 and TV were completely colonized (Figure 7e,f,g,h), while, in samples exposed to EP34, the presence of fungal hyphae was not so abundant and, in most cases, limited to the edge of the sample (Figure 7c,d). Samples exposed to EP65 showed some parts with fiber wall thinning and abundant hyphae in the vessels (Figure 7e,f). In contrast, almost no changes in cell wall color, cell wall thickness and evidence of fungal hyphae were observed in samples exposed to EP34 (Figure 7c,d). The LM images confirmed that the wood samples exposed to TV suffered the greatest cell wall degradation in A. pseudoplatanus. Cell wall thinning, sometimes larger parts of destroyed cell walls, and vessel lumens filled with fungal hyphae were observed in those wood samples (Figure 7g,h).
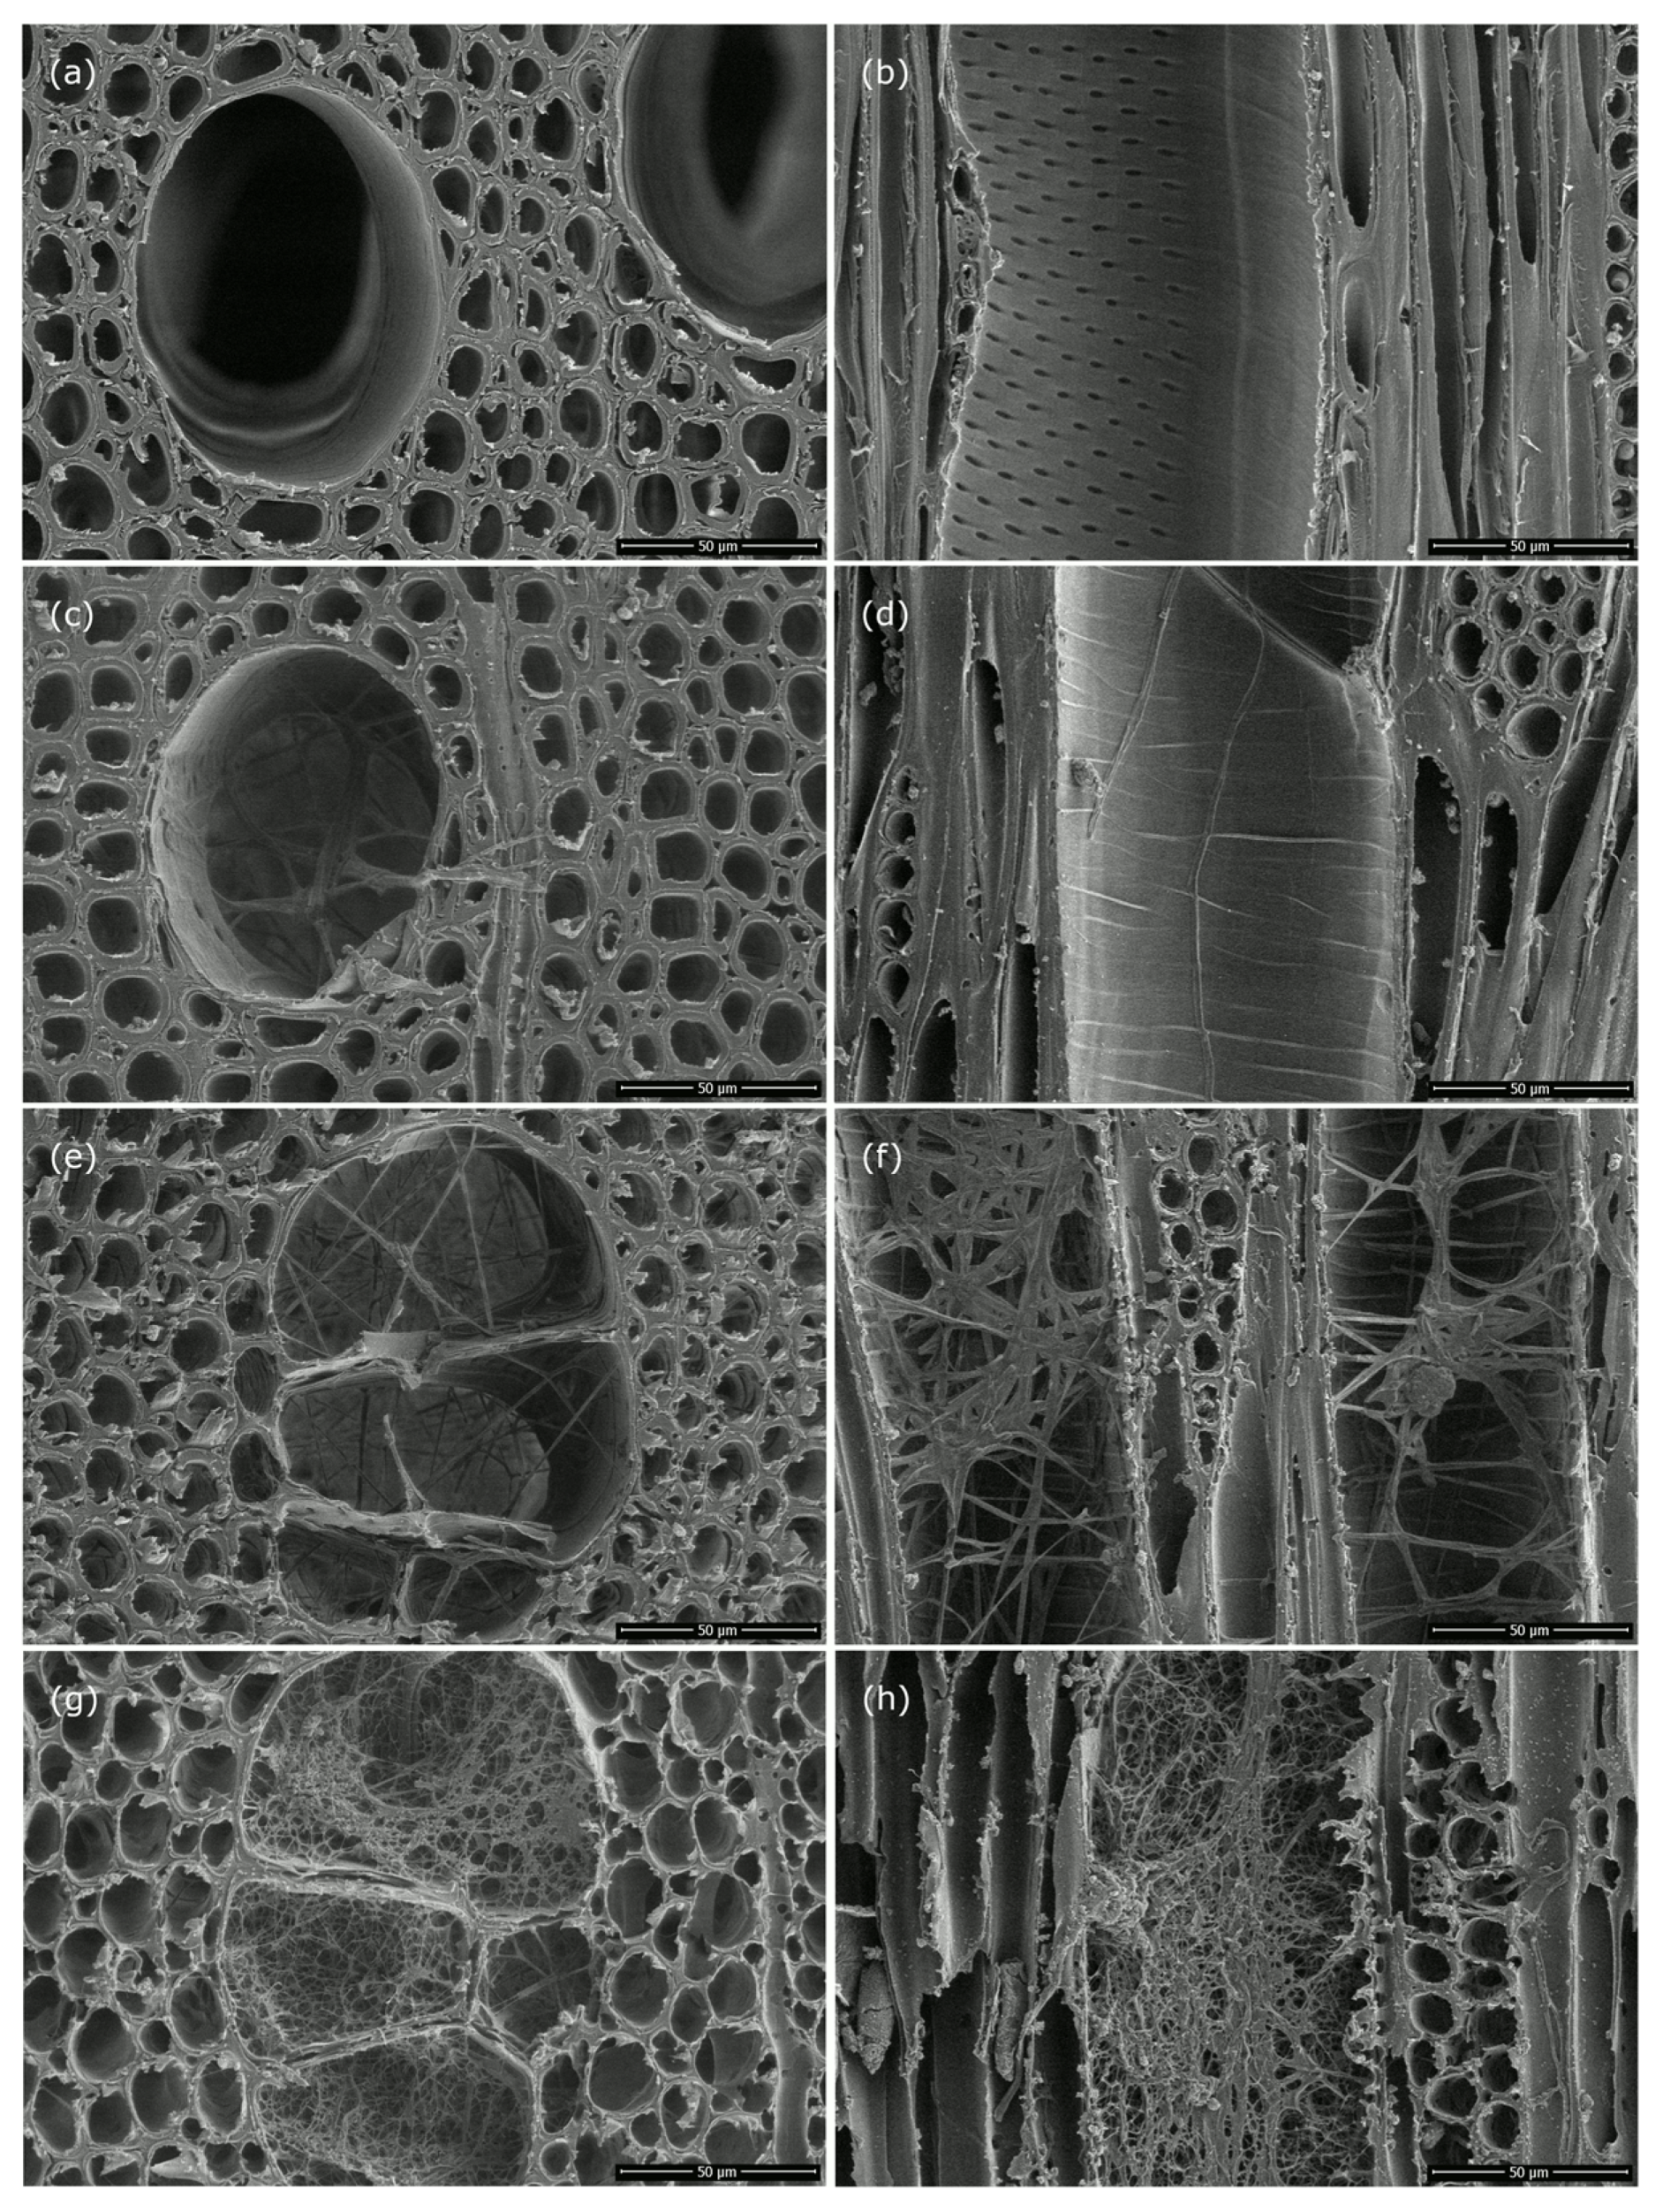
The scanning electron micrographs (Figure 8) confirmed that the 15 weeks of exposure of the wood to fungi caused significant changes to the cell walls. The most severe damage was observed in samples exposed to TV (Figure 8g,h), which also had the highest mass loss. In general, scanning electron microscopy (SEM) revealed thinning and a torn appearance of the fiber wall in degraded cells. The damage was lower in EP65 (Figure 8e,f), and almost no damage was observed in EP34 (Figure 8c,d). Micrographs of EP34 revealed the presence of fungal hyphae, which were hardly observed under LM (Figure 7c,d).
In total, the thickness of 360 fiber walls and 120 vessel walls was measured. Average fiber and vessel wall thickness (Figure 9 and Figure 10) decreased with increasing fungal activity and mass loss. A non-parametric Kruskal-Wallis test and ANOVA revealed statistically significant differences (p < 0.001) in average fiber and vessel wall thickness between samples exposed to different fungal isolates. Significant differences (p < 0.001) were found for average fiber wall thickness in pairs: TV-control, TV-EP34 and TV-EP65. Similarly, average vessel wall thickness differed significantly between samples exposed to TV and the control (p < 0.001), TV and EP34 (p < 0.05), and TV and EP65 (p = 0.05). Pairwise comparison showed significant differences in average fiber wall thickness between TV and all other fungal isolates in all three parts of the wood increment (i.e., late wood, transition wood, and early wood). Average vessel wall thickness among samples exposed to different fungal isolates was significantly different only in transition wood and early wood. In both parts of the wood increment, differences were significant between samples exposed to TV and the control (p < 0.05 in transition and p < 0.01 in early wood). In transition wood, TV and EP34 also differed slightly significantly (p = 0.06). No statistical differences (p > 0.1) were found in average fiber and vessel wall thickness between the control and EP34 and EP65 in all three parts of the wood increment.
Tests for differences in cell wall thickness between different parts of wood in the samples exposed to the same fungal isolate showed no statistical significance in the vessels. This was not the case for fiber wall thickness, which revealed significant differences between late wood and transition wood for TV (p < 0.001) and EP65 (p < 0.01), between late wood and early wood for TV, EP34, EP65 (p < 0.001), and the control (p < 0.05), and finally between transition wood and early wood for EP34 (p < 0.001) and TV (p < 0.05).
We found a highly significant (p < 0.001) negative correlation between mass loss, on the one hand, and average fiber and average vessel wall thickness on the other. The Pearson correlation coefficient between mass loss and average fiber wall thickness was −0.83, and between mass loss and average vessel wall thickness −0.64.
4. Discussion
4.1. Mass Loss
All fungal isolates caused greater mass loss compared to control samples, but not all comparisons were significant. Fifteen weeks of exposure to ten different fungal species resulted in notable mass loss of A. pseudoplatanus, A. platanoides, and A. campestre wood samples. The mass loss of samples exposed to EN 113 [20] standard fungi T. versicolor was higher than 25%. This clearly indicates that the fungal mycelia were vital and that the test was performed correctly. The mass loss of samples exposed to EM (in A. pseudoplatanus), EP34 (in A. platanoides and A. campestre), Fs, NF, and NP was lower than 3% and thus considered insignificant according to EN 113 [20].
As expected, T. versicolor and G. trabeum were the most efficient species in the colonization and decay of wood samples. Both species are known as quick colonizers and efficient decay organisms of different woody species worldwide [31,32]. Average mass loss caused by T. versicolor isolates in samples of A. pseudoplatanus and A. platanoides (40.9% and 40.0%) in our study was almost two times higher than previously reported by Reinprecht, Vidholdová, and Gašpar [33] (20.4% in A. pseudoplatanus) and Kielmann, Adamopoulos, Militz, and Mai [34] (32.0% in A. platanoides). Differences in mass loss between studies could be ascribed to shorter or longer exposure times (6 weeks in Reinprecht, Vidholdová, and Gašpar [33] and 16 weeks in Kielmann, Adamopoulos, Militz, and Mai [34]), fungal isolate origin, vitality and strength, dimensions of samples, eventual fungal combinations, incubation temperature and humidity, agar media, etc. However, our results clearly indicate the low durability of maple wood and high degrading ability of the respective white rot fungi.
The average mass loss of samples exposed to GT isolate indicate the possibility of the unsuccessful inoculation of this isolate in A. pseudoplatanus and partly also in A. platanoides samples. The difference between average mass loss caused by GT and GTD was simply too large, although these are just two isolates of the same fungal species. Our suspicion was also confirmed with the non-significant difference between the average initial and final dry mass of A. pseudoplatanus samples exposed to GT and the non-significant difference in the average mass loss of control samples and samples exposed to GT in A. pseudoplatanus and A. platanoides. However, the moisture content after 15 weeks of exposure to GT in A. pseudoplatanus samples clearly showed some fungal activity.
Our results on mass loss caused by E. parasitica isolates are somewhat similar to those reported by French [13], who obtained an average mass loss of 1.13, 1.35, and 1.38% in the false heartwood of red, sugar and silver maple, respectively. French [13] reported a slightly higher average mass loss in the sapwood of the same tested tree species—1.28% in red maple, 3.68% in sugar maple, and 2.44% in silver maple. In contrast with our results, French [13] reported no significant differences in average mass loss between five isolates of E. parasitica. Besides the study of French [13], Pildain, Novas, and Carmarán [14] and Worrall, Anagnost, and Zabel [7] also used Eutypella spp. or E. parasitica isolates in their decay tests. The former studied the wood decay of Populus deltoides W. Bartram ex Marshall in a 12-week experiment with four isolates of Eutypella spp. and calculated an average mass loss of 17.6%. The latter exposed Betula alleghaniensis Britt. and Pinus taeda L. sapwood to E. parasitica and reported 5.6% mass loss for Betula and 2.3% for Pinus. When comparing mass loss caused by E. parasitica isolates, it should be noted that the methodologies used in foreign studies [7,13,14] were slightly different from the methodology used in our study. Therefore, direct comparisons of the results are not appropriate. However, the present study provided an overview of the degradation activity and strength of E. parasitica on Acer spp. As expected, the rate and degree of wood degradation by E. parasitica isolates was slower and lower in comparison with T. versicolor and G. trabeum.
4.2. Moisture Content
The overall moisture content of the samples in our study was rather high. As the samples were not in direct contact with the nutrient medium, it can be presumed that the high moisture content was the result of fungal activity. Although the moisture content was rather high for classical wood degrading fungi [35], it should be noted that the fungi used in our study predominantly colonize living trees and are thus adapted to higher moisture content [36]. Fungi that cause mass loss produce water. In theory, the complete decomposition of 1 g of cellulose by microbial action liberates 0.555 g of water [37]. Thus, it is difficult to say whether lower mass loss is a result of lower wood moisture content or lower moisture content is a result of lower mass loss [38]. Zelinka, Kirker, Bishell, and Glass [38] have suggested examination of the extra effect of fungal growth on the final moisture content by computing the change in moisture content. ΔMC should represent the extra amount of moisture generated by the fungus. Consistent with Zelinka, Kirker, Bishell, and Glass [38], our results showed that higher amounts of fungal metabolism, which are reflected in higher mass loss, are associated with higher final moisture content (especially true for T. versicolor and G. trabeum isolates). The reason for the negative value of ΔMC for EM in samples of A. platanoides is not clear, but other authors have also reported this phenomenon [38,39].
The non-statistically significant differences in average moisture content between control samples and samples exposed to certain fungi suggest that those fungal species did not produce high amounts of water, which is consistent with their lower decomposition ability.
4.3. Wood Structural Changes
Microscopy revealed additional information on wood sample colonization and confirmed that mass loss was the consequence of fungal activity. The tested fungi colonized the vessels, which are the widest cells in maple wood and represent a kind of highway for fungi, as reported by Humar, et al. [40] for oak wood. In our study, TV was the most efficient fungus in A. pseudoplatanus colonization and decay. The light microscopy images and measurements of cell wall thickness showed that samples exposed to TV suffered significant cellulose and hemicellulose degradation, thus confirming the high susceptibility of sycamore maple wood to this white rot fungus. Severe damage caused by TV attack was further evidenced and confirmed with scanning electron microscopy.
Other fungi included in the SEM analysis were less effective—they were able to colonize maple wood but not able to decompose it to a large extent. Cross and tangential sections of wood samples exposed to EP34 and EP65 showed a considerably smaller impact of the tested fungi on wood degradation. This is consistent with the results of lower mass loss and thicker cell walls compared to well degraded wood samples exposed to TV. However, average fiber and vessel wall thickness in samples exposed to EP34 and EP65 were not significantly different in any part of the wood increment. In contrast to French [13], who reported no difference in average mass loss between different isolates of E. parasitica, we detected a significant difference in average mass loss between EP34 and EP65. The differences between E. parasitica isolates in our study could be the first sign of possible introduction of the pathogen to North America from Europe, and not the inverse, as is commonly believed. However, such conclusions are speculative and would require a complete study of phylogeny to confirm.
Based on the results of sections stained with safranin/astra-blue water solution, which colored the inner parts of the secondary cell wall slightly blue, we assumed that E. parasitica was able to degrade lignin and therefore could be considered as a white rot fungus. Our conclusion about the type of decay caused by E. parasitica is consistent with Pildain, Novas, and Carmarán [14], who stated that this fungus could be considered as a white rot fungus in the more advanced stages of wood colonization and as a soft rot fungus in the early stages, as already suggested by Worrall, Anagnost, and Zabel [7]. In general, ascomycete fungi are mainly characterized as soft rot fungi [9], which are able to degrade both polysaccharides and lignin, but lignin is degraded at a later stage [41]. Thus, our suspicion about the type of decay is consistent with past studies. However, such conclusions are somewhat speculative since E. parasitica is not very aggressive in wood decay. For the exact determination of the type of decay, additional analysis of enzyme activity in different environmental conditions should be performed, which was beyond the scope of the present study.
Abundant hyphae in the center of exposed samples, where cross and tangential sections for microscopy were taken, confirmed good overgrowth and successful penetration of fungal mycelium into woody tissue. Higher hyphae abundance suggests higher colonization success and subsequent wood decay by fungi. In the case of wood samples exposed to EP34, where fungal hyphae were more or less limited to the edge of samples, we assumed that the fungus had not effectively progressed into the central part because of the lower isolate ability to penetrate the wood and short time of exposure. French [13] reported penetration of E. parasitica into the fibers and vessels, and only occasionally into the ray parenchyma. French [13] did not notice any evident staining or discoloration associated with the decay, which was also the case in our study. In samples exposed to EP34, there was minor sign of fungal activity observed with light microscopy. However, scanning electron microscopy revealed the presence of fungal hyphae in the vessels, indicating and confirming the higher sensitivity of the latter technique. Although light microscopy permits the rapid view of many cells with easier sample preparation, it is better to use it in combination with scanning electron microscopy for reliable detection of fungal presence [42], especially in the early stages of decay or when dealing with less aggressive fungi. Furthermore, data on the low mass loss and hyphal abundance of E. parasitica is consistent with observations of the slow progress of this species and wood decay in the field. The average annual growth of the fungus in length is 1–2 cm [43]. The extension of the canker is faster in the longitudinal direction than in the transverse direction [44]. Ogris, et al. [45] stated that infected older maples can live and grow with fungus for many decades. But due to the progress of fungal activity, wood decay and loss of mechanical properties, it is very common for older infected trees to snap at the canker and fall over [13,46].
Measured cell wall thickness correlated well with the calculated mass loss of the wooden mini blocks. Successful colonization and effective degradation of woody tissue resulted in higher mass loss. This is most evident in samples exposed to TV. Although E. parasitica isolates caused about four times smaller mass loss of samples compared to TV and TVD, we should not disregard their capability of degrading maple wood. Because E. parasitica usually infects the lower portion of the trunk, which is the thickest and most valuable part of the tree, any damage is undesirable, as even incipient decay can result in significant loss of mechanical properties [36].
The natural durability of wood to fungal activity could be indicated by wood density, one of the most important wood quality characteristics. There are studies which confirmed that lower density results in higher susceptibility to fungal decay [40,47]. This could also be the case in our study. In addition, we assume that the early wood of maples is also more susceptible to fungal colonization and decay. Early wood showed slightly thinner fiber and vessel walls, which correspond to slightly lower densities in comparison to other parts of the annual wood increment, i.e., transition wood and late wood.
Based on the results of calculated wood density and moisture content, we assumed that A. campestre wood had somewhat different characteristics from the other two maple species used in this experiment. The wood of A. campestre was significantly denser and had higher average moisture content. However, the correlation between moisture content and wood density was not significant. The higher density of A. campestre wood, in most cases, did not correspond to lower susceptibility to fungal decay and consequently to lower mass loss, as would be expected. This suggests that the relationship between fungal and tree species may also play an important role in the characteristics of wood decay.
Wood discoloration and decay in trees is usually a consequence of bacterial and fungal colonization of branch stubs, which expose the wood of living trees [48]. Decay characteristics and progress can be explained by the CODIT (compartmentalization of decay in trees) model developed by Shigo and Marx [49]. Green, et al. [50] studied compartmentalization of discolored and decayed wood initiated with the loss of branches in young A. rubrum L. They distinguished two basic types of dead branch stubs, some with a clearly defined green-colored boundary, which separated the discolored and decayed wood of the stub from sapwood inside the trunk, and a second type of stub that lacked this boundary and where discolored wood extended into the trunk. Green, Shortle, and Shigo [50] found that failure in the formation or destruction of the boundary tissues may facilitate the spread of microorganisms, discoloration and decay into the trunk. Formation of this barrier is also of great interest in E. parasitica infections. Eutypella parasitica infects the trunk through a branch stub or bark wound and triggers more or less successful compartmentalization. When this is not the case, the fungus progresses into the sapwood and causes characteristic wood discoloration and decay. However, this has yet to be studied.
5. Conclusions
Fifteen weeks of exposure to ten different fungal species resulted in notable mass loss of Acer pseudoplatanus, A. platanoides, and A. campestre wood samples, according to the modified decay test of EN 113. The fungal species used in the experiment had different decay potentials. As expected, Trametes versicolor and Gloeophyllum trabeum were the most efficient species in the colonization and decay of the maple samples. Other fungi (Diaporthe sp., Eutypa sp., Eu. maura, E. parasitica, Fusarium sp., Neocucurbitaria acerina, Neonectria faginata, and N. punicea) were less effective. Any visually evident staining or discoloration of wood samples associated with their activity was not noticed. There was a significant correlation between mass loss and moisture content. Higher mass loss corresponded to higher moisture content of wood samples after incubation. Colonization and decay of samples were additionally confirmed by light and scanning electron microscopy, which revealed abundant hyphal growth in the vessels and sometimes significant degradation of cell walls. Changes in cell walls were confirmed by measurements of fiber and vessel wall thickness in the early wood, transition wood, and late wood. The results revealed significantly thinner cell walls in samples which experienced higher mass loss and degradation. Although E. parasitica caused significantly lower mass loss of samples compared to other more effective species, we should not disregard its capability of degrading maple wood, particularly as we were not able to fully mimic the natural microclimate in the trees in the laboratory. Based on the results of staining, we assumed that E. parasitica was able to degrade lignin and could therefore be considered as a white rot fungus.
Author Contributions
Conceptualization, A.B., B.P. and N.O.; methodology, A.B., B.P., M.H., J.G. and N.O.; validation, A.B., B.P., M.H., J.G. and N.O.; formal analysis, A.B., B.P., M.H., J.G. and N.O.; investigation, A.B., B.P., M.H., J.G. and N.O.; resources, A.B., B.P., M.H., J.G. and N.O.; data curation, A.B., B.P., M.H., J.G. and N.O.; writing—original draft preparation, A.B.; writing—review and editing, A.B., B.P., M.H., J.G. and N.O.; visualization, A.B.; supervision, A.B., B.P. and N.O. All authors have read and agreed to the published version of the manuscript.
Funding
This research was funded by the Slovenian Research Agency (Young Research Scheme for A.B.; Research Program P4-0107 Forest Biology, Ecology and Technology) and by the Ministry of Agriculture, Forestry and Food (Public Forestry Service).
Acknowledgments
The authors acknowledge SiDG for their generous permission to harvest chosen trees in their forest and Mojca Bogovič (Slovenia Forest Service) for her help in locating appropriate trees. We are grateful for enormous help in the field from Mirko Baša and Robert Krajnc (Slovenian Forestry Institute) and laboratory assistance from Špela Jagodic, Andraž Marinč, Magda Špenko and Nina Šramel (Slovenian Forestry Institute). Many thanks go to Samo Grbec and Andreja Žagar from the Department of Wood Science and Technology, Biotechnical Faculty, University of Ljubljana, who prepared the wood samples and fungal cultures. We also thank Gregor Skoberne (Slovenian Forestry Institute) and Angela Balzano (University of Ljubljana, Biotechnical Faculty, Department of Wood Science and Technology) for sample preparation and microscopy photographs. We are grateful to Jan Nagel for providing language help. We are especially grateful to two reviewers for their constructive comments which improved the manuscript.
Conflicts of Interest
The authors declare no conflict of interest. The funders had no role in the design of the study; in the collection, analyses or interpretation of the data; in the writing of the manuscript; or in the decision to publish the results.
References
- Shortle, W.C.; Dudzik, K.R. Wood Decay in Living and Dead Trees: A Pictorial Overview; United States Department of Agriculture, Forest Service, Northern Research Station: Newtown Square, PA, USA, 2012; p. 26. [Google Scholar]
- Downer, A.J.; Perry, E.J. Wood decay fungi in landscape trees. In UC IPM Pest Notes; UC ANR Publication: Oakland, CA, USA, 2019; Volume 74109, p. 6. [Google Scholar]
- Schwarze, F.W.M.R. Wood decay under the microscope. Fungal Biol. Rev. 2007, 21, 133–170. [Google Scholar] [CrossRef]
- Mester, T.; Varela, E.; Tien, M. Wood degradation by brown-rot and white-rot fungi. In Genetics and Biotechnology; Kück, U., Ed.; Springer: Berlin/Heidelberg, Germany, 2004; pp. 355–368. [Google Scholar]
- Shupe, T.; Lebow, S.; Ring, D. Causes and Control of Wood Decay, Degradation and Stain; Louisiana State University Agriculture Center: Baton Rouge, LA, USA, 2008; p. 27. [Google Scholar]
- Schwarze, F.W.M.R. Forest pathology: Heart rot and wood decay. In Encyclopedia of Forest Sciences; Burley, J., Evans, J., Youngquist, J., Eds.; Elsevier: Amsterdam, The Netherlands, 2004; pp. 808–816. [Google Scholar]
- Worrall, J.J.; Anagnost, S.E.; Zabel, R.A. Comparison of wood decay among diverse lignicolous fungi. Mycologia 1997, 89, 199–219. [Google Scholar] [CrossRef]
- Shary, S.; Ralph, S.A.; Hammel, K.E. New insights into the ligninolytic capability of a wood decay ascomycete. Appl. Environ. Microb. 2007, 73, 6691–6694. [Google Scholar] [CrossRef] [PubMed] [Green Version]
- Mäkelä, M.R.; Marinović, M.; Nousiainen, P.A.; Liawanag, A.J.M.; Benoit, I.; Sipilä, J.; Hatakka, A.I.; de Vries, R.; Hilden, S.K. Aromatic metabolism of filamentous fungi in relation to the presence of aromatic compounds in plant biomass. Adv. Appl. Microbiol. 2015, 91, 63–137. [Google Scholar] [CrossRef] [PubMed]
- Jurc, D.; Ogris, N.; Slippers, B.; Stenlid, J. First report of Eutypella canker of Acer pseudoplatanus in Europe. Plant Pathol. 2006, 55, 577. [Google Scholar] [CrossRef]
- Davidson, R.W.; Lorenz, R.C. Species of Eutypella and Schizoxylon associated with cankers of maple. Phytopathology 1938, 28, 733–745. [Google Scholar]
- Ogris, N.; Jurc, D.; Jurc, M. Spread risk of Eutypella canker of maple in Europe. Bull. OEPP/EPPO Bull. 2006, 36, 475–485. [Google Scholar] [CrossRef]
- French, W.J. Eutypella Canker on Species of Acer in New York State. Ph.D. Thesis, State University College of Forestry at Syracuse University, Syracuse, NY, USA, 1967. [Google Scholar]
- Pildain, M.B.; Novas, M.V.; Carmarán, C.C. Evaluation of anamorphic state, wood decay and production of lignin-modifying enzymes for diatrypaceous fungi from Argentina. J. Agric. Technol. 2005, 1, 81–96. [Google Scholar]
- Kleist, G.; Schmitt, U. Characterisation of a soft rot-like decay pattern caused by Coniophora puteana (Schum.) Karst. in sapelli Wood (Entandrophragma cylindricum Sprague). Holzforschung 2001, 55, 573–578. [Google Scholar] [CrossRef]
- Brglez, A.; Piškur, B.; Ogris, N. Eutypella parasitica and other frequently isolated fungi in wood of dead branches of young sycamore maple (Acer pseudoplatanus) in Slovenia. Forests 2020, 11, 467. [Google Scholar] [CrossRef] [Green Version]
- Bravery, F. A miniaturised wood-block test for the rapid evaluation of wood preservative fungicides. In Proceedings of the International Research Group on Wood Protection, Peebles, UK, 18–22 September 1978; pp. 57–65. [Google Scholar]
- Sutter, H.P. A new technique for screening fungicides for wood preservatives. Int. Biodeterior. 1987, 14, 95–99. [Google Scholar]
- Brown, J.; Caswell, S.; Williams, G.R. Development of miniblock test method for rapid evaluation of preservative performance against Basidiomycete fungi. In Proceedings of the International Research Group on Wood Preservation, Kyoto, Japan, 20–24 May 1991; pp. 1–11. [Google Scholar]
- CEN. EN 113—Wood Preservatives—Test Method for Determining the Protective Effectiveness against Wood Destroying Basidiomycetes.–Determination of the Toxic Values; European Committee for Standardization: Brussels, Belgium, 2002; p. 34. [Google Scholar]
- van der Wef, G.W.; Sass-Klaassen, U.G.W.; Mohren, G.M.J. The impact of the 2003 summer drought on the intra-annual growth pattern of beech (Fagus sylvatica L.) and oak (Quercus robur L.) on a dry site in the Netherlands. Dendrochronologia 2007, 25, 103–112. [Google Scholar] [CrossRef]
- Srebotnik, E.; Messner, K. A Simple method that uses differential staining and Llight microscopy to assess the selectivity of wood delignification by white rot fungi. Appl. Environ. Microb. 1994, 60, 1383–1386. [Google Scholar] [CrossRef] [Green Version]
- von Aufsess, H. Mikroskopische Darstellung des Verholzungsgrades durch Färbemethoden. Holz als Roh-und Werkstoff 1973, 31, 24–33. [Google Scholar] [CrossRef]
- R Core Team. R: A Language and Environment for Statistical Computing, 3.6.1; R Foundation for Statistical Computing: Vienna, Austria, 2019. [Google Scholar]
- Fox, J.; Weisberg, S. An R Companion to Applied Regression, 3rd ed.; Sage: Thousand Oaks, CA, USA, 2019. [Google Scholar]
- Signorell, A. DescTools: Tools for Descriptive Statistics. R Package Version 0.99.30.; 2019. Available online: https://cran.r-project.org/web/packages/DescTools/index.html (accessed on 15 March 2020).
- Hothorn, T.; Bretz, F.; Westfall, P. Simultaneous inference in general parametric models. Biom. J. 2008, 50, 346–363. [Google Scholar] [CrossRef] [PubMed] [Green Version]
- Wickham, H.; François, R.; Henry, L.; Müller, K. dplry: A Grammar of Data Manipulation. R Package Version 0.8.3.; 2019. Available online: https://cran.r-project.org/web/packages/dplyr/index.html (accessed on 15 March 2020).
- Robinson, D.; Hayes, A. Broom: Convert Statistical Analysis Objects into Tidy Tibbles. R Package Version 0.5.2.; 2019. Available online: https://cran.r-project.org/web/packages/broom/index.html (accessed on 15 March 2020).
- de Vries, W.; Reinds, G.J.; Posch, M.; Sanz, M.J.; Krause, G.H.M.; Calatayud, V.; Renaud, J.P.; Vel, E.M.; Dobertin, M.; Gundersen, P.; et al. Intensive Monitoring of Forest Ecosystems in Europe; European Commission: Brussels, Geneva, 2003; p. 163. [Google Scholar]
- Robinson, S.C.; Laks, P.E.; Richter, D.L.; Pickens, J.B. Evaluating loss of machinability in spalted sugar maple. For. Prod. J. 2007, 57, 33–37. [Google Scholar]
- Humar, M.; Lesar, B.; Thaler, N.; Kržišnik, D.; Kregar, N.; Drnovšek, S. Quality of copper impregnated wood in Slovenian hardware stores. Drvna Ind. 2018, 69, 121–126. [Google Scholar] [CrossRef]
- Reinprecht, L.; Vidholdová, Z.; Gašpar, F. Decay inhibition of maple wood with nano-zinc oxide used in combination with essential oils. Acta Facultatis Xylologiae Zvolen 2016, 58, 51–58. [Google Scholar] [CrossRef]
- Kielmann, B.C.; Adamopoulos, S.; Militz, H.; Mai, C. Decay resistance of ash, beech and maple wood modified with N-methylol melamine and a metal complex dye. Int. Biodeter. Biodegr. 2014, 89, 110–114. [Google Scholar] [CrossRef]
- Meyer, L.; Brischke, C.; Treu, A.; Larsson-Brelid, P. Critical moisture conditions for fungal decay of modified wood by basidiomycetes as detected by pile tests. Holzforschung 2016, 70, 331–339. [Google Scholar] [CrossRef]
- Schmidt, O. Wood and Tree Fungi: Biology, Damage, Protection, and Use; Springer: Berlin/Heidelberg, Germany, 2006; p. 336. [Google Scholar]
- Griffin, D.M. Water potential and wood-decay fungi. Annu. Rev. Phytopathol. 1977, 15, 319–329. [Google Scholar] [CrossRef]
- Zelinka, S.L.; Kirker, G.T.; Bishell, A.B.; Glass, S.V. Effects of wood moisture content and the level of acetylation on brown rot decay. Forests 2020, 11, 299. [Google Scholar] [CrossRef] [Green Version]
- Peterson, C.A.; Cowling, E.B. Influence of various initial moisture contents on decay of Sitka spruce and sweetgum sapwood by Polyporus versicolor in the soil-block test. Phytopathology 1973, 63, 235–237. [Google Scholar] [CrossRef]
- Humar, M.; Fabčič, B.; Zupančič, M.; Pohleven, F.; Oven, P. Influence of xylem growth ring width and wood density on durability of oak heartwood. Int. Biodeter. Biodegr. 2008, 62, 368–371. [Google Scholar] [CrossRef]
- Brischke, C.; Unger, W. Potential hazards and degrading agents. In Performance of Bio-Based Building Materials; Jones, D., Brischke, C., Eds.; Elsevier: Amsterdam, Netherlands, 2017; pp. 188–203. [Google Scholar]
- Wilcox, W.W. Comparison of scanning electron microscopy and light microscopy for the diagnosis of early stages of brown rot wood decay. IAWA J. 1993, 14, 219–226. [Google Scholar] [CrossRef] [Green Version]
- Sinclair, W.A.; Lyon, H.H.; Johnson, W.T. Eutypella canker of maple. In Diseases of Trees and Shrubs; Cornell University Press: Ithaca, NY, USA, 1987; pp. 220–221. [Google Scholar]
- Ogris, N.; Piškur, B.; Jurc, D. Some morphological aspects of Eutypella canker of maple (Eutypella parasitica). In Proceedings of the IUFRO Working Party 7.02.02, Eğirdir, Turkey, 11–16 May 2009; pp. 150–161. [Google Scholar]
- Ogris, N.; Jurc, D.; Jurc, M. Javorov rak (Eutypella parasitica: Ascomycota: Fungi) na gorskem javorju in maklenu: Značilnosti in razlike. Gozdarski Vestnik 2005, 63, 411–418. [Google Scholar]
- Kliejunas, J.T.; Kuntz, J.E. Eutypella canker, characteristics and control. For. Chron. 1974, 50, 106–108. [Google Scholar] [CrossRef] [Green Version]
- Dadzie, P.K.; Amoah, M. Density, some anatomical properties and natural durability of stem and branch wood of two tropical hardwood species for ground applications. Eur. J. Wood Prod. 2015, 73, 759–773. [Google Scholar] [CrossRef]
- Shigo, A.L. Biology of decay and wood quality. In Biological Transformation of Wood by Microorganisms; Liese, W., Ed.; Springer: Berlin/Heidelberg, Germany, 1975; p. 15. [Google Scholar]
- Shigo, A.L.; Marx, H.G. Compartmentalization of Decay in Trees; U.S. Department of Agriculture, Forest Service: Washington, DC, USA, 1977; p. 73. [Google Scholar]
- Green, D.J.; Shortle, W.C.; Shigo, A.L. Compartmentalization of discolored and decayed wood in red maple branch stubs. For. Sci. 1981, 27, 519–522. [Google Scholar]
Figure 1.
Boxplot showing mass loss (%) after 15 weeks of exposure to different fungal isolates in Acer pseudoplatanus (see Table 1 for labels of isolates; boxes of E. parasitica isolates are grey). Boxplot represents minimum, first quartile (Q1), median, third quartile (Q3), and maximum value.
Figure 1.
Boxplot showing mass loss (%) after 15 weeks of exposure to different fungal isolates in Acer pseudoplatanus (see Table 1 for labels of isolates; boxes of E. parasitica isolates are grey). Boxplot represents minimum, first quartile (Q1), median, third quartile (Q3), and maximum value.

Figure 2.
Boxplot showing mass loss (%) after 15 weeks of exposure to different fungal isolates in Acer platanoides (see Table 1 for labels of isolates; boxes of E. parasitica isolates are grey). Boxplot represents minimum, first quartile (Q1), median, third quartile (Q3), and maximum value.
Figure 2.
Boxplot showing mass loss (%) after 15 weeks of exposure to different fungal isolates in Acer platanoides (see Table 1 for labels of isolates; boxes of E. parasitica isolates are grey). Boxplot represents minimum, first quartile (Q1), median, third quartile (Q3), and maximum value.

Figure 3.
Boxplot showing mass loss (%) after 15 weeks of exposure to different fungal isolates in Acer campestre (see Table 1 for labels of isolates; boxes of E. parasitica isolates are grey). Boxplot represents minimum, first quartile (Q1), median, third quartile (Q3), and maximum value.
Figure 3.
Boxplot showing mass loss (%) after 15 weeks of exposure to different fungal isolates in Acer campestre (see Table 1 for labels of isolates; boxes of E. parasitica isolates are grey). Boxplot represents minimum, first quartile (Q1), median, third quartile (Q3), and maximum value.

Figure 4.
Boxplots showing moisture content (%) after 15 weeks of exposure to different fungal isolates in Acer pseudoplatanus (see Table 1 for labels of isolates; boxes of E. parasitica isolates are grey). Boxplot represents minimum, first quartile (Q1), median, third quartile (Q3), and maximum value.

Figure 5.
Boxplots showing moisture content (%) after 15 weeks of exposure to different fungal isolates in Acer platanoides (see Table 1 for labels of isolates; boxes of E. parasitica isolates are grey). Boxplot represents minimum, first quartile (Q1), median, third quartile (Q3), and maximum value.

Figure 6.
Boxplots showing moisture content (%) after 15 weeks of exposure to different fungal isolates in Acer campestre (see Table 1 for labels of isolates; boxes of E. parasitica isolates are grey). Boxplot represents minimum, first quartile (Q1), median, third quartile (Q3), and maximum value.
Figure 6.
Boxplots showing moisture content (%) after 15 weeks of exposure to different fungal isolates in Acer campestre (see Table 1 for labels of isolates; boxes of E. parasitica isolates are grey). Boxplot represents minimum, first quartile (Q1), median, third quartile (Q3), and maximum value.

Figure 7.
Light microscopy (LM) images of cross and tangential sections of (a,b) control samples and wood samples after 15 weeks of exposure to (c,d) EP34, (e,f) EP65, and (g,h) TV.
Figure 7.
Light microscopy (LM) images of cross and tangential sections of (a,b) control samples and wood samples after 15 weeks of exposure to (c,d) EP34, (e,f) EP65, and (g,h) TV.

Figure 8.
Scanning electron microscopy images of cross and tangential sections of (a,b) control samples and wood samples after 15 weeks of exposure to (c,d) EP34, (e,f) EP65, and (g,h) TV.
Figure 8.
Scanning electron microscopy images of cross and tangential sections of (a,b) control samples and wood samples after 15 weeks of exposure to (c,d) EP34, (e,f) EP65, and (g,h) TV.

Figure 9.
Fiber wall thickness (μm) in (a) late wood, (b) transition wood, and (c) early wood after exposure to different fungal isolates (see Table 1 for labels of isolates; boxes of E. parasitica isolates are grey). Boxplot represents minimum, first quartile (Q1), median, third quartile (Q3), and maximum value.

Figure 10.
Vessel wall thickness (μm) in (a) late wood, (b) transition wood, and (c) early wood after exposure to different fungal isolates (see Table 1 for labels of isolates; boxes of E. parasitica isolates are grey). Boxplot represents minimum, first quartile (Q1), median, third quartile (Q3), and maximum value.


Table 1.
Wood decay fungi used in decay tests.
| Fungi | Label 5 | Collection Number 6 |
|---|---|---|
| Diaporthe sp. Nitschke 1 | Ds | ZLVG 788 |
| Eutypa sp. Tul. & C. Tul. 1 | Es | ZLVG 790 |
| Eutypa maura (Fr.) Sacc. 1 | EM | ZLVG 789 |
| Eutypella parasitica R.W. Davidson & R.C. Lorenz | EP34 | ZLVG 34 |
| EP65 | ZLVG 65 | |
| EP67 | ZLVG 67 | |
| EPT | ZLVG 805 | |
| Fusarium sp. Link 1 | Fs | ZLVG 792 |
| Gloeophyllum trabeum (Pers.) Murrill 2 | GT | ZIM L017 |
| GTD | DSM 1398 | |
| Neocucurbitaria acerina Wanas., Camporesi, E.B.G. Jones & K.D. Hyde 1 | NA | ZLVG 794 |
| Neonectria faginata (M.L. Lohman, A.M.J. Watson & Ayers) Castl. & Rossman 3 | NF | ZLVG 807 |
| Neonectria punicea (J.C. Schmidt) Castl. & Rossman 3 | NP | ZLVG 806 |
| Trametes versicolor (L.) Lloyd 4 | TV | ZIM L057 |
| TVD | DSM 3086 |
1 The most frequently isolated species from the wood of the dead branches of A. pseudoplatanus [16]; 2 brown rot; 3 co-isolated from Eutypella canker of maple; 4 white rot; 5 labels used throughout the text; 6 ZLVG—Culture collection of the Laboratory of Forest Protection at the Slovenian Forestry Institute; ZIM—Culture collection of industrial microorganisms at the University of Ljubljana; DSM—German collection of microorganisms and cell cultures at the Leibnitz Institute.
Table 2.
Change in average moisture content (ΔMC) of samples.
| A. pseudoplatanus ΔMC (%) | A. platanoides ΔMC (%) | A. campestre ΔMC (%) | |
|---|---|---|---|
| Diaporthe sp. | 58.7 | 39.3 | 2.3 |
| Eutypa sp. | 53.8 | 13.9 | 35.4 |
| Eutypa maura | 65.2 | −4.3 | 2.8 |
| Eutypella parasitica1 | 35.7 | 21.5 | 38.1 |
| Fusarium sp. | 73.6 | 30.2 | 27.9 |
| Gloeophyllum trabeum1 | 71.0 | 78.8 | 86.5 |
| Neocucurbitaria acerina | 73.7 | 33.3 | 29.0 |
| Neonectria faginata | 60.0 | 20.0 | 23.7 |
| Neonectria punicea | 45.7 | 4.1 | 24.7 |
| Trametes versicolor1 | 125.0 | 129.8 | 171.6 |
| Average | 64.4 | 42.6 | 54.3 |
1 Average values for all isolates of certain fungal species.
Table 3.
Average wood density and standard deviation of three maple species.
| Tree Species | Wood Density (kg/m3) | SD 1 | Statistic Group 2 |
|---|---|---|---|
| Acer pseudoplatanus | 616 | 18 | ab |
| Acer platanoides | 611 | 26 | b |
| Acer campestre | 620 | 29 | a |
1 SD—standard deviation. 2 Different letters indicate significant differences.
© 2020 by the authors. Licensee MDPI, Basel, Switzerland. This article is an open access article distributed under the terms and conditions of the Creative Commons Attribution (CC BY) license (http://creativecommons.org/licenses/by/4.0/).
Share and Cite
MDPI and ACS Style
Brglez, A.; Piškur, B.; Humar, M.; Gričar, J.; Ogris, N. The Effect of Eutypella parasitica on the Wood Decay of Three Maple Species. Forests 2020, 11, 671. https://doi.org/10.3390/f11060671
AMA Style
Brglez A, Piškur B, Humar M, Gričar J, Ogris N. The Effect of Eutypella parasitica on the Wood Decay of Three Maple Species. Forests. 2020; 11(6):671. https://doi.org/10.3390/f11060671
Chicago/Turabian StyleBrglez, Ana, Barbara Piškur, Miha Humar, Jožica Gričar, and Nikica Ogris. 2020. "The Effect of Eutypella parasitica on the Wood Decay of Three Maple Species" Forests 11, no. 6: 671. https://doi.org/10.3390/f11060671
Note that from the first issue of 2016, this journal uses article numbers instead of page numbers. See further details here.