Reconstruction of Landslide Activity Using Dendrogeomorphological Analysis in the Karavanke Mountains in NW Slovenia


1
Department of Forestry and Renewable Forest Resources, Biotechnical Faculty, University of Ljubljana, Večna pot 83, 1000 Ljubljana, Slovenia
2
Department of Forest Yield and Silviculture, Slovenian Forest Institute, Večna pot 2, 1000 Ljubljana, Slovenia
3
Geological Survey of Slovenia, Dimičeva ulica 14, 1000 Ljubljana, Slovenia
*
Author to whom correspondence should be addressed.
Forests 2019, 10(11), 1009; https://doi.org/10.3390/f10111009
Submission received: 16 September 2019
/
Revised: 6 November 2019
/
Accepted: 8 November 2019
/
Published: 12 November 2019
Abstract
:Tree ring eccentricity was used to reconstruct landslide activity in the last 138 years in the Urbas landslide located at Potoška planina in the NW part of the Karavanke Mountains, Slovenia. The research was based on the dendrochronological sampling of Norway spruce (Picea abies (L.) Karst.) in areas of varying landslide intensity. Analysis of a sudden change in the eccentricity index of 82 curved trees concluded that there were 139 growth disturbances and 16 landslide reactivations between 1880 and 2015, with a landslide return period of 8.5 years. Using lidar data, changes in the surface of the digital terrain model (DTM) were compared with changes in the eccentricity index of trees at the same location in the period 2014–2017. On the basis of temporal changes in the eccentricity index and by using spatial interpolation, landslide activity was reconstructed for the period 1943–2015. During this period, landslide intensity increased in the central part of the landslide. Although categorization into seven categories of different stem curvature was proposed, no distinction between categories with respect to their eccentricity index was found.
1. Introduction
Dendrogeomorphology is a widely used methodology for analyzing past geomorphological activity. The application of dendrogeomorphological analysis was already presented for different tree rings producing shrub and tree species in various climatic regions and geomorphological processes [1]. For example: in polar areas, debris flows were analyzed by the growth of dwarf shrubs [2,3]; in boreal forest (Alaska), landslides were analyzed by Picea mariana (Mill.) Britton, Sterns & Poggenb. [4,5]; in Wyoming (USA) landslides were analyzed by Pseudotsuga menziesii (Mirb.), Franco [6]; in Montana (USA), landslides and snow avalanches were analyzed by P. menziesii, Pinus contorta Douglas ex Loudon, Pinus flexilis E.James, and Abies lasiocarpa (Hook.) Nutt. [7,8,9]; in the Andes, Nothofagus pumilio (Poepp. & Endl.) Reiche, was used for snow avalanches and debris flow reconstruction [10,11]; and Austrocedrus chilensis (D. Don) Pic.Serm. & Bizzarri, Nothofagus dombeyi (Mirb.) Oerst., 1850 and P. menziesii was used for flood analysis [12]. In temperate montane regions (Carpathians and Sudetes), landslide activity was analyzed by the growth of Fagus sylvatica L., Picea abies (L.) H.Karst., and Abies alba Mill. [13,14,15,16,17,18,19], floods by P. abies growth [20], and debris flow and stream erosion were analyzed by the growth of F. sylvatica L. and P. abies [21,22,23]. In the Mediterranean region, cliff and soil erosion were analyzed by the growth of Pinus halepensis Mill. [24,25]. In alpine mountainous regions; snow avalanches were analyzed by the growth of P. abies, Larix decidua Mill., and Pinus mugo var. mugo [26,27,28]; rockfalls by L. decidua, A. alba, and P. abies [29,30,31]; debris flows by Pinus sylvestris L., Pinus cembra L., L. decidua, P. abies, and P. mugo var. mugo [28,32,33]; and especially in French Alps landslides by Pinus uncinata Mill. ex Mirb. [34,35,36,37,38]. There are also some dendrogeomorphological studies from Asia on landslides [39] and debris flows and rockfalls [40].
Landslides represent one of the major threats to inhabited areas and transport infrastructure all around the globe [41,42,43]. An understanding of the spatial and temporal occurrence of landslides is crucial for risk assessment; however, information about past landslide events is often missing or unreliable [34,44,45,46,47,48]. Using dendrogeomorphological analysis based on Shroder’s [49] “process-event-response” principle, it is possible to reconstruct a time series of landslide activity with yearly resolution (e.g., [14,34,35,50,51,52,53]). Dendrogeomorphological analysis is based on recognizing and dating different growth disturbances (GD) in tree rings as a result of landslide activity [54]. Landslide activity causes physical stress to trees, which disrupts normal tree growth and most commonly results in the inclination of the stem [55,56]. Bent trees react by forming reaction wood and tree ring eccentricity [49,57,58,59]. Tree ring eccentricity can also be triggered by other non-geomorphic events such as wind and snow [52]; however, the elimination of other factors that influence eccentricity is achieved by selecting undisturbed trees that grow in the proximity of the landslide [14,52].
Dating of landslide activity on the basis of eccentricity can be performed by computing the eccentricity index (Ei), which compares tree ring widths within the same growing year [54]. Several methods exist to compute Ei from ring widths, and there are several methodological approaches for extracting landslide signals from a time series [13,14,18,50,51,53]. However, steps towards creating a universal eccentricity-based approach to landslide analysis have only recently been undertaken [53].
Another issue in dendrogeomorphology is to distinguish landslide signal (event) from noise (missed event). In order to determine a landslide from a non-landslide event in the tree ring record, different thresholds (e.g., event response index—It, the number of growth disturbances—GD) should be used. However, in the past, different values of thresholds were used for distinguishing landslide events [60,61]. A threshold that has not always been used systematically [36,61] is the event-response index or the It index, which represents the percentage of disturbed trees in the observed year [49,62]. Choosing the appropriate number of trees to sample, number of GD to register as an event, and the appropriate It index influences the number of reconstructed and missed (noise) events, thus influencing the accuracy of the reconstruction [36].
It should be noted that dendrochronological dating of landslides represents an indirect method for observing ground movements (e.g., [16]). The spatial extent and magnitude of landslides are not directly measured with the application of dendrogeomorphological techniques, but they can provide historical intensity estimations. Magnitude is thus expressed as the area affected by reactivation [47], mainly through the spatial distribution and number of disturbed trees [40]. On the other hand, direct measurement of magnitude can be done by measuring the landslide area activated or the volume of the landslide deposit (e.g., [47,63]). By comparing high-resolution digital models (DTM) obtained from different time periods [64], a digital elevation model of differences (DeMoD) can be created [65] in which positive and negative changes in elevation can be expressed as a volumetric change. The resulting vertical ground displacements can be interpreted as accumulation (elevation gain) and loss of material (elevation loss) (e.g., [65,66,67,68]).
Although dendrogemorphological methods were already widely used for studying landslide behavior, there still exists a lack of accuracy in the assessment of tree ring-based methods [69]. The need for accuracy assessment of tree ring methods is especially relevant because tree ring records were already used for hazard mapping [16] and construction of landslide probability maps [38]. Furthermore, because tree ring-based methods can also be applied to analyze the behavior of other geomorphic processes (e.g., snow avalanches and floods) any accuracy assessment methods could also be applied to these research areas. For this reason, the purpose of this paper is to link direct and indirect methods for measuring landslide activity and magnitude. Therefore, the aims of this article are to (i) spatially and temporally reconstruct landslide activity using dendrogeomorphological methods, (ii) compare landslide intensity derived from tree ring records to geological measurements of landslide magnitude, (iii) analyze the relationship between different landslide movement intensity and different categories of tree trunk bending, and (iv) analyze the relationship between changes in the DTM and tree ring eccentricity.
2. Materials and Methods
2.1. Study Area
The study area is situated on the Urbas landslide in the Karavanke Mountains in the NW part of Slovenia. The landslide-prone area is located on Potoška planina under Mt. Vajnež (2099 m), in the hinterland of the settlement of Koroška Bela. In the past, Koroška Bela was already heavily damaged by a debris flow event [70,71], and the risk still exists [72,73].
The landslide-prone area is located between 1125 and 1350 m above sea level and extends across approximately 20 ha, while the active part of the Urbas landslide is 8.53 ha [73]. The volume of the landslide is estimated to be 985,000 m3 [74]. The Urbas landslide consists of: tectonically deformed black shaley mudstone, siltstone, sandstone and conglomerate; black massive limestone; and vast accumulations of limestone scree that is deposited over all of them. The depth of the landslide is estimated at between 5 and 20 m (14 m) [72,73]. The main body of the landslide is characterized by complex dynamics and is presumed to be a slow-motion slip. Locally, the movements indicate deep-seated rotational sliding [73].
Precipitation data were obtained from the closest weather station (Javorniški Rovt, operated by Slovenian Environmental agency) which is located approximately 3 km from the landslide area. Annual precipitation on the site is between 1600 and 1800 mm, while the maximum 24-h precipitation rate is between 180 and 210 mm [75]. The wider area of Potoška planina is characterized by a large number of springs, many of which (e.g., the Urbas spring) also originate in the active part of the Urbas landslide, causing further saturation of the landslide body [71,73].
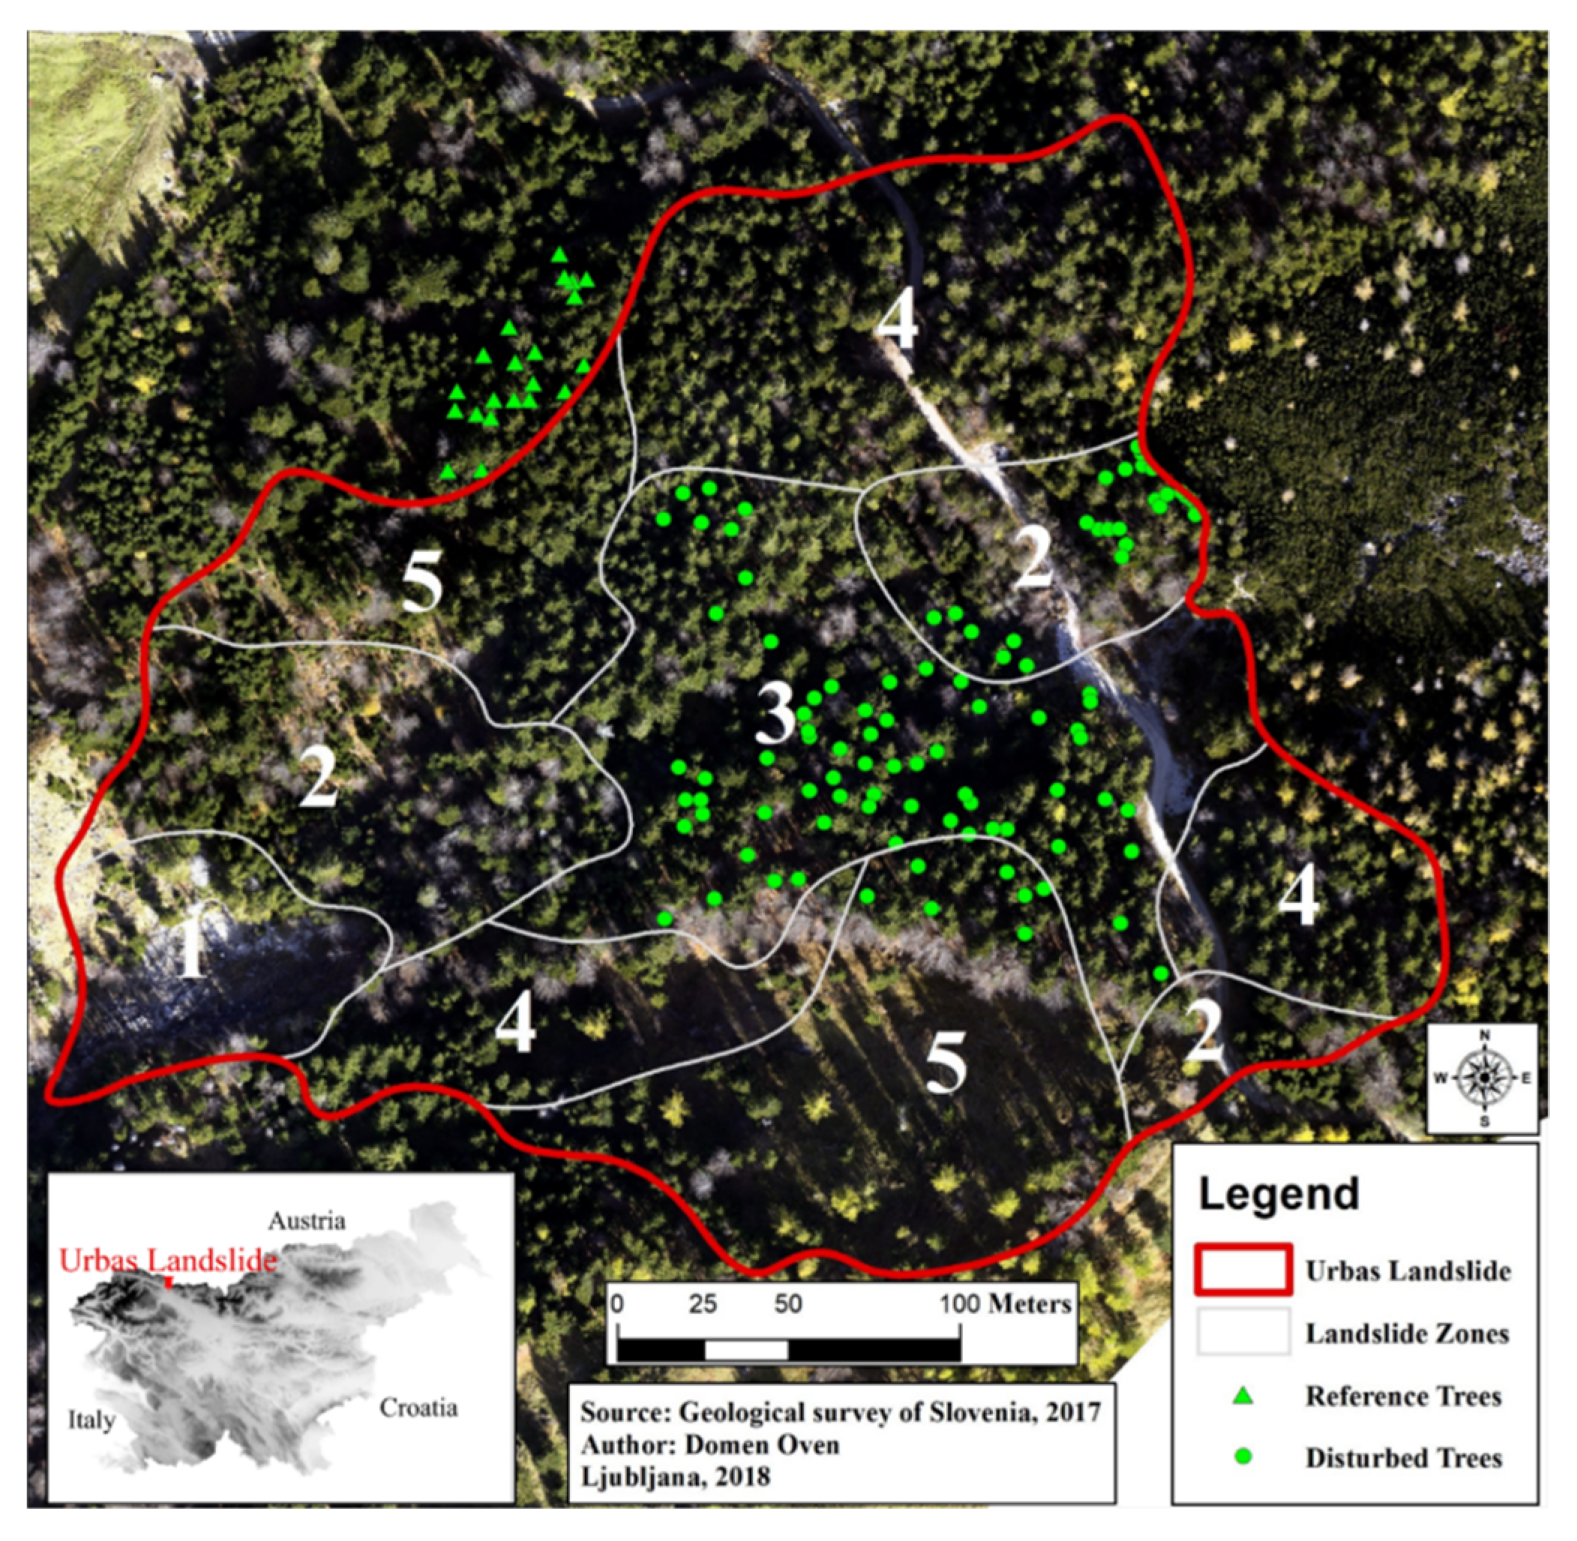
The active landslide area is divided into five (5) zones of different landslide intensity, based on geological measurements and field observations (Figure 1) [71,73]. The first zone is the most active part and is located in the lower part of the landslide (toe of the landslide) where mass movements are estimated to be more than 1 m per year (maximum measured horizontal movements were up to 17.9 m in the observation period) [73]. The terrain is moving at approximately 1 m per year in the second zone, greater than 0.5 m (but less than 1 m) per year in the third zone, and less than 0.5 m per year in zones four and five [73].
2.2. Field Work
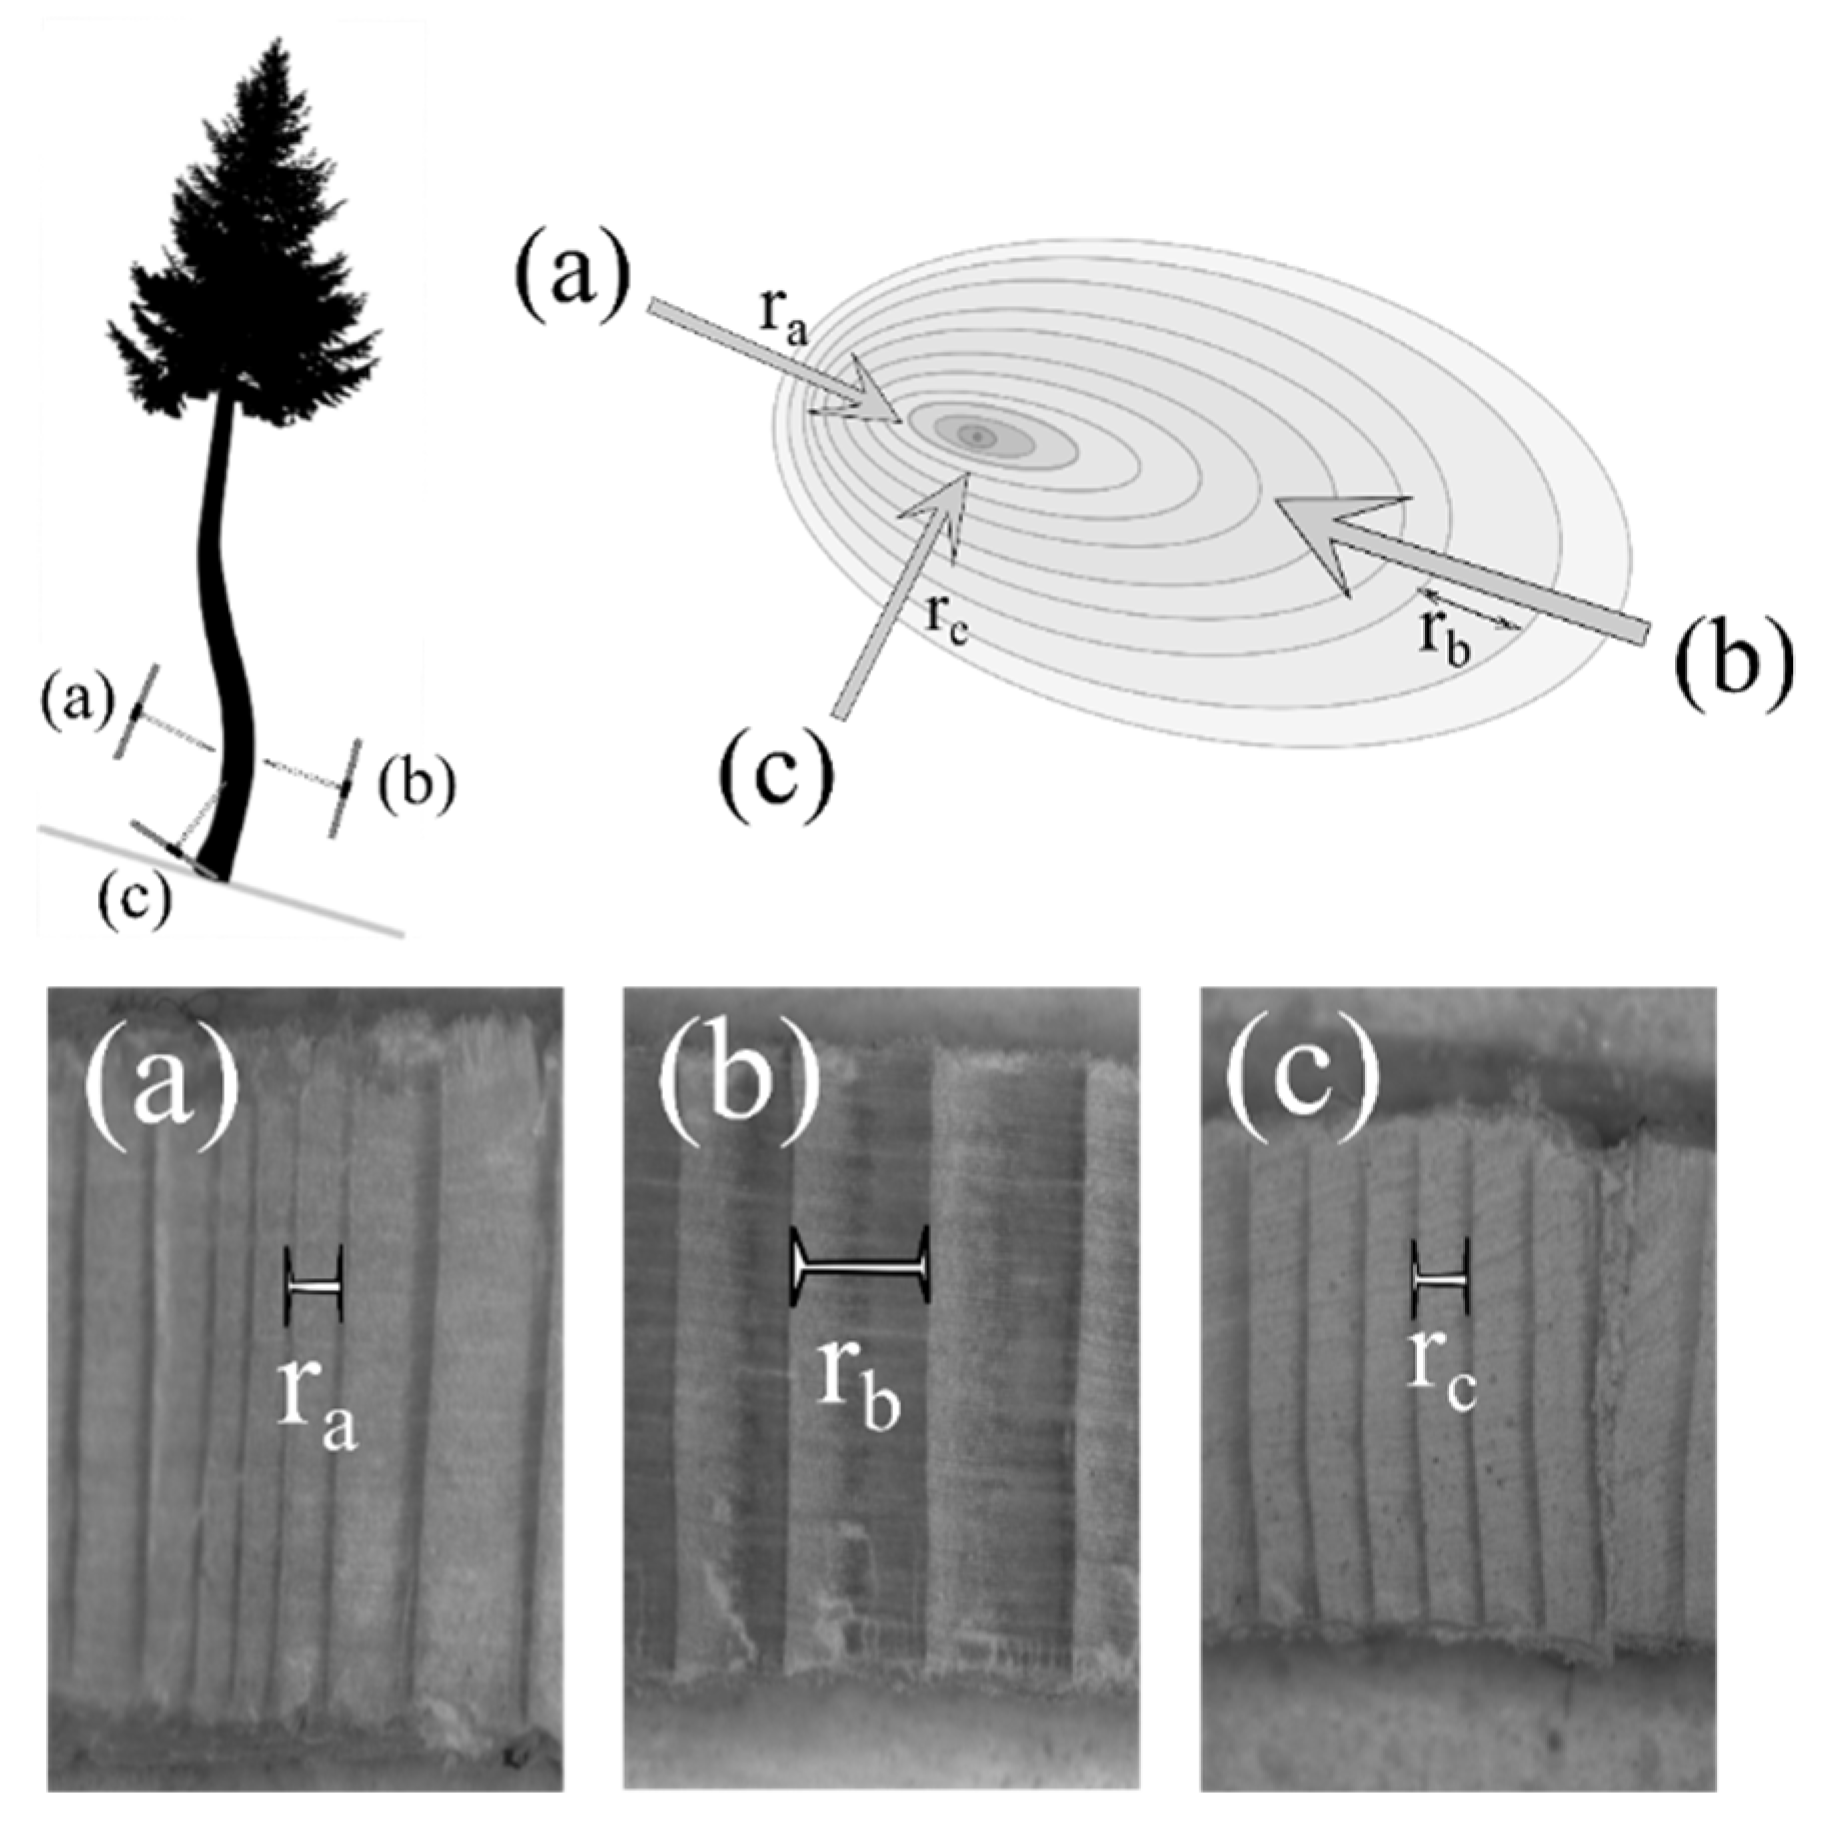
Increment cores were taken from P. abies trees with a 400 mm Pressler borer with a core diameter of 5 mm. Cores were taken at the height of visible maximum bending of the tree or at breast height if the tree was not tilted [50,51,76,77]. Increment cores were taken from three different directions: on the lower part of the trunk, where compression wood was expected; on the upper part of the trunk; and perpendicular to the first sample (control sample) [14,52] (Figure 2). Two hundred and fifty-two increment cores were taken from 97 tilted P. abies trees that showed no visible signs of damage related to non-geomorphological disturbances (e.g., wind, snow, bark beetles). Dominant and codominant trees were sampled, thus eliminating any disturbance in growth resulting from competition [52]. Sampling was done in zones two, three, and five. Zone 1 was excluded from sampling due to a lack of trees, and Zone 4 was too similar to Zone 5 and was therefore also excluded from sampling (Figure 1).
In order to eliminate the influence of other non-geomorphological factors (e.g., climate, insect outbreaks) which also influence the width of the tree rings of landslide disturbed trees, 21 undisturbed P. abies trees were sampled in an area outside of the landslide body area with similar climate conditions [1,14,53], distance between reference trees and disturbed trees was between 50 and 200 m (Figure 1). Cores were sampled perpendicular to the slope (2 cores per tree).
Locations of both landslide disturbed and reference trees were collected using a Trimble T1 GNSS receiver (Trimble, Sunnyvale, CA, USA) [78] with accuracy up to 1 m and a mobile application collector for ArcGIS (ESRI, Redlands, CA, USA) [79]. Additional attributes collected for each tree included diameter at breast height (DBH), tree height, possible tree damage, number of bends, category of tree bending, height of increment cores, health of the tree, social standing of the tree, and photographs of the trunk.
2.3. Laboratory Work
Laboratory work consisted of preparing fresh increment cores for digitalization using standard dendrochronological procedures [80]. Polished increment cores were scanned using the ATRICS© tool (Tom Levanič and Slovenian Forest Institute, Ljubljana, Slovenia) [81]. The widths of individual tree rings were measured in the CooRecorder program, which is a subprogram of CDendroTM (Cybis Electronik & Data AB, Saltsjöbaden, Sweden), with 0.01 mm accuracy. The synchronization of chronologies was done in the PAST4TM program [82]. First, we constructed a reference chronology by on-screen visually and statistically comparing individual increment curves of undisturbed trees to each other with respect to the statistical significance of the t value after Baillie-Pilcher [83] and Gleichläufigkeit (GLK%) [84]. Reference chronology was created with sufficient sample depth (>5) [52] between 2017 and 1880. To cross-date the increment curves of disturbed trees, we visually and statistically compared them to the reference chronology. Comparison between the reference chronology and disturbed trees was done for individual trees, for zone chronologies, and for chronology of all disturbed trees. Crossdating identified missing and/or false rings in the tree ring series. Additionally, comparison with the reference chronology of the undisturbed site also helped to distinguish non-geomorphic from geomorphic signals in the tree ring series (e.g., [1,19,85]). This distinction is possible because variations in growth trends between disturbed and reference trees should be cleared by cross-dating, and any remaining variation in growth trends should be the result of landslide activity. In addition, quality of cross-dating was evaluated using the COFECHA program [86]. Any problematic samples were re-checked in the CooRecorder and PAST4TM program and removed from further analysis if deemed unusable (damaged). In that way, from 97 disturbed trees, 15 trees were excluded.
2.4. Spatial and Temporal Reconstruction of Landslide Activity
Landslide active years in the tree ring series were identified using the eccentricity index Ei. Ei is a computational tool that can be applied to dendrochronology, usually to analyze certain phenomena (e.g., wind stress, avalanche, landslide), but always in relation to tree ring eccentricity [14]. In this article, Ei was calculated using the formula described in [52,87]:
where RB is the width of a tree ring where eccentricity is expected, RC is the width of a tree ring perpendicular to the RB side. Ei values are without units, an exception being Ei defined by [14].
The Ei index is further categorized into three groups: 0 (Ei < 0.25), 1 (0.25 < Ei <0.5), and 2 (Ei > 0.5) [88]. Using a combination of the Ei indexes for the whole tree ring series, signals can be additionally classified into four intensity classes [18], here, the goal is to identify abrupt changes in the intensity of a signal (for further explanation, see [52]). Abrupt changes in signal intensity can be interpreted as a tree reacting to tilting [18,52].
The next step consisted of identifying landslide reactivation years, where a threshold of GD ≥ 3 and It ≥ “3%” were used. GD represents the number of trees with an abrupt eccentricity signal in a given year. Threshold values were selected based on the recommendations of [36], which state that GD ≥ 3 and It ≥ “3%” is best for the signal-to-noise ratio when using a sample size of approximately 100 trees. The It index was calculated using the formula by [49,62]:
where RT is the number of trees showing responses in their tree ring record in year T, and AT is the number of sampled trees in year T.
Additionally, spatial interpolation was applied to the Ei values of landslide disturbed trees for the period from 2014 to 2016, where the interpolated area of extent was compared to changes in the DTM for the period between 2014 and 2017. Interpolation was done using the kriging tool in ArcMap 10.7 (ESRI, Redlands, CA, USA) [89]. Because the focus was on landslide events, Ei values from the first rings with eccentricity signalizing a landslide event were used.
2.5. Landslide Magnitude and Eccentricity
The Urbas landslide was previously delineated into five zones of different landslide magnitudes based on field observations and in-situ measurements [71,73,90]. We tested if the geological zonation of landslide magnitudes is also reflected by tree ring eccentricity. It was expected that trees growing in the landslide zone where the greatest movements were observed would be most influenced by the landslide. For this purpose, mean Ei values from the first rings with eccentricity signalizing a landslide event were calculated and then compared between different zones (2, 3, and 5). A comparison was done for a shorter period between 2014 and 2017 and a longer period between 1880 and 2017.
2.6. Landslide Intensity and Tree Trunk Bending
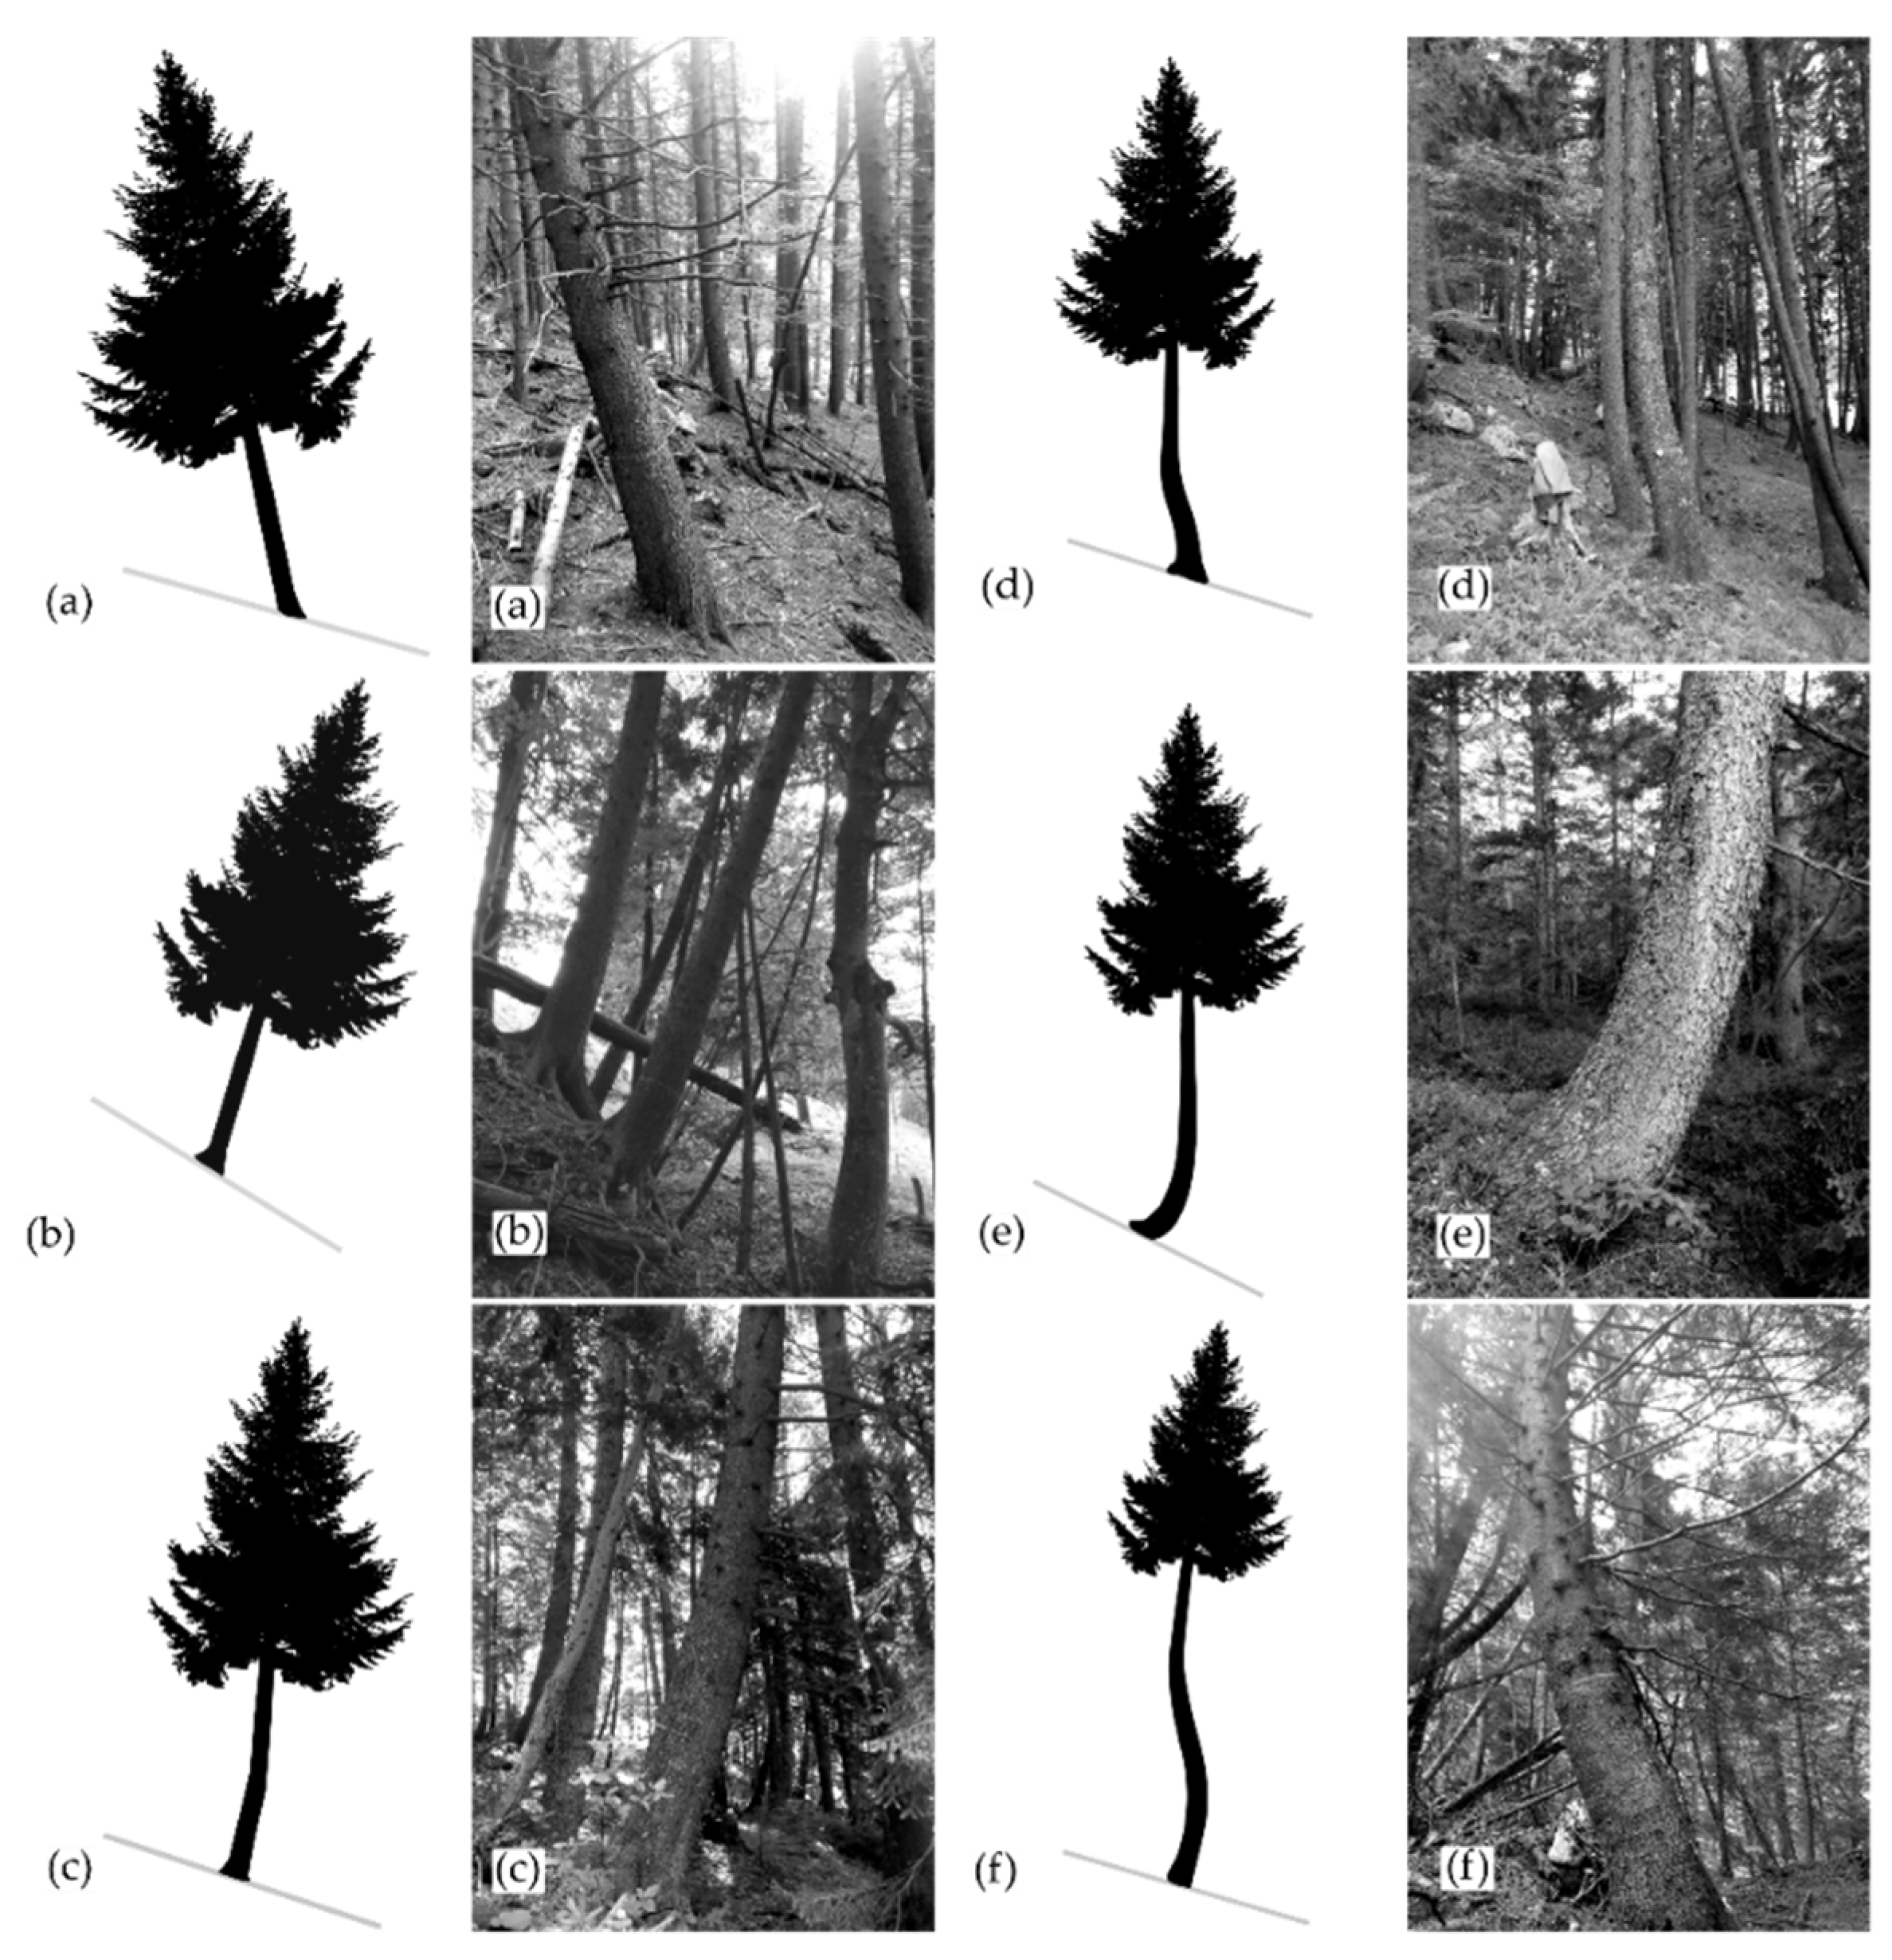
Based on field observations of tree crowns and trunk curvature, stem curvature was categorized following the suggestions of [14,91] (Figure 3). Homogeneity of variance and the Tukey’s HSD (honestly significant difference) test were used to determine if there is a statistical difference between categories and their eccentricity. Mean Ei values were computed for individual trees, and negative Ei values were also included because we hypothesized that if a tree was not curved in the downslope direction, ring widths would have higher values in that direction.
2.7. Changes in the DTM in Relation to Tree Ring Eccentricity
In this article, the relationship between landslide activity and changes in terrain were analyzed by comparing positive and negative changes in the DTM to mean Ei values of trees in the same geolocation for the period between 2014 and 2017. The DTM was obtained by lidar scanning. Data from 2014 was acquired from the Surveying and Mapping Authority of Slovenia by airborne laser scanner RIEGL LMS-Q780, and 2017 data from the Geological Survey of Slovenia by terrestrial laser scanner RIEGL VZ-400. The precision of measurement between data sets differ; 2014 data had a precision of ±0.02 ∆X, ±0.02 ∆Y, ±0.025 ∆Z, and 2017 data had a precision of ±0.01 m. As an indicator of the spatio-temporal landslide activity, cumulative surface displacement between 2014 and 2017 was calculated [69].
For every tree that was disturbed by a landslide reactivation event in the period between 2014 and 2017, Ei was calculated using tree ring widths from the first year after the reactivation event. Later on, negative elevation change (material loss) and positive elevation change (accumulation of material) were compared to Ei values in the same geolocation of the tree.
Further testing of the relationship between DTM change and Ei included the possibility that elevation change could have an impact on tree roots and consequently influence tree growth. Damage to root systems due to landslide activity has been well documented (e.g., [1,37]) although in our case we tested if changes in the DTM in the proximity of a tree could have an impact on Ei. In order to test if changes in the DTM influence Ei, mean differences in the DTM between 2014 and 2017 were extracted within buffer zones of 2, 5, 7.5, and 10 m around the tree location. A radius of 2 m as a buffer zone was based on the documented average radius of the root system of P. abies [92], while the other buffer zone diameters were based on the fact that roots can extend laterally nearly as far as a tree’s height [93]. Therefore, approximations of 5, 7.5, and 10 m were also used as buffer diameters.
3. Results
On the active area of the Urbas landslide, 82 trees with an average age of 116.4 years were included in the eccentricity analysis. The oldest tree was around 175 years old and the youngest was 16 years old. The average DBH was 39.7 cm and the average height was 21.7 m. The average age of the reference trees was 110.6 years. The oldest reference tree was around 160 years old and the youngest around 84 years old. The reference chronology was based on 38 increment cores from 20 trees and covers the period from 1880 to 2017. There was a statistically significant similarity between the chronology of disturbed trees and the reference chronology (GLK index = 71.3%, Coefficient tBP = 5.63, Years of overlap = 144).
3.1. Temporal Reconstruction of Landslide Activity—Landslide Reactivation Years and Intensity of Events
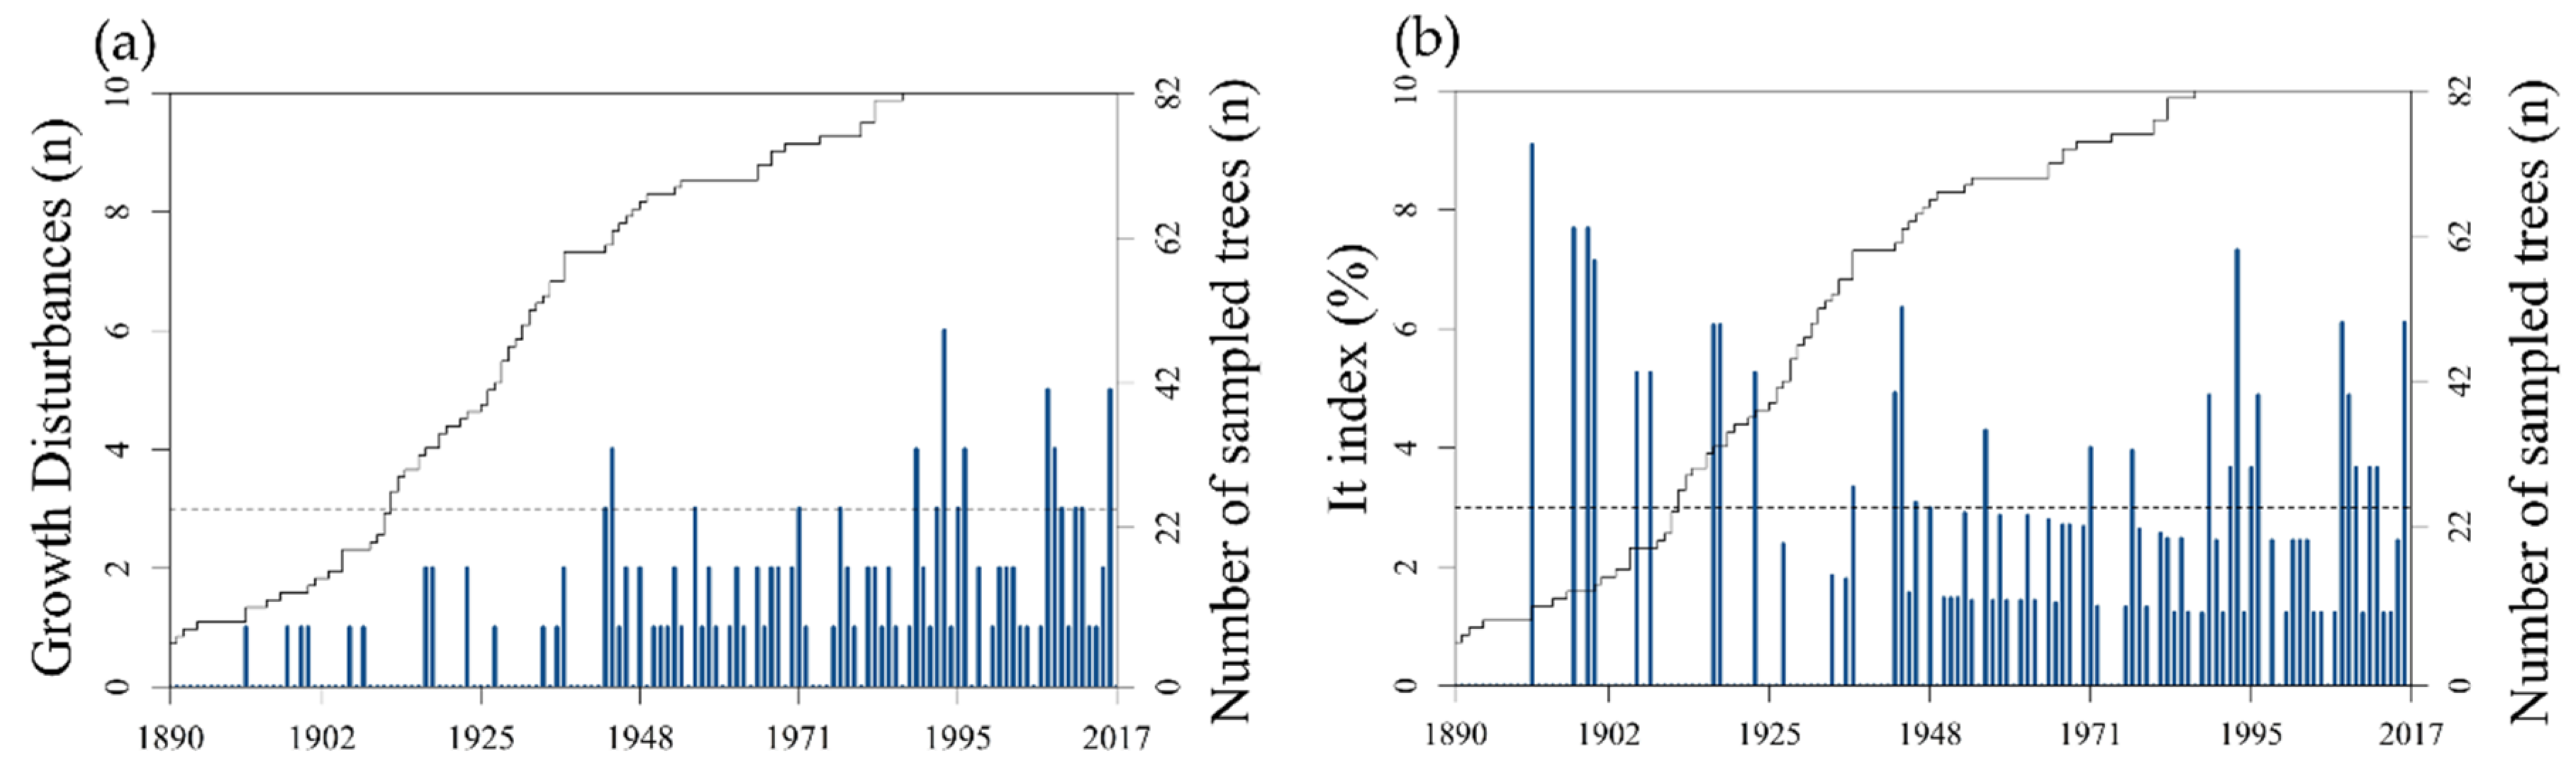
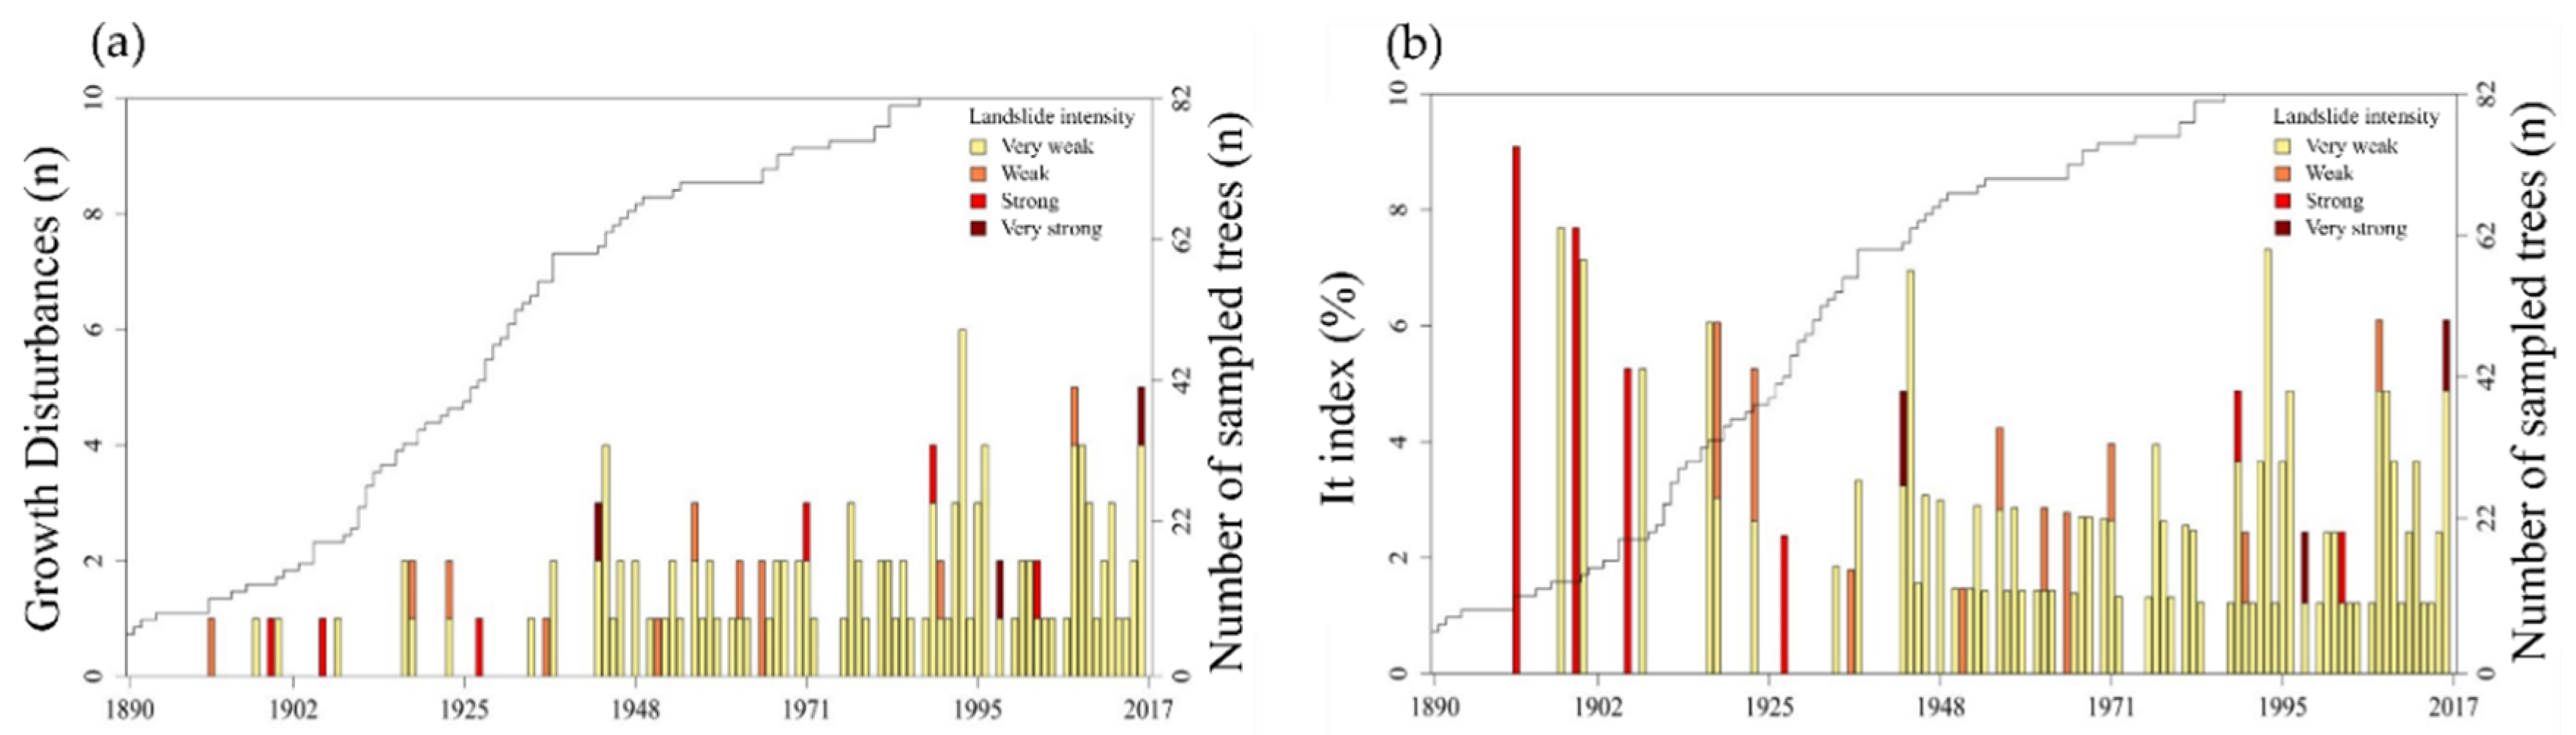
In the last 136 years (1880 to 2015), 139 GD were recognized. Landslide activity was expressed by the It index and GD. The It index exceeded the threshold value (>“3%”) for the first time in 1891, but a very low number of trees recorded that event. The It index exceeded the threshold value (of “3%”) in the following years: 1891, 1897, 1899, 1900, 1906, 1908, 1917, 1918, 1923, 1943, 1944, 1956, 1971, 1977, 1988, 1991, 1992, 1994, 1995, 2007, 2008, 2009, 2012, and 2016 (Figure 4). Based on both the It index and number of GD, 16 yearly anomalies could be recognized. Their return period is 8.5 years. In the period between 1880 and 2015, the first landslide event is detected between 1942 and 1943, while the following nine potential landslide reactivation periods were in 1955, 1970, 1976, 1987, 1990 to 1994, 2006 to 2008, 2010, and 2015.
Based on Ei values, landslide events differ by the degree of the signal. Most landslide events had a very weak intensity (83.9%), followed by weak (7.5%), strong (5.4%), and very strong intensity (3.2%). The strongest events with respect to It and GD thresholds occurred in 1943, 1944, 1956, 1971, 1988, 1992, 1995, 2007, 2008, and 2016. The intensity of landslide events decreases when observed chronologically in the retrograde sense. This is the result of decreasing sample depth the further back in time we observe events. The intensity of landslide signals relative to the It index in a particular year is shown in Figure 5. Stronger signals occurred in 1899, 1906, 1910, 1943, 1971, 1988, 1991, 1993, 1995, 1997, 2002, and 2016.
3.2. Spatial Reconstruction of Landslide Activity
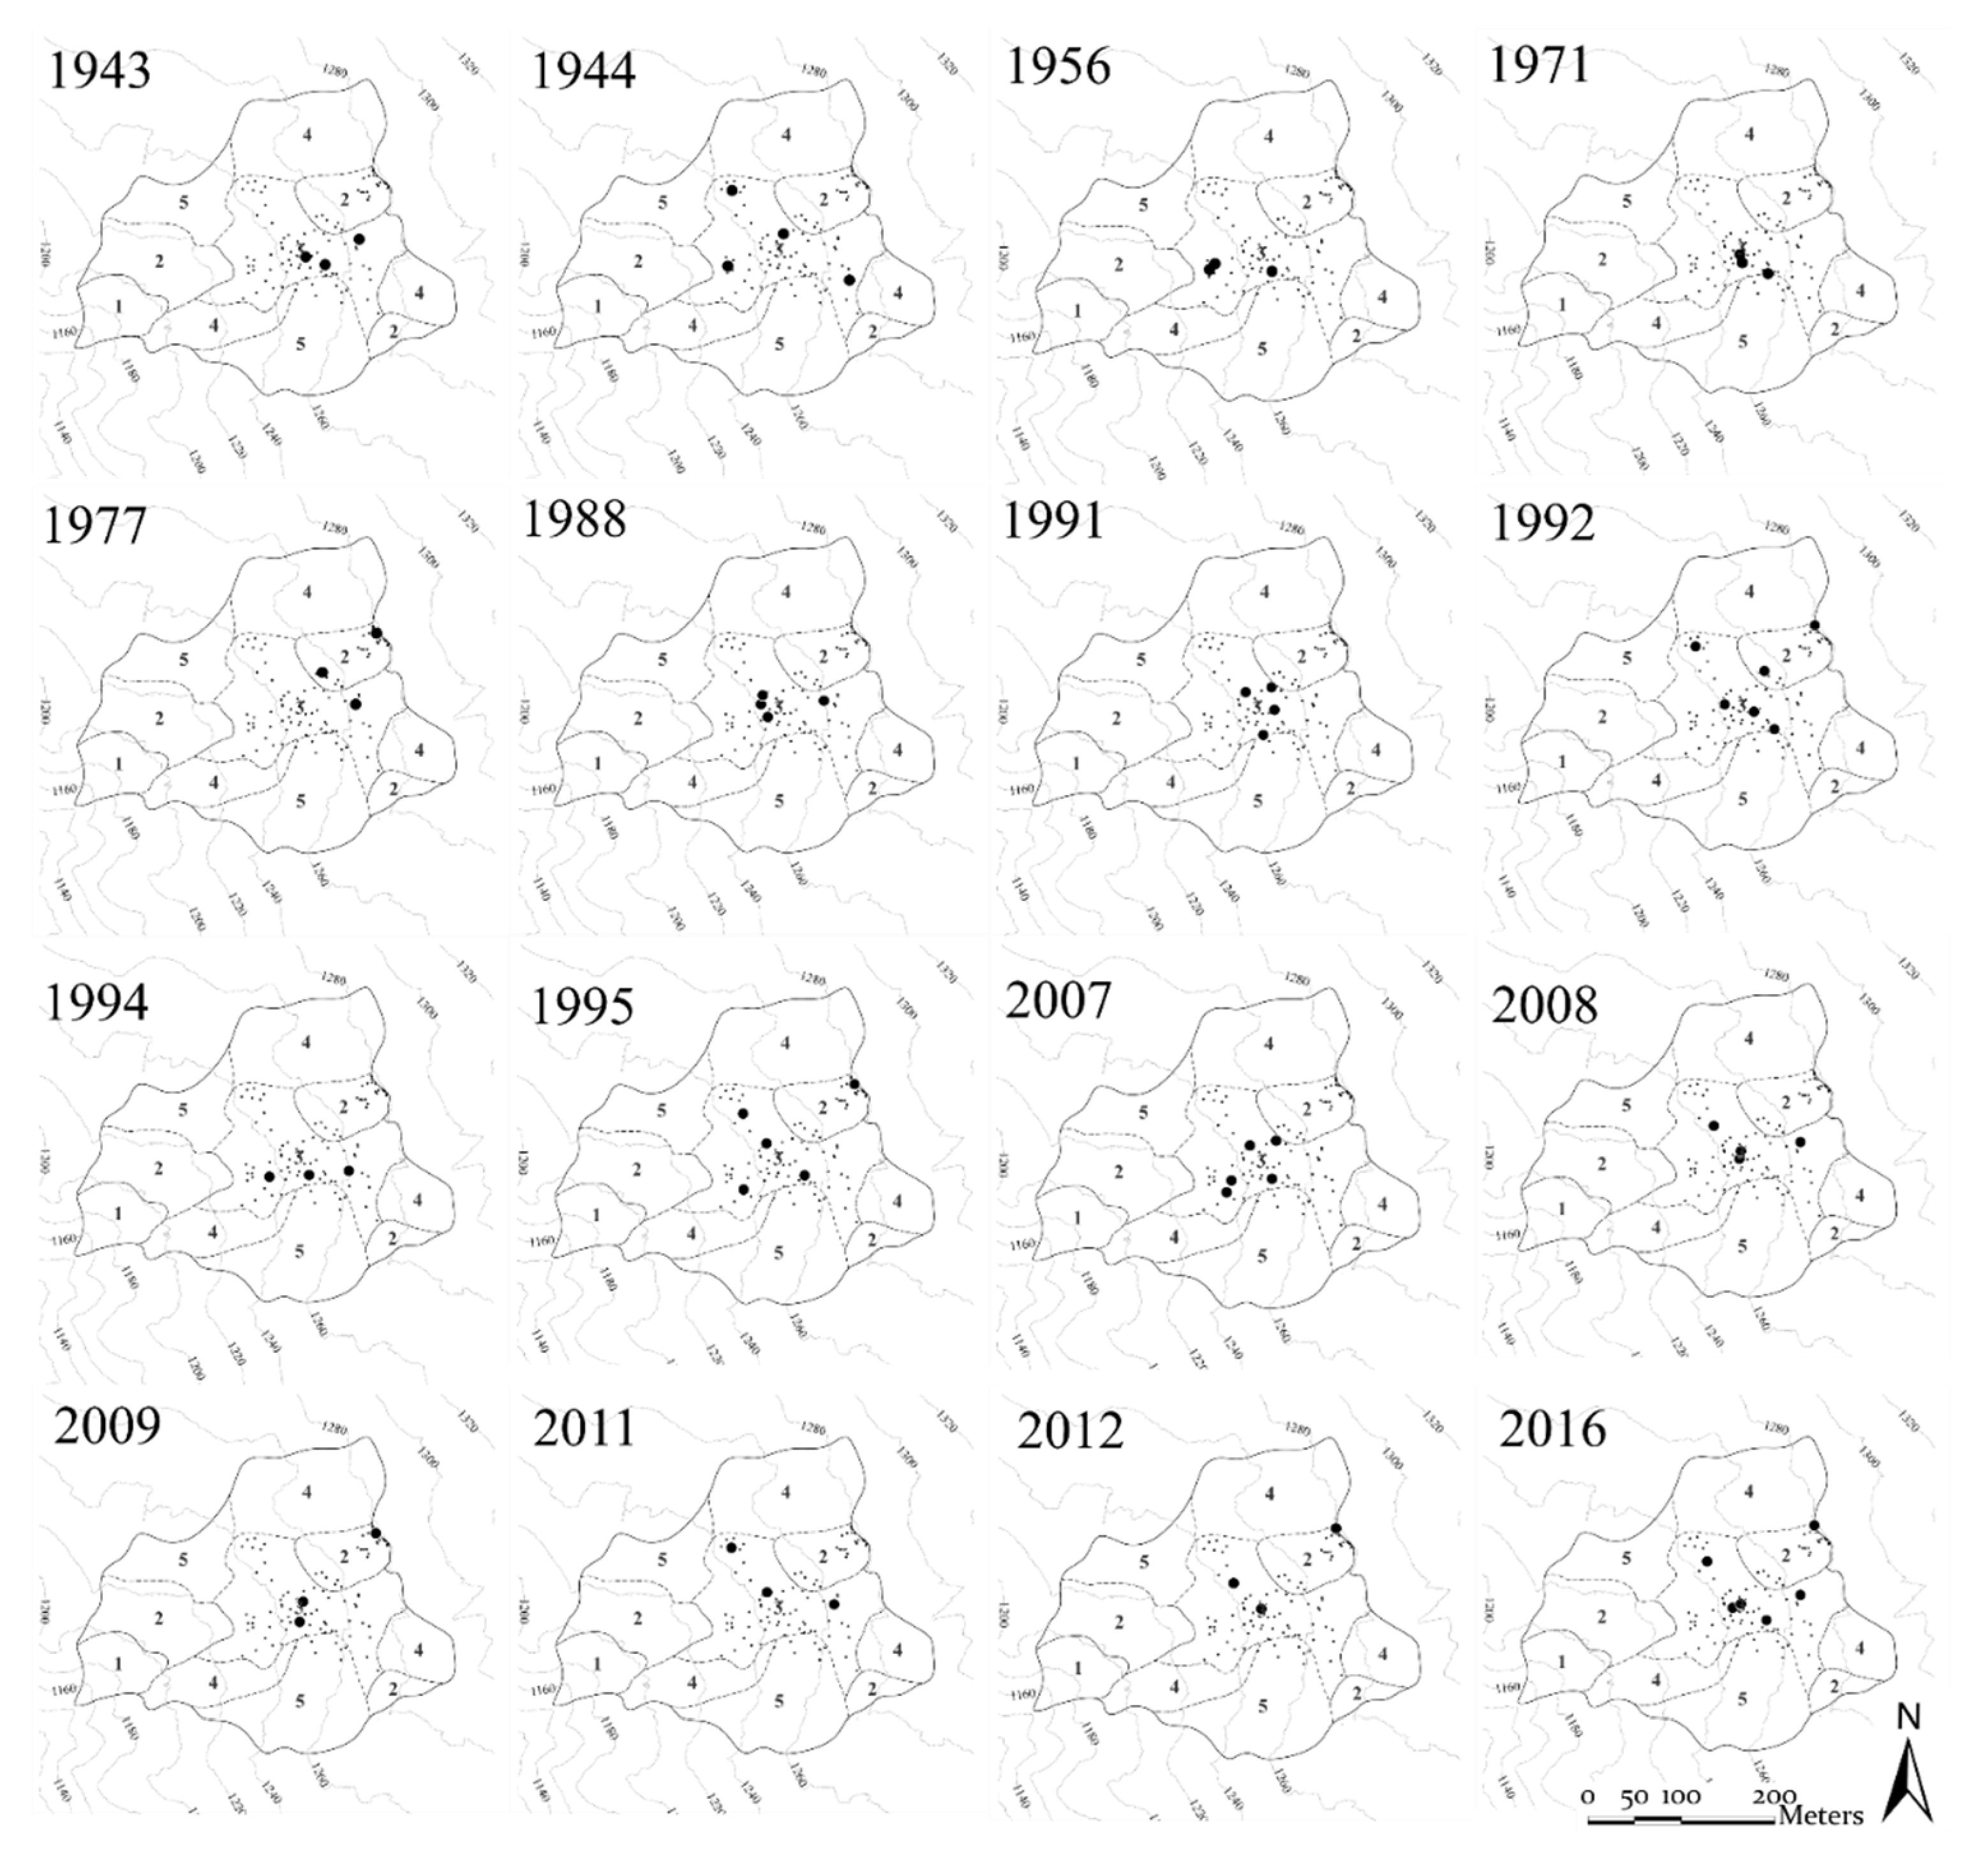
The extent of landslide activity is somewhat spatially limited, landslide reactivation events occurred locally, and no massive reactivation events were discovered. In the last 73 years, the extent and intensity of the landslide increased, especially from 1990 onwards (Figure 6). The greatest landslide activity can be observed in the third zone (in the central part), and these results seem to support the geological observation of the landslide, but not in its entirety. Since the first, second, and third zones with observed and measured higher movement velocities are located on the central landslide longitudinal axis, correlation with Ei values is possible.
3.3. Categories of Tree Tilting and Eccentricity Index
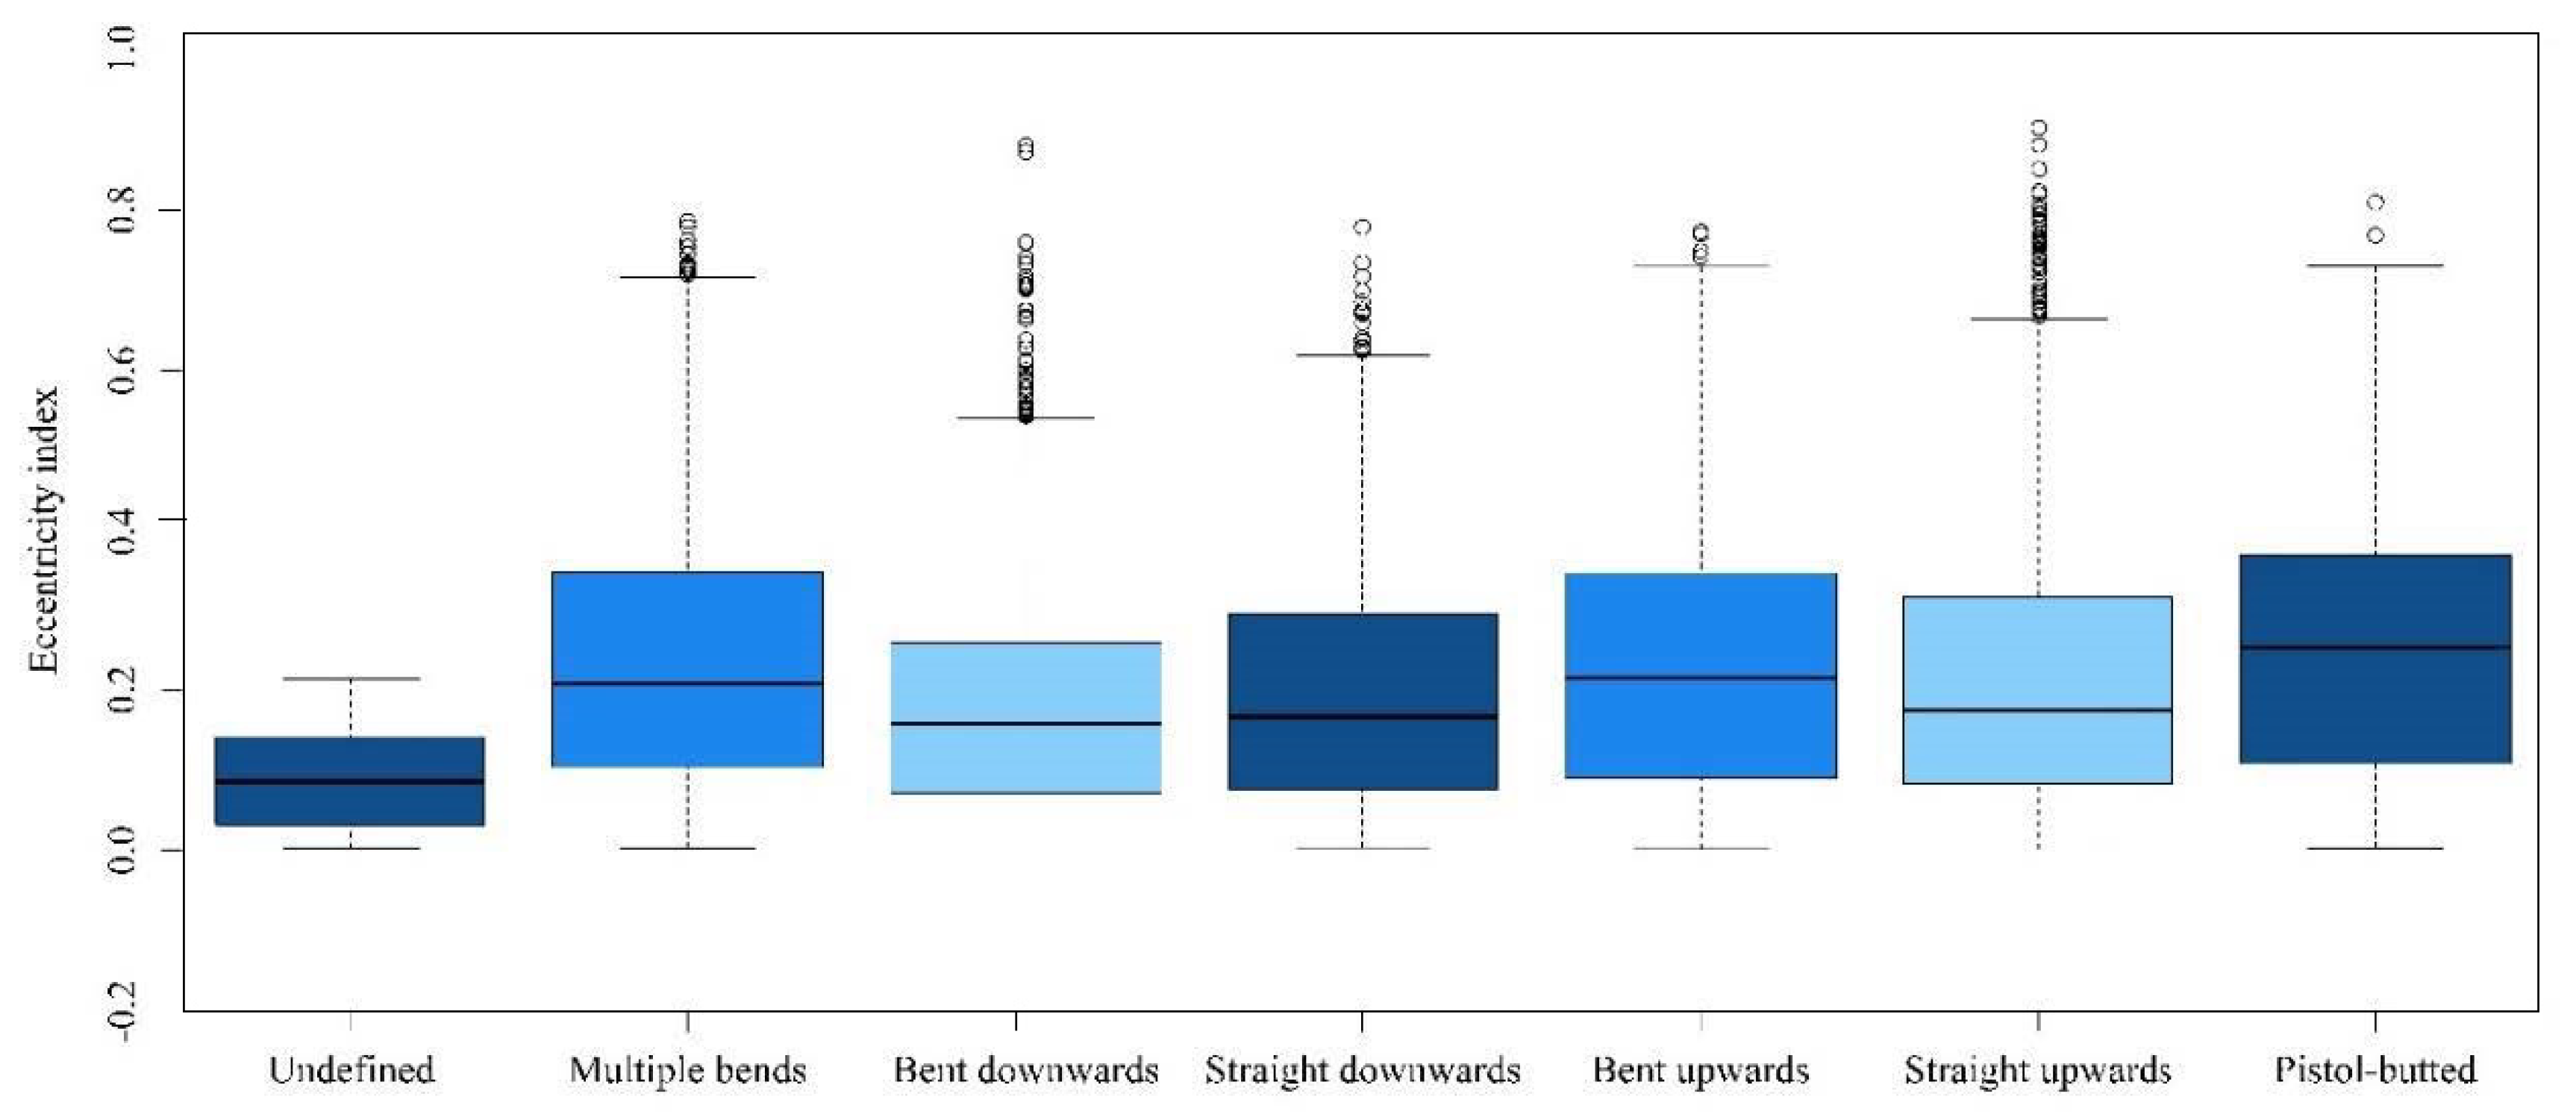
A comparison between Ei values was done for different categories of tree tilting for the period between 1880 and 2017 (Figure 7). The ‘multiple bends’ category of tree tilting has the highest median (median = 0.080), followed by ‘straight downwards’ (median = 0.076), ‘straight upwards’ (median = 0.043), ‘bent downwards’ (median = 0.011), ‘bent upwards’ (median = 0.006), and ‘undefined’ (median = −0.08). Homogeneity of variance was tested for all categories where we rejected the null hypothesis (p = 0.77). The Tukey HSD test showed that the mean values are statistically insignificant (p = 0.9).
3.4. Landslide Intensity by DTM Changes
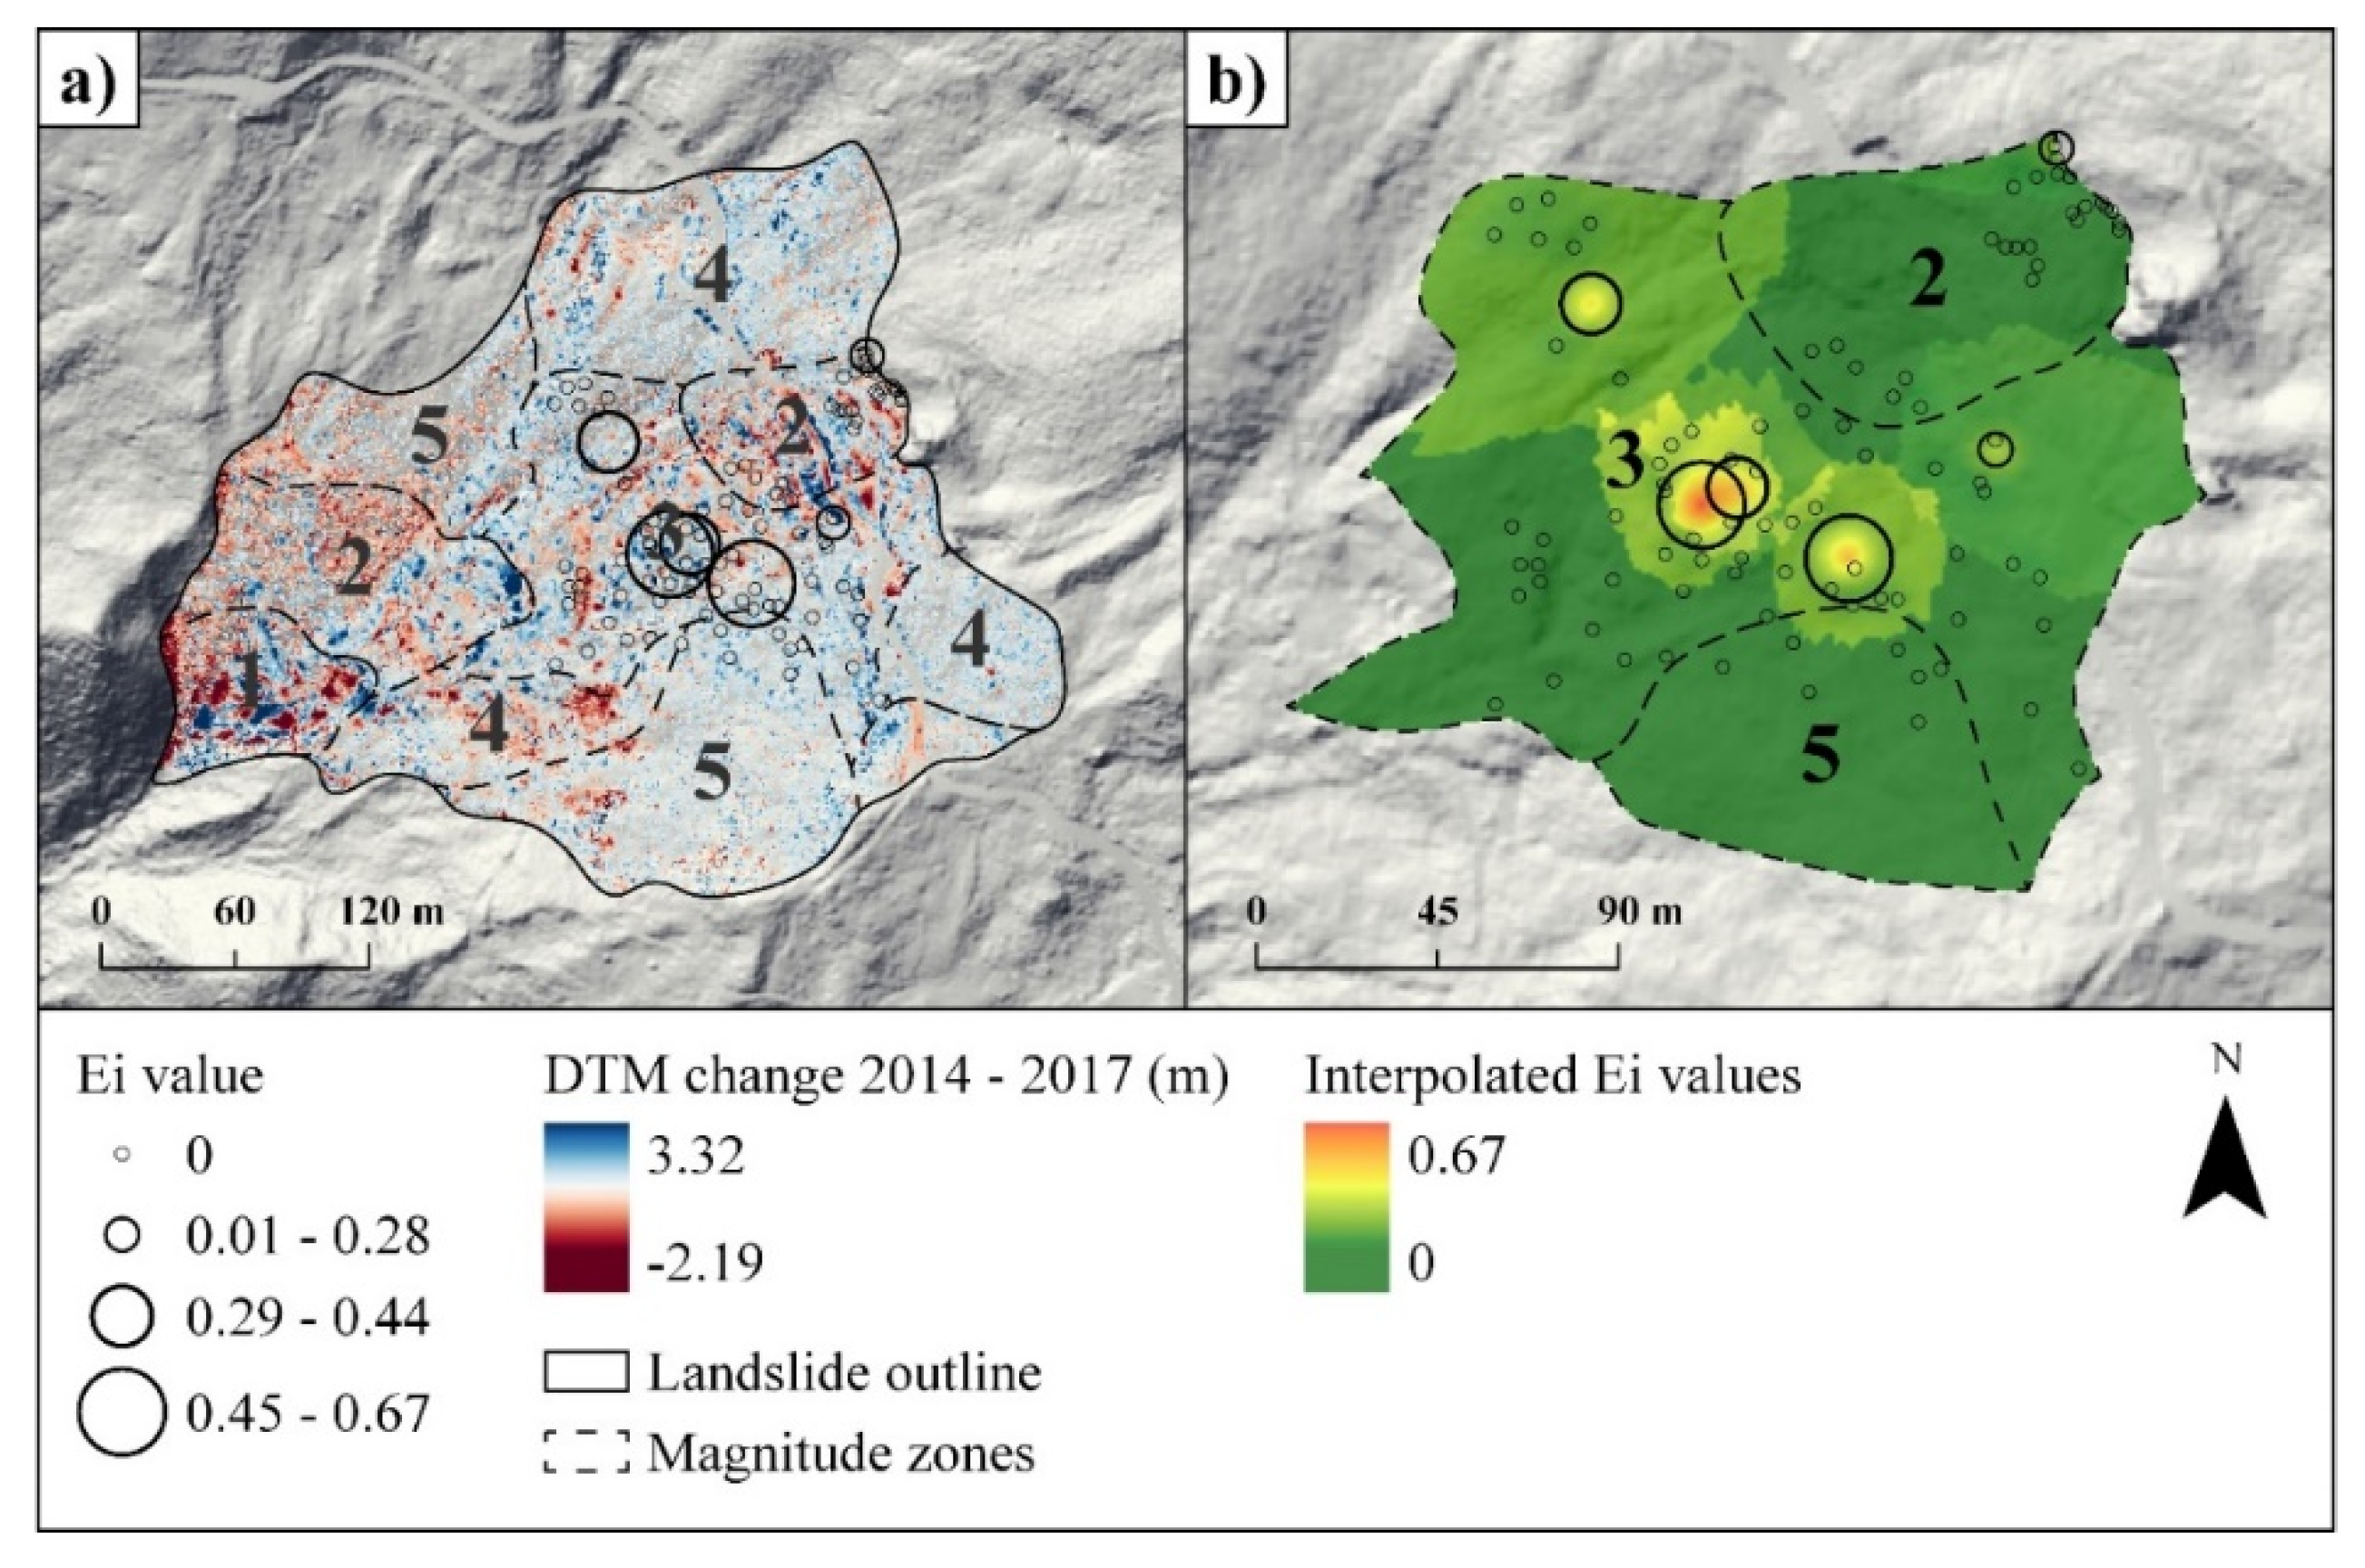
Based on changes in the DTM in the period between 2014 and 2017, we can detect the highest positive (3.32 m) and negative change (2.19 m) in materials in the SE area of the landslide, where the toe of the landslide is located. This area corresponds to the first zone. Within the zones with sampled trees, the highest DTM changes (−1.68 m, +1.06 m) were recorded in the third zone, where the average negative change was 0.135 m (SD ± 0.14 m) and average positive change was 0.1878 m (SD ± 0.168 m). Ei values were compared to changes in the DTM, which was clipped by the extent of spatial interpolation (Figure 8).
In the analysis of elevation change of landslide activity, no trend was discovered when comparing Ei values with values of material change (accumulation/loss) based on DTM change (Table 1), with respect to different buffer zones.
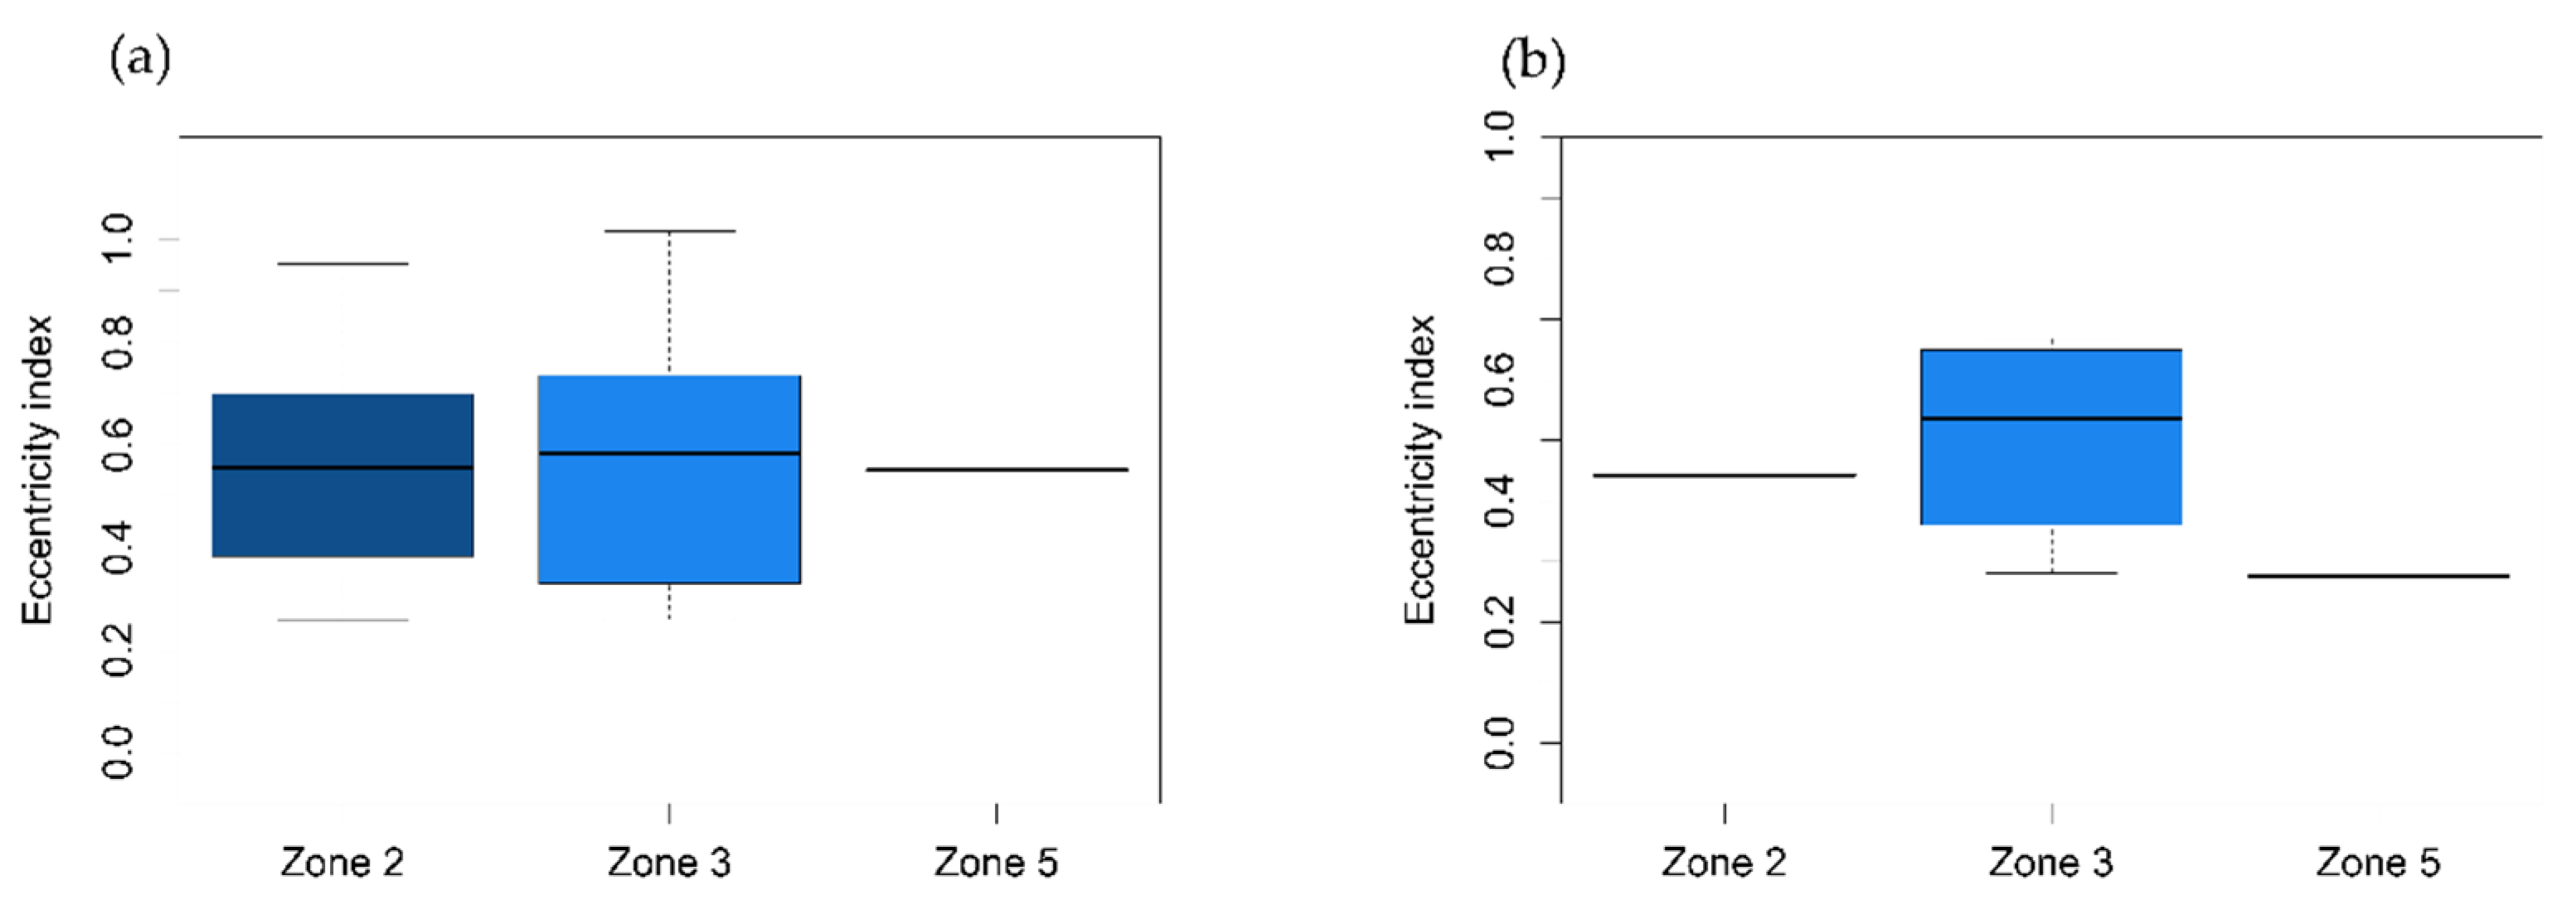
The statistical tests (Levene; p = 0.38 and Tukey’s HSD; p = 0.97) showed no correlation between variances of Ei values between zones for the 1943 to 2017 period. The third zone had the highest median values (median = 0.584, n = 23), followed by the second zone (median = 0.555, n = 13) and the third zone (median = 0.550, n = 1) (Figure 9a). Levene’s test (p = 0.18) and Tukey’s HSD test (p = 0.58) were used to prove that there are no statistical differences between the second, third, and fifth zones based on Ei values for the period between 2014 and 2016. The highest median Ei was in the third zone (median = 0.535, n = 4), followed by the second zone (median = 0.4425, n = 1) and the fifth zone (median = 0.276, n = 1) (Figure 9b). Because Ei values of only reactivation years were used, sample sizes differ and were too little for any relevant statistical analysis.
4. Discussion
In this paper, bent trees on an active landslide area were sampled in order to spatially and temporally reconstruct landslide activity. The main focus was to correlate tree ring eccentricity with landslide magnitude (change in the DTM) in different zones of the same landslide body. Firstly, we should comment on constraints regarding geological (magnitude) zonation of the Urbas landslide, which was based on field observations and in-situ measurements in the last few years [71,73,90]. Movements in each zone are only rough estimations, as the geological observations were not spatially distributed over the entire landslide surface and covered a relatively short time span.
4.1. Methodology for Landslide Reconstruction
In this paper, in order to detect landslide years, we used a fixed threshold value of It (”3%”) and GD (3). Consideration could be made about using different threshold values and the interpretation of lower threshold values (both It and GD). Firstly, if we were to apply higher threshold values, a great deal of signal would be lost, resulting in misinterpretation of landslide activity, especially if we account for the high proportion of low-intensity years with It index above 0 (Figure 4 and Figure 5). Secondly, as indicated in Figure 4, the abundance of years after 1940 with values of It and GD between 1 and 3 indicates either (a) constant movement of the landslide body with occasional higher or increased activity or (b) poor statistical representation, where threshold values of around 1 and 2 could be interpreted as no/missing landslide activity, and threshold values above 3 as landslide activity.
In this paper, the analysis of landslide movement focused on abrupt changes in eccentricity, although reaction wood, traumatic resin ducts or growth suppression analysis could also be applied [38,94,95]. However, dating landslide activity by analyzing reaction wood or growth reduction are considered to be less accurate than using eccentricity [52,53,95]. Therefore, the same authors advise against using reaction wood analysis due to the documented limitations. Compared to the macroscopic analysis of reaction wood, eccentricity signals provide more data on smaller events and can be considered as a more sensitive recorder of landslide activity [52]. Because reaction wood analysis is mainly based on macroscopic analysis, the approach is subjective and problems can therefore occur because of it’s non-measurable features [16]. Thus, reaction wood analysis should be applied only to confirm events, not to date them [96].
Uncertainty in application of eccentricity methods to analyzing landslide dynamics is eccentricity inertia. It occurs due to the fact that the growth of the tree rings is affected for a couple of years after landslide activity has ended (e.g., [69]). Multiple landslide reactivation events that result in formation of eccentricity inertia can lead to a problem of an overlapping signal (e.g., [18,19,52]), which occurs due to heterogeneous and long-lasting landslide movements where eccentric growth cannot fully follow the landslide activity. The new landslide induced growth anomaly can overlap the previous one which was not completely recorded in eccentric growth. Thus, changes in Ei are not recognized and cannot be related to a specific sliding event because the tree does not record any further tilting events if it is already under pronounced tilting pressure. This overlapping signal in the time series can lead to misinterpretation of dating landslide reactivation years [19]. Consequently, the application of eccentricity analysis for the reconstruction of landslide activity that shows overlapping signals is not entirely reliable [38,52,96] and can be considered as minimal (e.g., [1]). Our results might also indicate uncertainty regarding classifying landslide years because in the years that were recognized as GD, eccentricity on average lasted 6.5 years. Events of weak intensity have the longest duration (15.7 years on average). The duration of signals could reflect landslide dynamics (e.g., slow-motion slip or creeping), where low intensity and high-frequency events cause signal overlapping [97]. This also indicates that in the reconstruction of Urbas landslide activity, based on the eccentricity signal the prevailing type of geomorphic process was creeping and not landsliding. Inducing noise in the eccentricity signal can be due to root system morphology of P. abies, which seems to be more sensitive to record soil creeping [97]. By selection of higher values of It index, noise can be filtered out, although often on account of not dating true events [97].
Overlapping signal and eccentricity inertia indicate that a great deal of noise was included in the dendrogeomorphologic records. In order to avoid misinterpretation of events on account of an overlapping signal, some authors [18,52] advise the application of the method used in this article for extracting landslide years only for landslides with rather low frequency and magnitude, and the use of greater sample depth [19]. Further insights into the problem of overlapping signal and inertia could also be made possible by a new signal extraction method where moderate to high changes in eccentricity value would also be acknowledged [53].
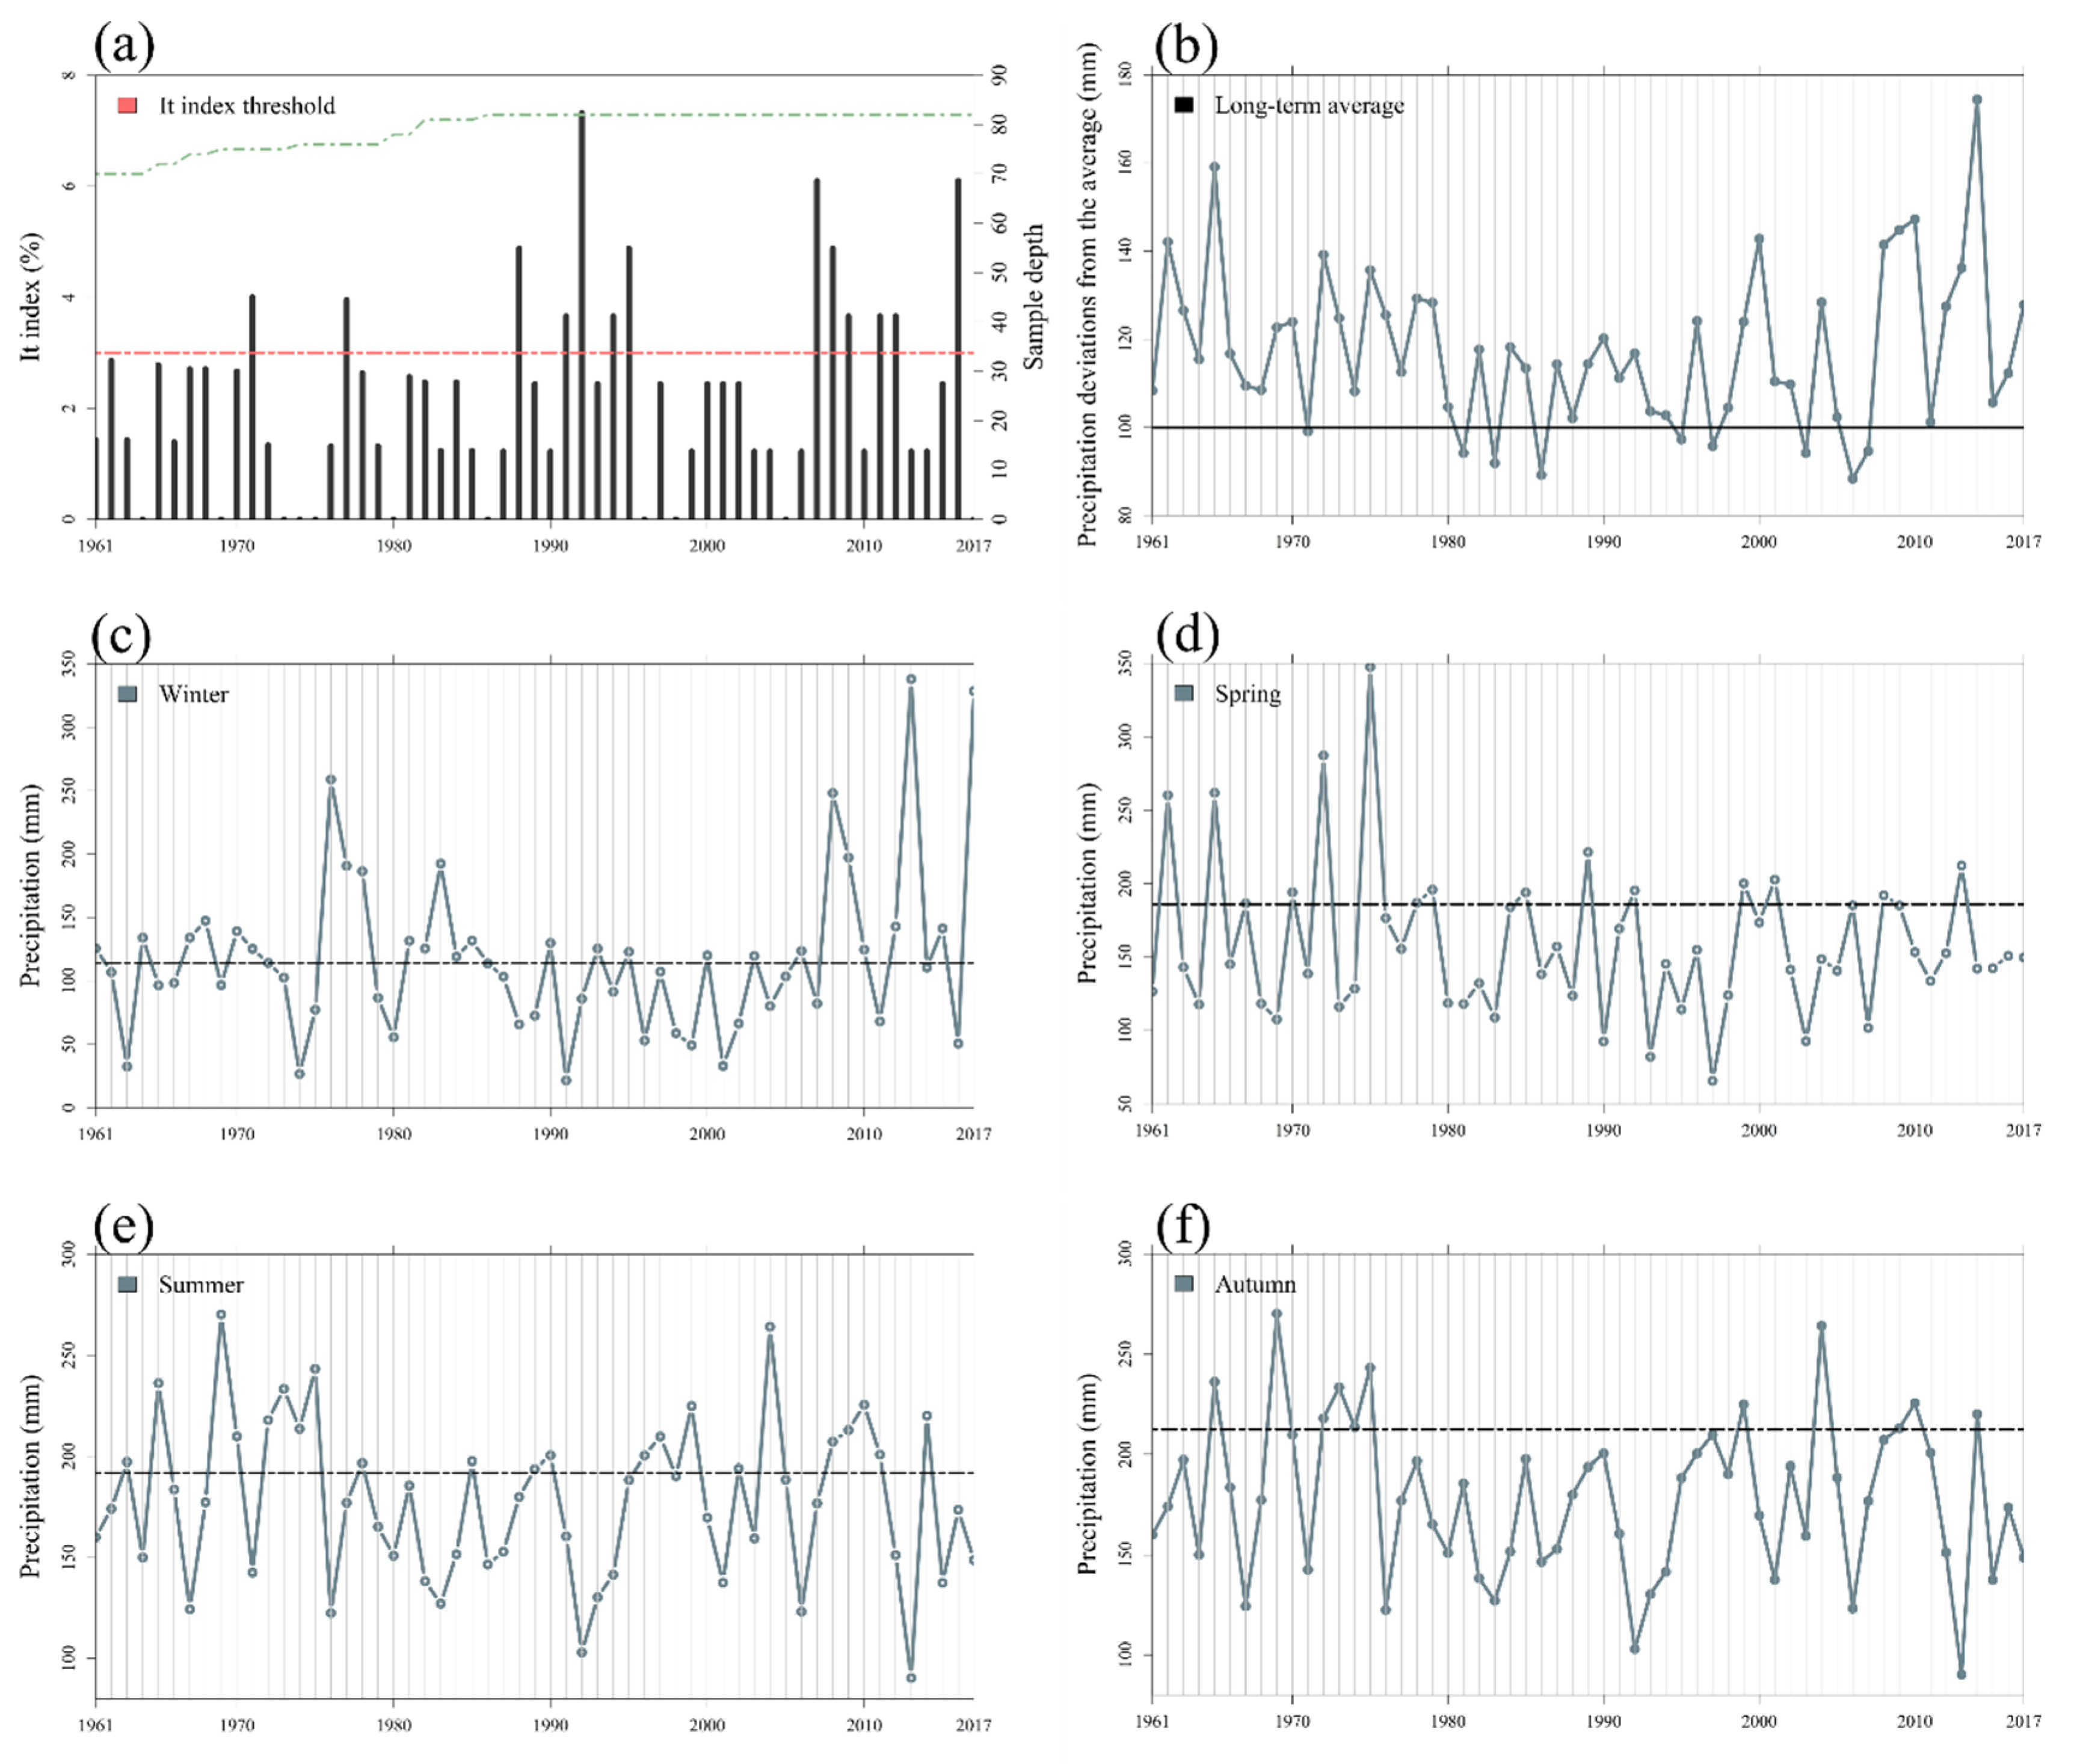
Assuming an association between creeping movements and precipitation (Figure 10), the influence of precipitation on creeping can be observed in years 1970 (summer and autumn precipitation), 1976 (spring and winter precipitation), 2010 (winter and summer precipitation), and 2015 (winter precipitation). Although the relationship between increased precipitation records and onset of growth disturbances can be observed in some years, no positive correlation can be observed for all the years where It index indicated landslide activity (Figure 10).
4.2. Landslide Activity Within Zones
Based on eccentricity analysis, the greatest landslide intensity was observed in the central part—Zone 3. Despite the fact that zones of different landslide intensity have been distinguished based on geological observations and measurements in the last decade, trees showed no statistically significant distinction between these zones with respect to Ei. The results of spatial interpolation indicate that trees in the third zone experience similar or even greater physical stress than trees in the second zone. This is probably related to small differences between landslide activity in the second and third zone or continuous sliding intensity transitions between zones. The sampling of trees was not done in Zone 1 since it is not forested due to the erosion processes, but it would otherwise be especially favorable given that the highest landslide magnitude was measured in this area in previous studies [71,73].
Trees also showed no statistically significant differences in Ei between these zones in the shorter observation period (2014–2017). The mismatch between Ei and the DTM could be attributed to the missing eccentricity data because in order to determine the landslide year, two subsequent ring widths measurements are necessary to calculate the Ei value. Therefore, we weren’t able to determine landslide reactivation events for years 2016 and 2017 with this methodology. Another limitation was the inaccuracy of the GNSS receiver under the tree canopy, as the collected location of a single tree could be off by more than a meter. Another explanation for the similarity in Ei between magnitude zones could be attributed to a combination of the deep-seated character of the landslide (around 15 m) [71,72,73,74] and the plate-root system of P. abies. The plate-root system is typically shallow and was observed to record less GD compared to the heart-root system, which is typically deeper and expected to suffer more damage because it reaches the slip surface after landslide initiation [85]. This could also be the reason why no relationship between the DTM change in buffer zones and Ei index was found (Table 1).
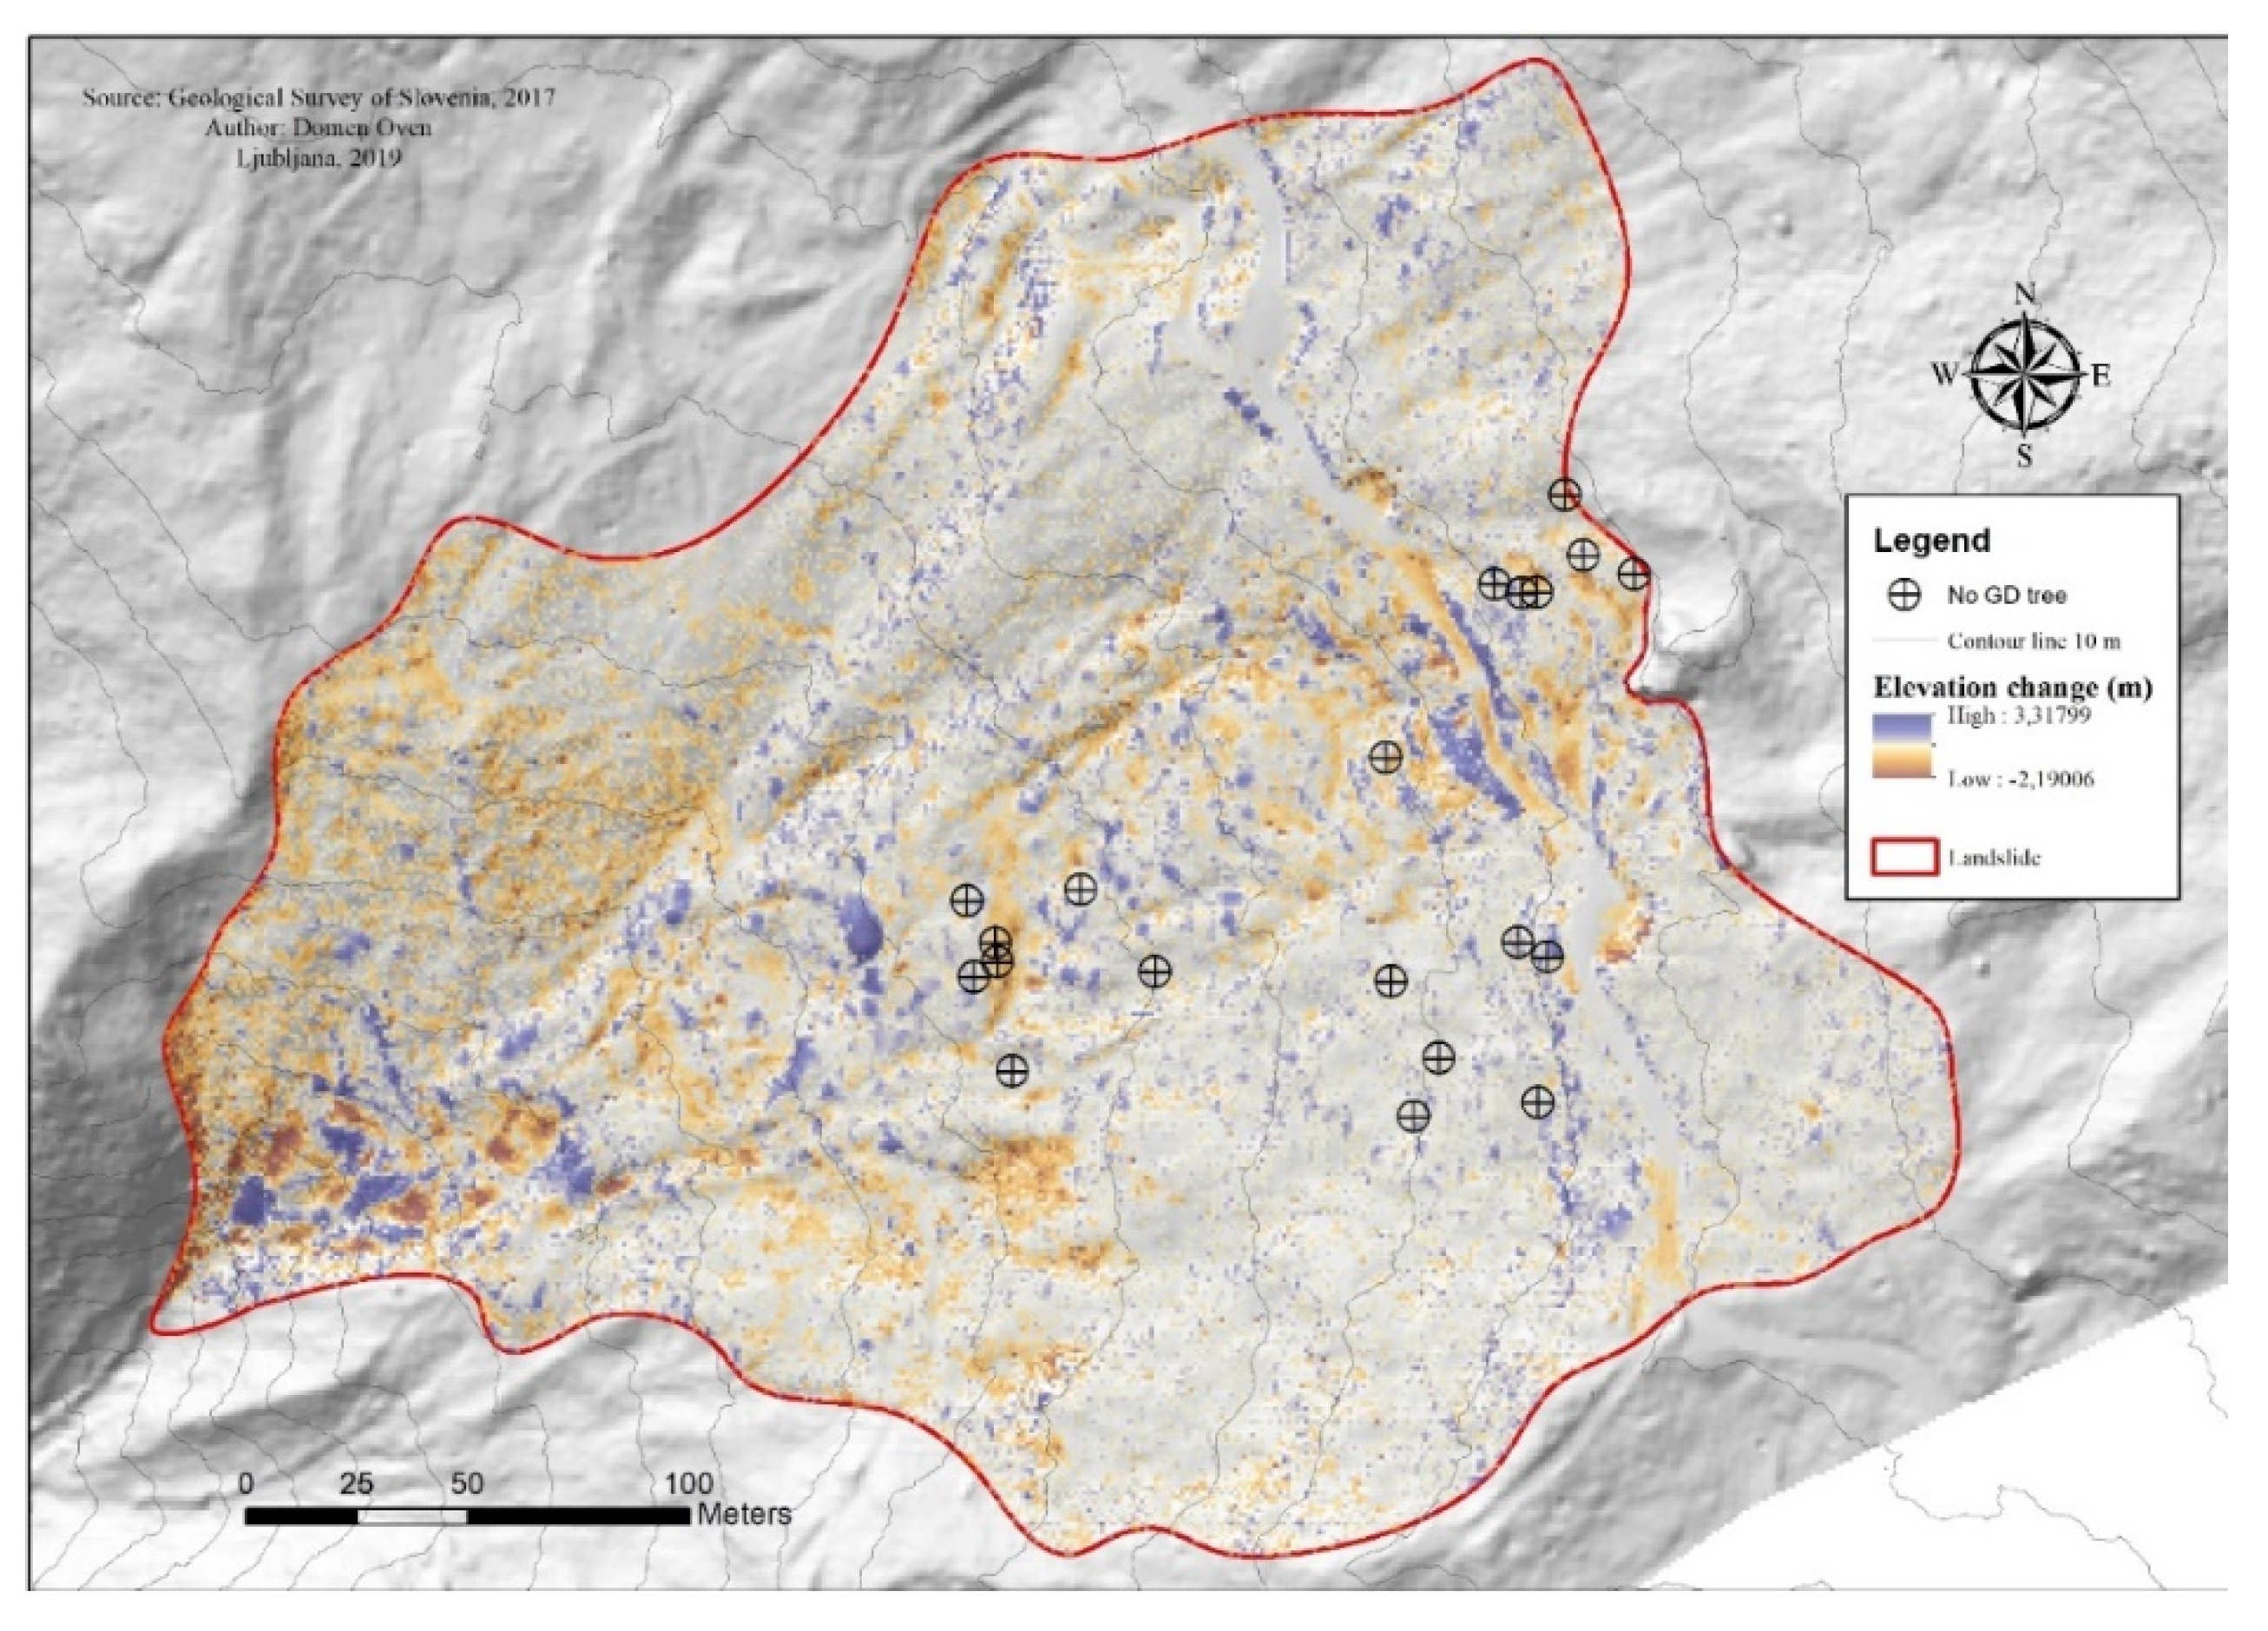
It is also possible that a tree will not record a landslide signal at all. In dendrogeomorphology, there is considerable discussion regarding the selection of appropriate trees for sampling in terms of location, age, DBH, tree species, and damage (e.g., [36,77]). [19,53] recognized the relationship between tree age and tree species and its ability to record a landslide signal. It was documented that P. abies’s ability to record a landslide signal usually drops between the 9th and 10th decade of age [95]. In the case of the Urbas landslide, it is possible that trees did not record a landslide signal due to their age. Furthermore, it is also possible that there was sampling error because almost a quarter (20) of the trees did not record a GD, although they were located in zones where landslide magnitude was presumably the highest (Figure 11), or that geological zonation is even more complicated. Hence, it can be concluded that in our case, a portion of the landslide signal was probably lost.
Although no correlation between the DTM and Ei was found, further studies on this aspect could be done on a larger sample size which includes different tree species using a more precise GNSS receiver and multitemporal DTMs. In the case of this study, the time span of the two consecutive lidar measurements (2014 and 2017) was also short, and the data acquisition accuracy of both scanning missions was not the same. Therefore, we were not able to directly compare DTM changes in detail.
4.3. Tree Trunk Categorization in Relation to the DTM and Ei
Our results indicate that there are no statistical differences between Ei and different categories of trunk shape (Figure 7). The possible relation between categories of stem inclination and Ei could be further investigated by analyzing cores from multiple directions and comparing Ei in their respective directions. Categories of tree tilting could be linked to DTM change, where the relationship between elevation change and the direction of tree tilting could be analyzed. Furthermore, the degree of tree inclination and variation between tree species could also be included [85]. Finally, the direction and degree of tree inclination could be linked to specific landslide geomorphology (scarps, ridges, and fissures), possibly indicating landslide dynamics [91]. In our case, the link between landslide dynamics and tree trunk bending was already observed in the field because in the upper parts of the landslide (Zone 2 and upper part of Zone 3), a greater number of bends was observed (category ‘pistol-butted’,‘s-shaped’), and trees categorized as ‘bent downwards’ were predominately found in the lower part of the third zone.
5. Conclusions
In conclusion, based on our dendrogeomorphical study, relatively weak landslide activity of the Urbas landslide can be observed. Landslide intensity has nonetheless been increasing since 1940, especially in the central part of the landslide. Although geological and remote sensing measurements done in the past years indicate various intensities in different parts of the landslide, presented eccentricity analysis cannot confirm these results, or it is not a suitable tool for landslide zonation. This is most probably related to the inability of a tree to record minor landslide reactivations or the deep-seated nature of the landslide which could move the entire tree and root system without tilting. Despite the fact that no correlation was found between elevation change in the digital terrain model (DTM) and Ei of trees in the same location, further investigation should yield better insights, especially given the limited capacity of the case-specific study. In future research, the coupling of direct (DTM) and indirect (dendrogeomorphology) measurements could provide better insights by enabling the analysis of landslides of greater magnitude variability; by including other growth disturbances, greater sample depth, and species variability; and by providing comparable spatial resolution data from longer time intervals.
Author Contributions
Conceptualization, M.K. and J.J.; methodology, D.O., T.L., J.J. and M.K.; investigation, D.O., T.L., J.J. and M.K.; resources, T.L., J.J. and M.K.; data curation, D.O.; writing—original draft preparation, D.O.; writing—review and editing, D.O., T.L., J.J. and M.K.; visualization, D.O.; supervision, M.K.; funding acquisition, M.K.
Funding
The study was supported by the Interreg Alpine Space project GreenRisk4ALPs (ASP 635) and by the Slovenian Research Agency (J1-8153 project).
Acknowledgments
The first author would like to thank the Pahernik foundation for financial support. We thank anonymous reviewers for helpful comments that improved the original manuscript.
Conflicts of Interest
The authors declare no conflict of interest. The funders had no role in the design of the study; in the collection, analyses, or interpretation of data; in the writing of the manuscript, or in the decision to publish the results.
References
- Stoffel, M.; Bollschweiler, M. Tree-ring analysis in natural hazards research—An overview. Nat. Hazards Earth Syst. Sci. 2008, 8, 187–202. [Google Scholar] [CrossRef]
- Owczarek, P. Dendrogeomorphological potential of Salicaceae from SW Spitsbergen, Svalbard. In TRACE—Tree Rings in Archaeology, Climatology and Ecology; Kaczka, R., Malik, I., Owczarek, P., Gärtner, H., Helle, G., Heinrich, I., Eds.; GFZ German Research Centre for Geosciences: Potsdam, Germany, 2009; Volume 7, pp. 181–186. [Google Scholar]
- Owczarek, P.; Latocha, A.; Wistuba, M.; Malik, I. Reconstruction of modern debris flow activity in the arctic environment with the use of dwarf shrubs (south-western Spitsbergen)—A new dendrochronological approach. Zeitschrift fur Geomorphol. 2013, 57, 75–95. [Google Scholar] [CrossRef]
- Heinrich, C.; Stewart, A.K.; Hubbard, T.D. Dendrogeomorphic Evidence of Frequent Mass Wasting from Reaction Wood in Black Spruce, Northway Jct., Alaskan Interior; Geological Society of America: Boulder, CO, USA, 2014. [Google Scholar]
- Stewart, A.K.; Heinrich, C.E.; Hubbard, T.D. Dendrogeomorphic Evidence of Frequent Mass Movement Using Reaction Wood in Black Spruce. Alaska Highway Milepost 1267, Northway Junction, Alaska: Alaska Division of Geological & Geophysical Surveys Report of Investigation 2017-7, 18 p. Available online: http://dggs.alaska.gov/webpubs/dggs/ri/text/ri2017_007.pdf (accessed on 11 November 2019).
- Carrara, P.E. Movement of a Large Landslide Block Dated by Tree-Ring Analysis, Tower Falls Area, Yellowstone National Park, Wyoming; US Geological Survey: Reston, VA, USA, 2007; pp. 43–49.
- Carrara, P.; O’Neill, J.M. Tree-ring dated landslide movements and their relationship to seismic events in southwestern Montana, USA. Quat. Res. 2003, 59, 25–35. [Google Scholar] [CrossRef]
- Reardon, B.A.; Pederson, G.T.; Caruso, C.J.; Fagre, D.B. Spatial reconstructions and comparisons of historic snow avalanche frequency and extent using tree rings in Glacier National Park, Montana, USA. Arct. Antarct. Alp. Res. 2008, 40, 148–160. [Google Scholar] [CrossRef]
- Butler, D.R.; Sawyer, C.F.; Maas, J.A. Tree-ring dating of snow avalanches in Glacier National Park, Montana, USA. In Tree Rings and Natural Hazards: A State-of-the-Art; Advances in Global Change Research; Stoffel, M., Bollschweiler, M., Butler, D.R., Luckman, B.H., Eds.; Springer: Dordrecht, The Netherlands, 2010; Volume 41, pp. 35–46. [Google Scholar]
- Casteller, A.; Villalba, R.; Araneo, D.; Stöckli, V. Reconstructing temporal patterns of snow avalanches at Lago del Desierto, southern Patagonian Andes. Cold Reg. Sci. Technol. 2011, 67, 68–78. [Google Scholar] [CrossRef]
- Casteller, A.; Häfelfinger, T.; Cortés Donoso, E.; Podvin, K.; Kulakowski, D.; Bebi, P. Assessing the interaction between mountain forests and snow avalanches at Nevados de Chillán, Chile and its implications for ecosystem-based disaster risk reduction. Nat. Hazards Earth Syst. Sci. 2018, 18, 1173–1186. [Google Scholar] [CrossRef]
- Stoffel, M.; Casteller, A.; Luckman, B.H.; Villalba, R. (2012)—Spatiotemporal analysis of channel wall erosion in ephemeral torrents using tree roots—An example from the Patagonian Andes. Geology 2012, 40, 247–250. [Google Scholar] [CrossRef]
- Malik, I.; Wistuba, M. Dendrochronological methods for reconstructing mass movements -an example of landslide activity analysis using tree-ring eccentricity. Geochronometria 2012, 39, 180–196. [Google Scholar] [CrossRef]
- Wistuba, M.; Malik, I.; Gärtner, H.; Kojs, P.; Owczarek, P. Application of eccentric growth of trees as a tool for landslide analyses: The example of Picea abies Karst. in the Carpathian and Sudeten Mountains (Central Europe). Catena 2013, 111, 41–55. [Google Scholar] [CrossRef]
- Łuszczyńska, K.; Wistuba, M.; Malik, I. Dendrochronology as a s source of data for landslide activity maps—An example from Beskid Żywiecki Mountains (Western Carpathians, Poland). Environ. Socio-econ. Stud. 2017, 5, 40–46. [Google Scholar]
- Łuszczyńska, K.; Wistuba, M.; Malik, I.; Krąpiec, M.; Szypuła, B. Dendrochronological dating as the basis for developing a landslide hazard map—An example from the Western Carpathians, Poland. Geochronometria 2018, 45, 173–184. [Google Scholar] [CrossRef]
- Wistuba, M.; Malik, I.; Krapiec, M. Can we distinguish between tree-ring eccentricity developed as a result of landsliding and prevailing winds? Consequences for dendrochronological dating. Geochronometria 2018, 45, 223–234. [Google Scholar] [CrossRef]
- Šilhán, K.; Pánek, T.; Turský, O.; Brázdil, R.; Klimeš, J.; Kašičková, L. Spatio-temporal patterns of recurrent slope instabilities affecting undercut slopes in flysch: A dendrogeomorphic approach using broad-leaved trees. Geomorphology 2014, 213, 240–254. [Google Scholar] [CrossRef]
- Šilhán, K.; Tichavský, R.; Škarpich, V.; Břežný, M.; Stoffel, M. Regional, tree-ring based chronology of landslides in the Outer Western Carpathians. Geomorphology 2018, 321, 33–44. [Google Scholar] [CrossRef]
- Zielonka, T.; Holeksa, J.; Ciapała, S. A reconstruction of flood events using scarred trees in the Tatra Mountains, Poland. Dendrochronologia 2008, 26, 173–183. [Google Scholar] [CrossRef]
- Malik, I. Dating of small gully formation and establishing erosion rates in old gullies under forest by means of anatomical changes in exposed tree roots (Southern Poland). Geomorphology 2008, 93, 421–436. [Google Scholar] [CrossRef]
- Malik, I.; Owczarek, P. Dendrochronological records of debris flow and avalanche activity in a mid-mountain forest zone (Eastern Sudetes-Central Europe). Geochronometria 2009, 34, 57–66. [Google Scholar] [CrossRef]
- Malik, I.; Wistuba, M.; Migoń, P.; Fajer, M. Activity of Slow-Moving Landslides Recorded in Eccentric Tree Rings of Norway Spruce Trees (Picea abies Karst.)—An Example from the Kamienne MTS. (Sudetes MTS., Central Europe). Geochronometria 2016, 43, 24–37. [Google Scholar] [CrossRef]
- Pérez-Rodríguez, R.; Marques, M.J.; Bienes, R. Use of dendrochronological method in Pinus halepensis to estimate the soil erosion in the South East of Madrid (Spain). Sci. Total Environ. 2007, 378, 156–160. [Google Scholar] [CrossRef] [PubMed]
- Rovéra, G.; Lopez Saez, J.; Corona, C.; Stoffel, M.; Berger, F. Preliminary quantification of the erosion of sandy-gravelly cliffs on the island of Porquerolles (Provence, France) through dendrogeomorphology, using exposed roots of Aleppo pine (Pinus halepensis Mill.). Geografia Fisica e Dinamica Quaternaria 2013, 36, 181–187. [Google Scholar]
- Corona, C.; Georges, R.; Lopez Saez, J.; Stoffel, M.; Perfettini, P. Spatio-temporal reconstruction of snow avalanche activity using tree rings: Pierres Jean Jeanne avalanche talus, Massif de l’Oisans, France. Catena 2010, 83, 107–118. [Google Scholar]
- Corona, C.; Lopez Saez, J.; Stoffel, M.; Bonnefoy, M.; Richard, D.; Astrade, L.; Berger, F. How much of the real avalanche activity can be captured with tree rings? An evaluation of classic dendrogeomorphic approaches and comparison with historical archives. Cold Reg. Sci. Technol. 2012, 74–75, 31–42. [Google Scholar] [CrossRef]
- Šilhán, K.; Tichavský, R. Snow avalanche and debris flow activity in the High Tatras Mountains: New data from using dendrogeomorphic survey. Cold Reg. Sci. Technol. 2017, 134, 45–53. [Google Scholar] [CrossRef]
- Stoffel, M.; Schneuwly, D.M.; Bollschweiler, M.; Lièvre, I.; Delaloye, R.; Myint, M.; Monbaron, M. Analyzing rockfall activity (1600–2002) in a protection forest—A case study using dendrogeomorphology. Geomorphology 2005, 68, 224–241. [Google Scholar] [CrossRef]
- Stoffel, M.; Perret, S. Reconstructing past rockfall activity with tree rings: Some methodological considerations. Dendrochronologia 2006, 24, 1–15. [Google Scholar] [CrossRef]
- Trappmann, D.; Corona, C.; Stoffel, M. Rolling stones and tree rings: A state of research on dendrogeomorphic reconstructions of rockfall. Prog. Phys. Geogr. 2013, 37, 701–716. [Google Scholar] [CrossRef]
- Stoffel, M.; Bollschweiler, M.; Leutwiler, A.; Aeby, P. Tree-ring reconstruction of debris-flow events leading to overbank sedimentation on the illgraben cone (Valais Alps, Switzerland). Open Geol. J. 2008, 2, 18–29. [Google Scholar] [CrossRef] [Green Version]
- Stoffel, M.; Bollschweiler, M. Rainfall characteristics for periglacial debris flows in the Swiss Alps: Past incidences—potential future evolutions. Clim. Chang. 2011, 105, 263–280. [Google Scholar] [CrossRef]
- Lopez Saez, J.Ô.; Corona, C.; Stoffel, M.; Berger, F. High-resolution fingerprints of past landsliding and spatially explicit, probabilistic assessment of future reactivations: Aiguettes landslide, Southeastern French Alps. Tectonophysics 2013, 602, 355–369. [Google Scholar] [CrossRef]
- Lopez-Saez, J.; Berger, F.; Corona, C.; Schlunegger, F.; Bommer-Denns, B.; Morel, P.; Stoffel, M. Tree-ring reconstruction of reactivation phases of the Schimbrig landslide (Swiss Alps) Reconstitution des phases de réactivation du glissement de terrain de Schimbrig (Alpes suisses) au moyen d’une approche dendrogéomorphologique. Géomorphologie Reli. Process. Environ. 2017, 23, 265–276. [Google Scholar] [CrossRef] [Green Version]
- Corona, C.; Lopez Saez, J.; Stoffel, M. Defining optimal sample size, sampling design and thresholds for dendrogeomorphic landslide reconstructions. Quat. Geochronol. 2014, 22, 72–84. [Google Scholar] [CrossRef]
- Lopez Saez, J.Ô.; Berger, F.; Corona, C. Assessment of forested shallow landslide movements coupling tree ring records from stems and exposed root. Geomorphologie 2014, 20, 159–174. [Google Scholar] [CrossRef] [Green Version]
- Lopez Saez, J.; Corona, C.; Stoffel, M.; Schoeneich, P.; Berger, F. Probability maps of landslide reactivation derived from tree-ring records: Pra Bellon landslide, southern French Alps. Geomorphology 2012, 138, 189–202. [Google Scholar] [CrossRef]
- Keck, J.; Hsiao, C.Y.; Lin, B.S.; Chan, M.H.; Wright, W. Spatiotemporal landslide activity derived from tree-rings: The Tieliku Mingsui Landslide, Northern Taiwan. J. Chin. Soil Water Conserv. 2014, 45, 36–48. [Google Scholar]
- Malik, I.; Wistuba, M.; Tie, Y.; Owczarek, P.; Woskowicz-Ślęzak, B.; Łuszczyńska, K. Mass movements of differing magnitude and frequency in a developing high-mountain area of the Moxi basin, Hengduan Mts, China—A hazard assessment. Appl. Geogr. 2017, 87, 54–65. [Google Scholar] [CrossRef]
- Statistical Office of the Republic of Slovenia. Estimated Damage Caused by Natural Disasters, Slovenia, Annually SI-STAT Data Portal, Statistical Office of Republic of Slovenia. 2014. Available online: https://pxweb.stat.si/pxweb/Database/Environment/27_environment/05_disasters/27089_estimated_damage/27089_estimated_damage.asp (accessed on 15 May 2014).
- Haque, U.; Blum, P.; da Silva, P.F.; Andersen, P.; Pilz, J.; Chalov, S.R.; Malet, J.P.; Auflič, M.J.; Andres, N.; Poyiadji, E.; et al. Fatal landslides in Europe. Landslides 2016, 13, 1545–1554. [Google Scholar] [CrossRef]
- Statista. Available online: https://www.statista.com/statistics/267837/economic-damage-caused-by-mudslides/ (accessed on 13 August 2019).
- Guzzetti, F.; Cardinali, M.; Reichenbach, P. The AVI project, a bibliographical and archive inventory of landslides and floods in Italy. Environ. Manag. 1994, 18, 623–633. [Google Scholar] [CrossRef]
- Ibsen, M.L.; Brundsen, D. The nature, use and problems of historical archives for the temporal occurrence of landslides, with specific reference to the south coast of Britain, Ventor, Isle of Wight. Geomorphology 1996, 15, 241–258. [Google Scholar] [CrossRef]
- Carrara, A.; Crosta, G.; Frattini, P. Geomorphological and historical data in assessing landslide hazard. Earth Surf. Process. Landforms 2003, 28, 1125–1142. [Google Scholar] [CrossRef]
- Corominas, J.; Moya, J. Contribution of dendrochronology to the determination of magnitude-frequency relationships for landslides. Geomorphology 2010, 124, 137–149. [Google Scholar] [CrossRef]
- Mayer, B.; Stoffel, M.; Bollshweiler, M.; Hubl, J.; Rudolf-Miklau, F. Frequency and spread of debris floor on fans, a dendrogeomorphic case study from a Dolomite catchment in the Austrian Alps. Geomorphology 2010, 118, 199–206. [Google Scholar] [CrossRef]
- Shroder, J. Dendrogeomorhological analysis of mass movement on Table Cliffs Plateau, Utah. Quat. Res. 1978, 9, 168–185. [Google Scholar] [CrossRef]
- Braam, R.; Weiss, E.E.J.; Burrough, P.A. Spatial and temporal analysis of mass movement using dendrochronology. Catena 1987, 14, 573–584. [Google Scholar] [CrossRef] [Green Version]
- Braam, R.; Weiss, E.E.J.; Burrough, P.A. Dendrogeomorphological analysis of mass movement a technical note on the research method. Catena 1987, 14, 585–589. [Google Scholar] [CrossRef] [Green Version]
- Šilhán, K.; Stoffel, M. Impacts of age-dependent tree sensitivity and dating approaches on dendrogeomorphic time series of landslides. Geomorphology 2015, 236, 34–43. [Google Scholar] [CrossRef]
- Šilhán, K. Tree-ring eccentricity in the dendrogeomorphic analysis of landslides—A comparative study. Catena 2019, 174, 1–10. [Google Scholar] [CrossRef]
- Alestalo, J. Dendrochronological interpretation of geomorphic processes. Fennia 1971, 105, 11–46. [Google Scholar]
- Lundström, T.; Heiz, U.; Stoffel, M.; Stöckli, V. Fresh-wood bending: Linking the mechanical and growth properties of a Norway spruce stem. Tree Physiol. 2007, 27, 1229–1241. [Google Scholar] [CrossRef] [PubMed] [Green Version]
- Lundström, T.; Stoffel, M.; Stöckli, V. Fresh-stem bending of silver fir and Norway spruce. Tree Physiol. 2008, 28, 355–366. [Google Scholar] [CrossRef] [PubMed] [Green Version]
- Kozlowski, T.T.; Kramer, P.J.; Pallardy, S.G. The Physiological Ecology of Woody Plants; Academic Press: San Diego, CA, USA, 1991; p. 657. [Google Scholar]
- Kollmann, F.F.P.; Cote, W.A., Jr. Principles of Wood Science and Technology; Springer: Berlin/Heidelberg, Germany; New York, NY, USA, 1968; Volume 1 Solid Wood; p. 592. [Google Scholar]
- Kogelnig-Mayer, B.; Stoffel, M.; Schneuwly-Bollschweiler, M. Four-dimensional growth response of mature Larix decidua to stem burial under natural conditions. Trees Struct. Funct. 2013, 27, 1217–1223. [Google Scholar] [CrossRef] [Green Version]
- Butler, D.R.; Sawyer, C.F. Dendrogeomorphology and high-magnitude snow avalanches: A review and case study. Nat. Hazard Earth Syst. Sci. 2014, 8, 303–309. [Google Scholar] [CrossRef] [Green Version]
- Stoffel, M.; Butler, D.R.; Corona, C. Mass movements and tree rings: A guide to dendrogeomorphic field sampling and dating. Geomorphology 2013, 200, 106–120. [Google Scholar] [CrossRef]
- Butler, D.R.; Malanson, G.P.; Oelfke, J.G. Tree-ring analysis and natural hazard chronologies: Minimum sample sizes and index values. Prof. Geogr. 1987, 39, 41–47. [Google Scholar] [CrossRef]
- Catani, F.; Tofani, V.; Lagomarsino, D. Spatial patterns of landslide dimension: A tool for magnitude mapping. Geomorphology 2016, 273, 361–373. [Google Scholar] [CrossRef] [Green Version]
- Mantovani, F.; Soeters, R.; Van Westen, C.J. Remote sensing techniques for landslide studies and hazard zonation in Europe. Geomorphology 1996, 15, 213–225. [Google Scholar] [CrossRef]
- Chen, R.F.; Chang, K.J.; Angelier, J.; Chan, Y.C.; Deffontaines, B.; Lee, C.T.; Lin, M.L. Topographical changes revealed by high-resolution airborne LiDAR data: The 1999 Tsaoling landslide induced by the Chi-Chi earthquake. Eng. Geol. 2006, 88, 160–172. [Google Scholar] [CrossRef]
- Hapke, C.J. Estimation of regional material yield from coastal landslides based on historical digital terrain modelling. Earth Surf. Process. Landforms 2005, 30, 679–697. [Google Scholar] [CrossRef]
- Dewitte, O.; Jasselette, J.C.; Cornet, Y.; Van Den Eeckhaut, M.; Collignon, A.; Poesen, J.; Demoulin, A. Tracking landslide displacements by multi-temporal DTMs: A combined aerial stereophotogrammetric and LIDAR approach in western Belgium. Eng. Geol. 2008, 99, 11–22. [Google Scholar] [CrossRef]
- Ventura, G.; Vilardo, G.; Terranova, C.; Sessa, E.B. Tracking and evolution of complex active landslides by multi-temporal airborne LiDAR data: The Montaguto landslide (Southern Italy). Remote Sens. Environ. 2011, 115, 3237–3248. [Google Scholar] [CrossRef]
- Šilhán, K.; Prokešová, R.; Medveďová, A.; Tichavský, R. The effectiveness of dendrogeomorphic methods for reconstruction of past spatio-temporal landslide behaviour. Catena 2016, 147, 325–333. [Google Scholar] [CrossRef]
- Zupan, G. Krajevni leksikon Dravske Banovine; Uprava Krajevnega leksikona dravske banovine: Ljubljana, Slovenia, 1937; pp. 539–540. [Google Scholar]
- Peternel, T. Dinamika pobočnih masnih premikov na območju Potoške planine z uporabo rezultatov daljinskih in terestričnmih geodetskih opazovanj in-situ meritev. Ph.D. Thesis, Faculty of Civil and Geodetic Engineering, University of Ljubljana, Ljubljana, Slovenia, 25 May 2017; p. 183. [Google Scholar]
- Jež, J.; Trajanova, M.; Budkovič, T.; Mikoš, M.; Kumelj, Š.; Bavec, M. Koroška Bela alluvial fan—The result of the catastrophic slope events; Karavanke Mountains, NW Slovenia. Geologija 2008, 51, 219–227. [Google Scholar] [CrossRef]
- Peternel, T.; Jež, J.; Milanič, B.; Markelj, A.; Jemec Auflič, M. Engineering-geological conditions of landslides above the settlement of Koroška Bela (NW Slovenia). Geologija 2018, 61, 177–189. [Google Scholar] [CrossRef]
- Peternel, T.; Kumelj, Š.; Oštir, K.; Komac, M. Monitoring the Potoška planina landslide (NW Slovenia) using UAV photogrammetry and tachymetric measurements. Landslides 2016, 14, 395–406. [Google Scholar] [CrossRef]
- Slovenian Environmental Agency. 2017. Available online: https://www.arso.gov.si (accessed on 15 August 2018).
- Žížala, D.; Zvelebil, J.; Vilímek, V. Using dendrogeomorphology in research on a slope deformation in Beleč, Czech-Moravian Highland (Czech Republic). Acta Univ. Carolinae, Geogr. 2010, 45, 73–88. [Google Scholar]
- Burda, J. Spatio-temporal activity of mass movements in the Krušné hory mountains (Czech Republic): Dendrogeomorphological case study. Acta Univ. Carolinae, Geogr. 2011, 46, 15–30. [Google Scholar] [CrossRef] [Green Version]
- Trimble. R1 GNSS Receiver. 2018. Available online: https://www.trimble.com/R1 (accessed on 15 August 2018).
- Esri. Collector for ArcGIS. 2017. Available online: http://www.esri.com/products/collector-for-arcgis (accessed on 15 August 2018).
- Bräker, O.U. Measuring and data processing in tree-ring research—A methodological introduction. Dendrochronologia 2002, 20, 203–216. [Google Scholar] [CrossRef]
- Levanič, T. ATRICS, a new system for image acquisition in dendrochronology. Tree Ring Res. 2007, 63, 117–122. [Google Scholar] [CrossRef]
- Sciem. PAST-4. Personal Analysis System for Tree-Ring Research. 2013. Available online: https://www.sciem.com (accessed on 15 August 2018).
- Baillie, M.G.L.; Pilcher, J.R. A simple cross-dating program for tree-ring research. Tree-Ring Bull. 1973, 33, 7–14. [Google Scholar]
- Eckstein, D.; Bauch, J. Beitrag zur Rationalisierung eines dendrochronologischen Verfahrens und zur Analyse seiner Aussagesicherheit. Forstwissenschaftliches Centralblatt 1969, 88, 230–250. [Google Scholar] [CrossRef]
- Tichavský, R.; Kluzová, O.; Šilhán, K. Differences between the responses of European larch (Larix decidua Mill.) and Norway spruce (Picea abies (L.) Karst) to landslide activity based on dendrogeomorphic and dendrometric data. Geomorphology 2019, 330, 57–68. [Google Scholar] [CrossRef]
- Holmes, R.L. Computer-assisted quality control in tree-ring dating and measurement. Tree-Ring Bull. 1983, 43, 69–78. [Google Scholar]
- Šilhán, K. Dendrogeomorphological analysis of the evolution of slope processes on flysch rocks (Vsetínské vrchy Mts; Czech Republic). Carpathian J. Earth Environ. Sci. 2012, 7, 39–49. [Google Scholar]
- Klimeš, J.; Baroň, I.; Pánek, T.; Kosačk, T.; Burda, J.; Kresta, F.; Hradecký, J. Investigation of recent catastrophic landslides in the flysch belt of Outer Western Carpathians (Czech Republic): Progress towards better hazard assessment. Nat. Hazards Earth Syst. Sci. 2009, 9, 119–128. [Google Scholar] [CrossRef]
- ArcGIS for Desktop. ArcMap. 2018. Available online: http://desktop.arcgis.com/en/arcmap/ (accessed on 15 August 2018).
- Komac, M.; Holley, R.; Mahapatra, P.; van der Marel, H.; Bavec, M. Coupling of GPS/GNSS and radar interferometric data for a 3D surface displacement monitoring of landslides. Landslides 2014, 12, 241–257. [Google Scholar] [CrossRef]
- Šilhán, K. Can tree tilting indicate mechanisms of slope movement? Eng. Geol. 2015, 199, 157–164. [Google Scholar] [CrossRef]
- Štofko, P.; Kodrik, M. Comparison of the root system architecture between windthrown and undamaged spruces growing in poorly drained sites. J. For. Sci. 2008, 54, 150–160. [Google Scholar] [CrossRef] [Green Version]
- Perry, O.T. Tree roots, facts and fallacies. Arnoldia 1989, 49, 3–21. [Google Scholar]
- Migon, P.; Malik, I.; Hrádecký, J.; Owczarek, P.; Karel, Š. Geomorphological, pedological and dendrochronological signatures of a relict landslide terrain, Mt Garbatka (Kamienne Mts), SW Poland. Geomorphology 2014, 124, 200–214. [Google Scholar]
- Šilhán, K. How different are the results acquired from mathematical and subjective methods in dendrogeomorphology? Insights from landslide movements. Geomorphology 2016, 253, 189–198. [Google Scholar] [CrossRef]
- Stoffel, M.; Corona, C. Dendroecological Dating of Geomorphic Disturbance in Trees. Tree-Ring Res. 2014, 70, 3–20. [Google Scholar] [CrossRef] [Green Version]
- Šilhán, K. Dendrogeomorphic chronologies of landslides: Dating of true slide movements? Earth Surf. Process. Landf. 2017, 42, 2109–2118. [Google Scholar] [CrossRef]
Figure 1.
Location of the Urbas landslide, locations of disturbed and reference trees, and landslide intensity zones. Intensity zones are based on geological measurements and field observations [71,74] (Datasets: Geological Survey of Slovenia, 2017).

Figure 2.
Increment cores were taken at three positions: (a) upper side of the trunk, upslope; (b) downslope, where eccentricity is expected; (c) control sample, perpendicular to the slope. Ring widths (Ra, Rb, Rc) were measured and computed into the eccentricity index (Ei) for every year.
Figure 2.
Increment cores were taken at three positions: (a) upper side of the trunk, upslope; (b) downslope, where eccentricity is expected; (c) control sample, perpendicular to the slope. Ring widths (Ra, Rb, Rc) were measured and computed into the eccentricity index (Ei) for every year.

Figure 3.
Categorization of tree tilting was done by visual inspection of trunks of individual trees growing on the landslide body: (a) straight upwards, (b) straight downwards, (c) bent downwards, (d) bent upwards, (e) pistol-butted, (f) s-shaped (multiple bends).
Figure 3.
Categorization of tree tilting was done by visual inspection of trunks of individual trees growing on the landslide body: (a) straight upwards, (b) straight downwards, (c) bent downwards, (d) bent upwards, (e) pistol-butted, (f) s-shaped (multiple bends).

Figure 4.
(a) Number of growth disturbances (GD) and (b) event-response (It) index from 1880 to 2017 with a threshold value of “3%” (for GD and It)—horizontal line.
Figure 4.
(a) Number of growth disturbances (GD) and (b) event-response (It) index from 1880 to 2017 with a threshold value of “3%” (for GD and It)—horizontal line.

Figure 5.
(a) Number and intensity of GD and (b) landslide intensity expressed as a percentage of the It index for the period 1890–2017.
Figure 5.
(a) Number and intensity of GD and (b) landslide intensity expressed as a percentage of the It index for the period 1890–2017.

Figure 6.
Spatial extent of landslide reactivation events for the period 1943–2016, expressed as a number of disturbed trees (black dots). Smaller black dots represent undisturbed trees. The dashed black line represents landslide magnitude zones (1–5).
Figure 6.
Spatial extent of landslide reactivation events for the period 1943–2016, expressed as a number of disturbed trees (black dots). Smaller black dots represent undisturbed trees. The dashed black line represents landslide magnitude zones (1–5).

Figure 7.
Median of Ei for every tree tilt category. Trees with straight trunks and trees that could not be categorized in any of the previous categories were categorized as “nondefined”.
Figure 7.
Median of Ei for every tree tilt category. Trees with straight trunks and trees that could not be categorized in any of the previous categories were categorized as “nondefined”.

Figure 8.
Landslide activity based on the (a) DTM change and (b) interpolated Ei index and (period 2014–2017). Ei is expressed proportionally to its values (range from 0.28 to 0.67). Ei values of only first tree ring after landslide reactivation events (2015) are accounted for. Changes in the DTM are shown only for the area where significant change in Ei occurred. Results show that for the period 2014–2016, the change in Ei was greatest in the central part of the landslide body, DTM changes do not exactly match Ei change.

Figure 9.
Landslide intensity (expressed as Ei) by different zones in the period (a) 1943–2016 and (b) 2014–2016. Computation of mean Ei values included just first Ei values after landslide reactivation event.
Figure 9.
Landslide intensity (expressed as Ei) by different zones in the period (a) 1943–2016 and (b) 2014–2016. Computation of mean Ei values included just first Ei values after landslide reactivation event.

Figure 10.
A comparison of (a) tree ring-based chronology (expressed as It index) and (b) annual and seasonal precipitation totals (c—winter, d—spring, e—summer, f—autumn). Annual precipitation total is expressed as a deviation from the long-term average (solid black line). Dashed black color lines (c–f) represent means of seasonal precipitation totals.

Figure 11.
Location of trees that did not record GD. Although trees were located in sites where high elevation change can be observed, they did not record GD. Moreover, their Ei values were all close to 0.
Figure 11.
Location of trees that did not record GD. Although trees were located in sites where high elevation change can be observed, they did not record GD. Moreover, their Ei values were all close to 0.


Table 1.
Relationship (R square values) between mean changes in DTM values and Ei values. DTM change was calculated inside different buffer zones (2, 5, 7.5, and 10 m). The location of trees was the basis for creating buffer zones.
Table 1.
Relationship (R square values) between mean changes in DTM values and Ei values. DTM change was calculated inside different buffer zones (2, 5, 7.5, and 10 m). The location of trees was the basis for creating buffer zones.
| Average DTM Change (m) in Buffer Radius | |||||
|---|---|---|---|---|---|
| Tree ID | Ei Index | 2 m | 5 m | 7.5 m | 10 m |
| 10 | 0.28 | −0.21 | 0.14 | −0.01 | 0.03 |
| 23 | 0.28 | 0.39 | 0.21 | 0.20 | 0.16 |
| 41 | 0.63 | 0.20 | 0.02 | 0.18 | −0.03 |
| 51 | 0.67 | 0.47 | 0.35 | 0.28 | 0.24 |
| 54 | 0.44 | 0.25 | 0.17 | 0.24 | −0.04 |
| 99 | 0.44 | −0.08 | 0.06 | 0.10 | 0.12 |
| R square values | 0.24 | 0.83 | 0.35 | 0.58 | |
| Line type | Polynomial | Polynomial | Linear | Polynomial | |
© 2019 by the authors. Licensee MDPI, Basel, Switzerland. This article is an open access article distributed under the terms and conditions of the Creative Commons Attribution (CC BY) license (http://creativecommons.org/licenses/by/4.0/).
Share and Cite
MDPI and ACS Style
Oven, D.; Levanič, T.; Jež, J.; Kobal, M. Reconstruction of Landslide Activity Using Dendrogeomorphological Analysis in the Karavanke Mountains in NW Slovenia. Forests 2019, 10, 1009. https://doi.org/10.3390/f10111009
AMA Style
Oven D, Levanič T, Jež J, Kobal M. Reconstruction of Landslide Activity Using Dendrogeomorphological Analysis in the Karavanke Mountains in NW Slovenia. Forests. 2019; 10(11):1009. https://doi.org/10.3390/f10111009
Chicago/Turabian StyleOven, Domen, Tomislav Levanič, Jernej Jež, and Milan Kobal. 2019. "Reconstruction of Landslide Activity Using Dendrogeomorphological Analysis in the Karavanke Mountains in NW Slovenia" Forests 10, no. 11: 1009. https://doi.org/10.3390/f10111009
Note that from the first issue of 2016, this journal uses article numbers instead of page numbers. See further details here.