
Abstract
The recombination of neutral oxygen atoms in the ground state on the oxidized nickel samples was studied experimentally in the range of pressures where the maximum density occurs in weakly ionized low-pressure oxygen plasma, i.e. between 40 and 200 Pa. The recombination coefficient was determined in the flowing afterglow. The source of oxygen atoms was plasma sustained in a quartz tube of inner diameter 4.7 mm by a microwave discharge in the surfatron mode. The recombination coefficient was determined in the afterglow chamber, which was a Pyrex tube with an inner diameter of 36 mm. The density of oxygen atoms in the afterglow chamber was varied by adjusting the discharge power, the gas flow, the pressure, and the position of a recombinator. Such flexibility of the experimental system enabled adjustment of the temperature of the oxidized nickel samples independently from the O-atom density in its vicinity or other parameters. The density of oxygen atoms in the afterglow chamber at various system parameters was determined by the Šorli method, which is reliable, and has an accuracy of about 20%. The recombination coefficient was determined by calorimetry. The coefficient was inversely proportional to the square root of the pressure and exponentially to the sample temperature. Systematic measurements performed at various pressures and temperatures enabled empirical formula, which were explained qualitatively by recombination kinetics.
Export citation and abstract BibTeX RIS

Original content from this work may be used under the terms of the Creative Commons Attribution 4.0 license. Any further distribution of this work must maintain attribution to the author(s) and the title of the work, journal citation and DOI.
1. Introduction
The interaction of neutral oxygen atoms with the surfaces of solid materials has attracted the attention of numerous authors involved in the basic phenomena as well as technological aspects of controlled surface oxidation [1–7]. Surface oxidation should often be achieved at low temperatures, sometimes even at room temperature. Namely, the bulk properties of materials should be preserved despite the exothermic character of the surface reactions. Keeping a low (preferable room) temperature is particularly important when delicate materials like polymers are to be oxidized. Oxidation with molecular oxygen is usually not feasible because many materials will not form oxides unless heated to elevated temperatures. The best examples are polymers. The surface oxidation of both synthetic and natural polymers with molecular oxygen usually occurs at temperatures above the glass transition point or even the melting point.
In cases where low-temperature oxidation should be achieved, molecular oxygen has to be replaced with oxygen of higher oxidation potential. Ozone is often chosen, but it may be impractical and rather expensive for the oxidation of large quantities of organic materials. An alternative to ozone is oxygen atoms. They are perfectly stable in the gas phase as long as the pressure is low enough to ensure a negligible association of O atoms to parent molecules in the gas phase. The shelf time of oxygen atoms will decrease with increasing pressure because the probability of three-body collisions increases as a square of the pressure. At low pressures, the loss of oxygen atoms is predominantly on the surfaces of materials.
The surface recombination coefficient depends on the type of material, in particular on the ability of a material to provide a large density of surface adsorption sites. Many materials exhibit a very low recombination coefficient, among them glasses, some types of ceramics, and many polymers [8]. On the other hand, metal oxides will enable a large coefficient as long as oxygen is not firmly bound to metallic atoms in the metal oxide. Especially transition metals will form oxides, which are semi-conductive and provide recombination sites for O atoms arriving from the gas phase [9, 10].
The surface recombination of atoms attracted the attention of early authors, who illustrated the basic mechanisms. Nowadays, there are numerous theories on surface recombination, but there are two distinguished models: the Langmuir–Hinshelwood and Eley–Rideal. The first one predicts the adsorption of atoms on the surface of the solid material, surface oscillations or migration, and the association of two atoms on the surface to the parent molecule. The molecule is obviously in thermal equilibrium with the surface, so it will leave the surface with negligible kinetic or potential energy. The second model predicts the direct interaction of a gas phase atom impinging the surface with an atom already bound on the surface. The potential energy of an oxygen atom in the gas phase is usually taken as half of the binding energy of oxygen molecules, i.e. 2.6 eV. Since the interaction is immediate, there is no time for surface accommodation of the impinging atom, and the resulting molecule may leave the surface with significant potential energy (i.e. vibrationally excited).
The Eley–Rideal model does not involve surface migration, so the recombination probability will be large even at low temperatures. On the other hand, the recombination probability of the Langmuir–Hinshelwood model will increase with increasing surface mobility of atoms, i.e. increasing temperature.
These two models only illustrate the mechanisms, which are still not well understood. The probability of surface recombination will definitely depend on the type of material and its morphology on both the nanometer and micrometer scales. The type of material will dictate the availability of surface recombination sites, whereas the roughness will enable various collisions of an atom trapped in a gap on the material surface. In fact, the largest recombination coefficient for a particular material was measured on vertically oriented nanosheets [11]. The recombination coefficient may also depend on the concentration of any other gaseous species adsorbed on the surface. Namely, other species but atoms will shade the surface sites, so they may not be available for the adsorption of oxygen atoms. Taking into account the upper discussion, the recombination coefficient is likely to depend on the material temperature.
The surface recombination coefficient will dictate the density of atoms in a processing chamber and, thus, the flux of atoms on the material, which should be processed with the atoms. In many practical cases, keeping the flux as constant as possible and as laterally homogeneous as possible is useful [12]. This is not always possible because of the edge effects and also because the density of atoms changes with time without changing the discharge parameters [13]. The variation in the O-atom density may be a consequence of the temperature dependence of the surface loss coefficient. This is especially a severe concern for industrial plasma systems operating in batch mode and loaded with different amounts of different products. Based on these considerations, it is useful to know the variation of the recombination coefficient with the temperature and the pressure.
One of the first reports on the recombination of oxygen atoms at various surfaces was provided by Greaves and Linnett in 1958 [10]. They used a flowing system and measured the density of oxygen atoms along a continuously pumped tube made of or coated with different materials. They kept the temperature of these materials constant (close to room temperature) and reported the coefficients for different metals, metal oxides, as well as some other materials. They did not report how they enabled oxygen-free metallic samples in an atmosphere rich in oxygen atoms. The fluxes of any other species likely present in gaseous plasma, such as charged particles and UV photons, were negligible because they used a sidearm. They reported the recombination coefficient for transition metals like iron and nickel about  , whereas the coefficient on these metal oxides was as low as about
  . They did not report any morphological properties of the materials.
Myerson [14] performed similar experiments but used a pulsed radio-frequency discharge for the dissociation of oxygen molecules. He added argon to the source gas to increase the dissociation fraction. He used NO titration to measure the density of O atoms in the processing chamber. Myerson is probably the first author who reported the initial effects upon exposure of metallic foils to oxygen atoms. The recombination coefficient was found to be a complex function of the exposure time for low exposure times. The results are explained by the formation of oxide film as well as possible nanostructuring, which is likely to occur upon prolonged exposure of metal foils to oxygen atoms [15]. In any case, the coefficient stabilized after prolonged exposure, and the coefficients were found to be 0.018 for iron and 0.0085 for nickel. The results are different from Greaves and Linnett, who reported values of about 0.03 for both metals. The discrepancy between the results could be explained by various factors, including the accuracy of the measuring technique, different pressures used by different authors, and unknown surface morphology.
Melin and Madix [16] performed both theoretical and experimental work to determine the recombination coefficient for various materials. Apart from the recombination coefficient, they also evaluated the energy accommodation coefficient ( ), which is defined as:
where  is the Avogadro number,
  is the measured input power to the isothermal calorimeter,
  is the mean free velocity of atoms,
  is the number density of atoms near the surface of the material,
  is the surface area of the material,
  is the recombination coefficient of the material, and
  is the dissociation energy of the parent molecule. Unlike previous authors, they found the recombination coefficient for nickel larger than that of iron, in particular, 0.017 and 0.010, respectively. They also reported the recombination coefficient for another transition metal—cobalt. The recombination coefficient for cobalt was several times larger at 0.075. All these values were supposed to be measured at room temperature of the metallic samples. Melin and Madix also reported highly vibrationally excited molecules leaving the surface. They found an exponential increase in the recombination coefficient with increasing temperature and provided an empirical formula. They measured the temperature dependence of the recombination coefficient in the range of about 300–500 K.
Another breakthrough was achieved by Šorli and Ročak [17]. They constructed a simple experimental setup, which enabled a rather precise determination of oxygen atom density in the measuring chamber. They measured the heat dissipated on a highly recombinative metallic tube mounted between the plasma source of atoms and the measuring chamber. They assured almost zero transmitivity of the metallic tubes for neutral oxygen atoms. They measured the recombination coefficient for nickel in a range of temperatures from 500 to 1100 K and found a rather constant value at about 0.27. They also provided the dissociation fraction of oxygen atoms measured with a probe by considering this value of the recombination coefficient and disclosed values between about 10% and 20%. They discussed the accuracy of their method for the determination of the recombination coefficient and argued that the dissociation fraction would be over 100% if the recombination coefficients provided by Greaves and Linnett were taken into account. Namely, the nickel catalytic material used by Šorli and Ročak was oxidized, and Greaves and Linnett reported values below 0.01 for oxidized nickel surfaces. Šorli and Ročak measured the recombination coefficient in the range of pressures between 10 and 100 Pa. The temperature of the nickel material was about 600 K at 10 Pa and 1100 K at 60 Pa.
Later, the recombination coefficient was measured by other authors. For example, Mozetič and Cvelbar [18] measured the coefficient on the nickel surface and found the same value as Šorli and Ročak. However, they were probably the first authors who reported serious deviation of the recombination coefficient because of the formation of a thick oxide film of rich morphology. In another paper, the same group measured the recombination coefficient versus the pressure in the processing chamber [19]. They found the coefficient for copper practically independent from the pressure, whereas the recombination coefficient for cobalt was maximal at the pressure of about 20 Pa, decreased rapidly with decreasing pressure and slowly with increasing pressure. A completely different behavior was reported for niobium, where the coefficient increased linearly from 40 to 120 Pa and remained constant thereafter. Such a rather unexpected result may be explained by the fact that the material temperature upon surface recombination of oxygen atoms depends on the pressure. Different materials form different oxides of different morphologies. Unfortunately, these effects were not addressed by [18, 19].
Poberaj et al [20] did not measure the recombination coefficient but reported interesting results, which may indicate the temperature dependence of the recombination coefficient. They measured O atom density with catalytic probes. One probe was always kept at a rather high temperature, while the other was sometimes kept at a high temperature but sometimes at a low temperature. They reported good agreements between the results obtained by catalytic probes when immersed in an oxygen atmosphere with a high density of neutral oxygen atoms. At low O atom density, however, there was a serious discrepancy. The discrepancy was explained by the fact that one probe always operated at a rather high temperature, while the other probe also operated at a low temperature when the O density was lower. Implicitly, Poberaj et al reported a lower value of recombination coefficient for a nickel at a lower nickel temperature.
The above literature survey leads to the assumption of the pressure and/or temperature dependence of the recombination coefficient. In order to clarify both dependences, we performed systematic measurements of the recombination coefficient at various fluxes of both oxygen atoms and molecules, various pressures, and temperatures of the nickel catalyst. We selected the range of pressures between 40 and 200 Pa because the O-atoms density often reaches the maximum in this pressure range in weakly ionized plasmas sustained in discharge chambers made from a material of low surface loss probability. The knowledge of the temperature and pressure dependence of the recombination coefficient is absolutely necessary when using calorimetry (including advanced versions of catalytic probes) for measuring the O-atom density in plasma systems for controlled oxidation of heat-sensitive objects, including biological samples. Namely, the surface finish (hydrophilicity, wettability, printability, biocompatibility, etc) depends on the doses of O-atoms, so it is important to determine the flux as accurately as possible. The lack of knowledge on the temperature dependence of the recombination coefficient could lead to a misinterpretation of the range of fluences useful for optimal surface finish of delicate materials.
2. Methods
2.1. Experimental setup
We adopted the experimental technique proposed by Šorli and Ročak to determine any temperature or pressure dependence of the recombination coefficient. A schematic of the experimental setup is shown in figure 1. The gas was introduced into the system via the mass flow controller, and passed through a narrow quartz tube. The gaseous plasma, which was the source of oxygen atoms, was ignited and sustained in the microwave (MW) cavity inside the narrow quartz tube of inner diameter 4.7 mm by a MW discharge in the surfatron mode. Details about the operation of such a discharge were reported elsewhere [21]. The MW discharge sustained plasma in a rather small volume inside the MW cavity. Oxygen molecules were partially dissociated, ionized, and excited upon plasma conditions. The gas speed through the narrow quartz tube was large, typically more than  at the exhaust of the narrow tube to a wider tube [22]. The large speed was a consequence of a pressure gradient along the glass tube. A typical ratio of pressures on the inlet and outlet side of the tube was 10 or more [23].

Figure 1. Experimental setup. (a) For measuring the recombination coefficient; (b) for measuring the atom density inside the Pyrex tube. The outer and inner diameters of the quartz tube are 6 and 4.7 mm, respectively, the metallic tube of diameter 6 mm is made from a thin metallic foil, and the movable recombinator is a titanium rod of diameter 2 mm.  marks the position of the movable recombinator just outside the MW cavity while
  marks the leftmost position of the movable recombinator.
Download figure:
Standard image High-resolution imageWe placed a movable recombinator inside the narrow tube for some of the measurements in order to obtain lower densities of neutral atoms. The recombinator was a titanium rod with a diameter of 2 mm. After the gas passed through the quartz tube, it entered a wider Pyrex tube. The Pyrex tube was pumped with a two-stage rotary pump, which also had an adjustable valve to control the effective pumping speed. The pressure inside the Pyrex tube was measured with a baratron.
Charged particles effectively recombined on the glass surface on the way from the MW cavity to the exhaust from the glass tube. The recombination coefficient for oxygen atoms on quartz glass is of the order of  [24–27], so the loss of atoms was negligible. The gas entering the afterglow chamber (Pyrex tube) thus contained only neutral oxygen atoms in the ground state and oxygen molecules.
The density of oxygen atoms in the ground state in the measuring chamber next to the exhaust of the quartz tube was determined using the Šorli method. A metallic tube made of catalytic material was mounted at the exhaust of the quartz tube, as shown in figure 1(b). Metallic tubes were made from three different materials, i.e. nickel, iron, or cobalt. The inner diameter and the length of the metallic tubes were 6 and 27 mm, respectively. The metallic tube was mounted in such a manner that it fitted tightly on the quartz glass tube, as shown in figure 1(b). Each metallic tube was connected to a thermocouple to enable measuring its temperature. The oxygen atoms arriving from the quartz tube effectively recombined on the surface of the metallic tube by heterogenous surface recombination. The number of atoms entering the metallic tube in a unit of time ( ) was calculated as follows:
where  is the effective pumping speed (the volume flow at the exhaust of the narrow glass tube), and
  is the number density of oxygen atoms entering the metallic tube. Each atom that recombined on the surface of the metallic tube brought half of the dissociation energy of oxygen molecules, i.e. 2.6 eV. The energy was spent on heating the metallic tube. After igniting the discharge, the temperature of the metallic tube started to rise, and after a prolonged time, it assumed a constant value. When the constant temperature of the metallic tube was reached, the discharge was turned off, and the metallic tube started to cool. Just after turning off the discharge, the cooling rate was equal to the heating when the discharge was on. Knowing the measured time derivative of the metallic tube temperature just after turning off the discharge enabled the estimation of the power dissipated on the surface of the metallic tube. The power is proportional to the number of atoms entering the metallic tube (equation (2)). We can calculate the number density of oxygen atoms at the exhaust of the quartz tube as:
where  is the dissociation energy of oxygen molecules, and
  ,
,  ,
,  are the mass, specific heat, and the time derivative of the temperature of the metallic tube, respectively [17]. Equation (3) predicts that all atoms passing the metallic tube from the plasma source into the afterglow chamber (Pyrex tube) recombine to form parent molecules.
The Šorli method will give reliable results providing all the atoms entering metallic tube will actually recombine to form parent molecules. If this is true, the density of atoms in the afterglow chamber (at the position of the nickel disc, see figure 1(a)) when the metallic tube is present is negligible. Since nickel is catalytic for surface recombination of O atoms, the nickel disc mounted close to the exhaust from the quartz tube serves as a catalytic probe. The signal was actually below the detection limit of the probe, which is at the O-atom density of about  m−3, so it is possible to conclude that a vast majority of atoms actually recombine on the metallic tube in the configuration of figure 1(b), so equation (2) is a reliable approximation. The probe signal became measurable only at elevated pressures. The correction factor at pressures up to 100 Pa is below a few %, whereas it is up to about 10% at the highest flow probed at our experiments, i.e. 3000 sccm.
The recombination coefficient of nickel was measured after removing the metallic tube from the experimental system, so in the configuration as shown in figure 1(a). Namely, when the metallic tube was absent (figure 1(a)), the flow of atoms into the afterglow chamber was practically the same as the flow into the metallic tube in the configuration as in figure 1(b).
A thin disc of high-purity nickel (99.99%) was placed into the afterglow chamber at the position marked as 'nickel disc' in figure 1. The disc was fixed to thermocouple wires. Before performing systematic measurements at various conditions, the disc was kept at a temperature of about 750 K for half an hour to enable the formation of a stable and thick oxide film. The surface roughness of the oxidized catalytic material was measured by atomic force microscopy and the thickness of the oxide film by ToF-SIMS after cutting the disc.
The recombination coefficient of the nickel disc was measured by calorimetry. Knowing the density of atoms at the position of the catalytic disc enables the calculation of the recombination coefficient:
where  ,
,  ,
,  , and
, and  are the mass, specific heat, radius, and the time derivative of the temperature of the catalytic disc, respectively [17]. Any temperature or pressure dependence of the recombination coefficient was determined by either keeping the catalytic disc temperature constant at different pressures or keeping the pressure constant but allowing different temperatures of the catalytic discs. The pressure in the system was kept constant at different disc temperatures by variation of the effective pumping speed and the inlet gas flow. By different combinations of these two parameters, it was possible to achieve different atom densities at the position of the catalytic disc at the selected pressure. The atom density was also adjusted by moving the titanium recombinator in the quartz tube, as shown schematically in figure 1.
2.2. AFM measurements
Atomic force microscopy (AFM) measurements were performed with the A100-AFM microscope produced by A.P.E. Research (Italy) with the NT-MDT silicon tips. Measurements were done in the contact mode with the recording frequency of 0.5 Hz. The resolution of the images was set to 256 × 256 pixels. Images were post-processed with the plane subtraction due to the sample inclination involving a second-order polynomial correction and with the correction of the horizontal scars caused by the rough surface and consequent errors due to the responsiveness of the tip.
2.3. ToF-SIMS measurements
The time-of-flight secondary ion emission spectroscopy (ToF-SIMS) analyses were performed on a TOF.SIMS 5 instrument produced by IONTOF (Germany). Micrographs were recorded using Bi+ ions with the energy of 30 keV while simultaneously performing sputtering with the second ion gun (dual beam) using Cs+ ions with the energy of 1 keV. The current of the Bi+ ions was approximately 0.2 pA and the current of the Cs+ ions was approximately 564 nA. The analyses with the Bi+ primary ions were performed over a 100 × 100 μm scanning area (512 × 512 pixels), located in the center of the 400 × 400 μm etching crater sputtered by the Cs+ ion beam. The lateral resolution of the Bi+ analysis beam was approximately 200 nm. Hydrogen gas was introduced into the analysis chamber via a capillary to close proximity of the analyzed region to reduce the matrix effect and enable better differentiation between layers of Ni and NiO [28]. The pressure of the H2 atmosphere in the analysis chamber was 7 × 10⁻⁷ mbar. Secondary ions were analyzed in the m/z range 0–420. Only negative secondary ions were analyzed.
3. Results and discussion
3.1. Oxygen atom density and dissociation fraction in the measuring chamber
The experimental setup shown in figure 1 was first used to evaluate the density of atoms in the measuring chamber at the position where the catalytic discs was mounted (configuration as in figure 1(b)). Equation (3) indicates that the calculated number of atoms entering the afterglow chamber (Pyrex tube) in unit time is independent of the recombination coefficient of the material the metallic tube is made from. We placed three different metallic tubes made from nickel, cobalt, and iron at the exhaust of the quartz tube into the Pyrex tube as shown in figure 1(b). The density of O atoms in the afterglow chamber using these three metallic tubes is plotted in figure 2. There are small deviations from the standard curve, but all measured points are within the limits of the experimental error. The results in figure 2 therefore confirm that the density of atoms, as calculated from equation (3), does not depend on the recombination coefficient of the materials from which the metallic tubes are made. As mentioned earlier, this is because the surface recombination is large enough to transform practically all atoms into molecules when the partially dissociated gas passes through the metallic tube.

Figure 2. O atom density at the position of the catalyst discs versus the pressure in the measuring chamber at the effective pumping speed of up to 0.017  and gas inlet rates up to 3000 sccm.
Download figure:
Standard image High-resolution imageThe error bars in figure 2 arise from several repetitions of the measurements (statistical error) as well as the uncertainty of the atom leakage through the metallic tubes. The latter increases with increasing pressure. As mentioned above, the uncertainty of the measured density of oxygen atoms depends on the efficiency of the metallic tubes to recombine atoms, and the efficiency slowly decreases when the pressure increases. Namely, the mean free path of gaseous species decreases with increasing pressure, so there is a certain probability that the atoms will pass the metallic tube without experiencing numerous collisions with the metallic tube surface at elevated pressures, which is necessary for efficient recombination.
Several effects explain the behavior of the O-atom density versus the pressure (figure 2). First, the number of available molecules for dissociation increases linearly with increasing pressure. When this effect prevails, the O atom density also increases linearly with increasing pressure. The linearity persists up to the pressure of about 80 Pa at conditions selected for figure 2. At elevated pressure, the dissociation of oxygen molecules in the plasma is not as efficient as at low pressures because the discharge power is limited. In the case of the results presented in figure 2, we used the discharge power of 180 W. As shown by some other authors, the dissociation of oxygen molecules at elevated power actually increases with increasing discharge power [23]. The measurements were repeated at various gas flows, pressures, and the position of the movable recombinator in order to determine the O-atom density in a broad range of discharge parameters useful for the determination of the recombination coefficients.
The movable recombinator serves for adjustment of the O-atom density in the Pyrex tube irrespective of the discharge power or pressure. Namely, some atoms formed upon dissociation of oxygen molecules in glowing plasma recombine on the surface of the titanium rod. The O-atom density in the Pyrex tube is plotted versus the position of the movable recombinator in figure 3. Position 0 in figure 3 corresponds to the right edge of the MW cavity in figure 1(a). As expected, the O-atom density decreases as the recombinator is moved inside the plasma.

Figure 3. The O-atom density ( ) in the Pyrex tube versus the position of the movable recombinator (
 ) at the gas pressure inside the Pyrex tube of 84 Pa and four different discharge powers.
Download figure:
Standard image High-resolution image3.2. The recombination coefficient
After measuring the atom density in the afterglow chamber at various conditions, the metallic tubes were removed from the experimental system shown in figure 1(b), and a nickel disc was mounted, as shown in figure 1(a). The disc was connected to very thin thermocouple wires, and the discs temperature was measured versus time at various experimental conditions. A typical example of a disc temperature is shown in figure 4. The discharge was switched on at t = 7 s, and switched off at t = 14 s. One can observe a behavior typical for heating a sample at a constant heating power. Soon after igniting the discharge, the temperature increases linearly with time because the heating power is constant (strictly, it is constant if the recombination coefficient does not depend on the temperature), and any cooling is negligible. As the temperature increases with increasing treatment time, a deviation of linearity is observed, and after about 10 s, the temperature stabilizes. When the temperature is constant, the heating and cooling rates are equal. Cooling depends on various mechanisms, including the grey body radiation, the thermal conductivity of the surrounding gas, cooling by gas drift, and cooling through the thermocouple wires. The latter is negligible because of the very small mass of the wires (0.25 mm diameter). The maximum temperatures of a nickel disc are plotted in figure 5 versus the pressure at the discharge power of 180 W, a fully open butterfly valve, and the recombinator outside the quartz tube.

Figure 4. Typical measurement with a nickel disc catalytic probe. The graph shows the disc temperature ( ) versus time (
 ).
).
Download figure:
Standard image High-resolution image
Figure 5. The maximum temperature ( ) of a nickel disc versus pressure (
 ) inside the system.
Download figure:
Standard image High-resolution imageThe recombination coefficient of the nickel disc is calculated from the time derivative of the disc temperature using equation (4), providing the O atom density in the vicinity of the catalytic disc is known and providing that the disc does not represent such a large sink of atoms so that the O-atom gradient would form around the disc. Numerous measurements were performed at various discharge conditions, which enabled various O-atom densities in the afterglow chamber. Results are shown in figure 6.
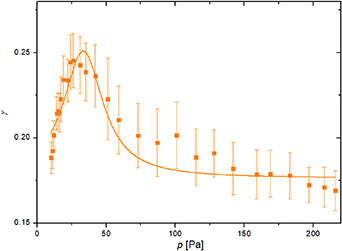
Figure 6. The recombination coefficient of a nickel catalytic disc versus the pressure in the measuring chamber at the fixed discharge power of 180 W, calculated from equation (4).
Download figure:
Standard image High-resolution imageAccording to figure 6, the recombination coefficient increases steeply with the pressure in the range of 10–30 Pa. The coefficient is about 0.20 at 10 Pa and 0.25 at 30 Pa. Thereafter, the recombination coefficient starts decreasing with further pressure increase. At first glance, one may conclude that the recombination coefficient increases with increasing pressure up to about 30 Pa and decreases at elevated pressures. The observations arising from the behavior of the measured curve in figure 6, however, should be taken with precautions because not only is the pressure changing, but the temperature of the catalytic disc when turning off the discharge also depends on the pressure (figure 5). Figure 6 only indicates some dependencies, but it is unclear whether the dependence is directly due to pressure-related or temperature-related effects. Interestingly, very similar results were reported by Cvelbar et al for a cobalt catalyst [19].
Similar results as in figure 6 can be presented versus the maximum temperature of the catalytic disc. Results for nickel are shown in figure 7. In addition, we also provide the results of the calculated recombination coefficient at several discharge powers. We were changing the gas pressure in the same manner as for results shown in figure 5 at a constant pumping speed, but we calculated the recombination coefficient versus maximum temperature at various discharge powers. We see that all four curves in figure 7 exhibit a rather unexpected behavior. The recombination coefficient increases with increasing temperature up to about 800 K, but starts decreasing thereafter and assumes a rather low value when the temperature is decreased. The highly surprising results are explained by the fact that probe temperature does not only depend on atom density in the vicinity of the probe but also on the gas pressure. The turn in the curve in figure 7 indicates decreasing  with increasing pressure. Taking into account the pressure, which was measured simultaneously, one may deduce that a rather high recombination coefficient is measured at low pressure, the highest measured at moderate pressure, whereas at large pressures, the recombination coefficient decreases again. The turning point in figure 7 is observed for all four discharge powers, but the absolute values are different. The differences are due to the increasing O-atom density with increasing discharge power. The larger O-atom density at a fixed pressure will cause a higher catalyst temperature because of the larger flux of oxygen atoms onto the catalyst surface, whereas the cooling through the gas at a fixed pressure remains the same, irrespective of the discharge power.
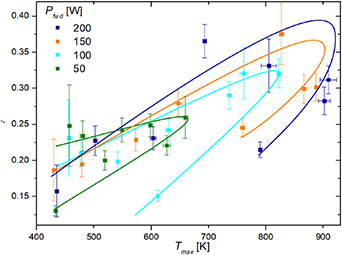
Figure 7. Calculated recombination coefficient ( ) of nickel at various maximum temperatures of the nickel disc for four different forward powers of the MW generator.
Download figure:
Standard image High-resolution imageConsidering figures 5 and 6, one can conclude either about pressure or temperature dependence of the recombination coefficient or both. In order to clarify, we performed measurements at fixed temperatures of the nickel sample and at several pressures. This was possible by changing the input power of the MW generator and the position of the movable recombinator (figure 1).
Figure 8 represents the recombination coefficients for a nickel disc kept at nine different temperatures, ranging from 370 K to 750 K, and at various pressures between 41 and 214 Pa. Such broad conditions were achieved by changing the flow of gas through the system and varying the discharge power. Furthermore, we were moving the titanium recombinator in the quartz tube (figure 1) to achieve lower densities of neutral atoms at large discharge powers, which allowed for measurements at temperatures of the nickel disc below the value that would be reached without the recombinator. One can observe a monotonous decrease in the recombination coefficient with increasing pressure in figure 8. These measurements clearly indicate that the gas pressure influences the recombination coefficient. The difference between the lowest and the highest pressure, however, is not dramatic—less than a factor of 2.
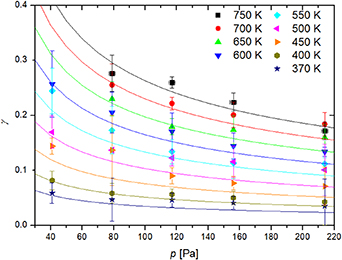
Figure 8. Recombination coefficient ( ) of nickel for oxygen atoms versus pressure (
 ) in the plasma system at nine fixed temperatures. Plotted lines represent the fitting of the function
  onto the measurements.
Download figure:
Standard image High-resolution imageThe lowest measurable point for 750, 700, and 650 K in figure 8 is at the pressure of about 79 Pa. Namely, the probe does not heat up to 650 K at lower pressures simply because O atom density is too low (see figure 5). Lower temperatures are achievable in our experimental system also at slightly lower pressures. The recombination coefficient decreases with increasing pressure and the differences are not large at elevated pressures. It was not possible to measure the curve at higher pressure because it was not possible to heat the catalyst to such a high temperature at elevated pressures.
The pressure dependence of recombination coefficients has already been mentioned by several authors [29–31]. A feasible explanation is the screening of the oxygen atom adsorption sites by oxygen molecules. This effect is, of course, more pronounced at elevated pressures simply because the flux of molecules on the surface increases linearly with increasing pressure. Still, the rather small slope of the curve at around 200 Pa indicates a significant number of recombination sites even at elevated pressures. Figure 8, therefore, indicates that recombination at various elevated temperatures remains relatively large even at high pressures (does not approach zero).
As mentioned earlier and according to figure 8, the recombination coefficient should also depend on the temperature because the mobility of surface adatoms increases with increasing temperature. The measured temperature dependence of the recombination coefficient for the nickel disc at the pressures of 41, 79, 117, 156, and 214 Pa is plotted in figure 9. The measured dots are somewhat scattered, but the general trend is obvious: the recombination coefficient increases with increasing surface temperature.

Figure 9. Recombination coefficient ( ) of oxidized nickel for oxygen atoms versus surface temperature (
 ) at five fixed pressures inside the afterglow chamber. Plotted lines represent the fitting of the function
  onto the measurements.
Download figure:
Standard image High-resolution imageSeveral authors have reported a similar trend when it comes to the temperature dependence of the recombination coefficient [9, 16, 32–42]. Many agree that the dependence can be described with an Arrhenius plot in the form of:

where  and
and  are parameters usually gleaned from empirical results. Equation (5) was taken as a basis for our own empirical equation, but we also considered the pressure dependence. Several formulas were considered, with a few viable candidates. In the end, the best agreement for both pressure and temperature dependence of
  in the range of the probed pressures and temperatures was found to be in the form of:
where  and
and  . While we could not find any data on the pressure dependence of
  for nickel, the exponential factor
  is in agreement with Dickens and Sutcliffe when using the Arrhenius plot [9]. This exponential factor corresponds to an energy of
  , which is significantly lower than the dissociation energy of an oxygen molecule.
The flexibility of the experimental system adopted for this research enabled variation of the nickel disc temperature irrespectively from the pressure in the afterglow chamber or the atom density near the catalyst. This is particularly important because the simultaneous variation of both the pressure and the catalyst temperature may lead to misinterpretation of the recombination coefficient dependence, as demonstrated in figures 5 and 6. The results presented in figures 7 and 8 are reliable, but not very accurate because a rather large scattering of measured points is observed. The scattering comes from the inaccuracy of measuring the density of oxygen atoms in the afterglow chamber (a few examples are shown in figure 2) as well as somehow arbitrary determination of the maximal catalyst temperature (figure 4). The latter is probably the effect of increasing gas temperature with increasing plasma duration.
The empirical formula obtained from measured points in figures 7 and 8 does not fit perfectly the measured values. It should be taken only as a recommended approximation for the range of probed pressures and temperatures of the oxidized nickel samples at turning off the discharge generator. Although similar temperature behavior was reported by numerous authors ([9, 16, 32–42]), the scientifically spotless explanation remains to be invented. Qualitatively, one can explain the temperature behavior by increasing mobility of surface adatoms with increasing temperature. As mentioned above, the Langmuir–Hinshelwood model predicts the association of two adatoms accommodated on the surface to a molecule, which is, contradictory to atoms, not trapped by rather strong chemical bonds, so it desorbs and leaves the surface. The association of neighboring adatoms will require close proximity because the average distance between oxygen atoms in the O2 molecule is only about 0.12 nm [43], while the average distance between atoms on the surface of solid material is roughly  nm [44]. Such proximity is more likely to occur at an increased amplitude of bonded O-atoms oscillation, and the amplitude increases with increasing temperature. Any discussion on the exact mechanisms at the atomic scale is beyond the scope of this article.
The formula (6) indicates the recombination inversely proportional to the square root of pressure. Obviously, the formula is void at low pressures, because the coefficient would approach infinity when the pressure will approach 0. The formula is valid only in the range of pressures used in this work. We selected the range of pressures between 40 and 200 Pa because the measurements were feasible in this range. In fact, many reactors employing weakly ionized oxygen plasma for tailoring surface properties of solid materials exhibit the maximum O-atom density within this range [45].
As already mentioned, metals form oxide films upon exposure to oxygen at elevated temperatures. The film thickness will increase with increasing temperature (and, to less extent, also the oxidation time). Even if the catalytic disc is polished, the oxide film will be rather rough. The recombination coefficient should depend on the roughness because the roughness increases the effective surface when compared to the geometrical surface area. All measurements of the recombination coefficient were performed after thorough oxidation of the nickel disc as explained above. AFM images of a nickel surface oxidized at different temperatures are shown in figure 10, progressing from a clean nickel surface (a), oxidation at 400 K (b), oxidation at 600 K (c), oxidation at 800 K (d), oxidation at 1000 K (e), and oxidation at 1200 K (f). The RMS surface roughness ( ) increased with increasing oxidation temperature from
  to
to  . The catalytic nickel disc, which was used in experiments after forming a stable oxide film at around 1000 K, is shown in figure 10(e). The roughness was estimated at
  . The thickness of the oxide film after thorough oxidation of the nickel disc was determined by ToF-SIMS. As shown in figure 11, the thickness was about 10 µm.

Figure 10. AFM images of  surface areas of nickel samples, starting with (a) a clean nickel sample with
  , (b) nickel sample oxidized at 400 K with
  , (c) nickel sample oxidized at 600 K with
  , (d) nickel sample oxidized at 800 K with
  , (e) nickel sample oxidized at 1000 K with
  , and (f) nickel sample oxidized at 1200 K with
  .
.
Download figure:
Standard image High-resolution image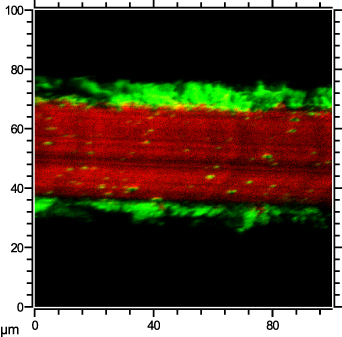
Figure 11. ToF-SIMS image of the cross section of the nickel disc. At around 30  thickness, the red section represents pure nickel, whereas the green sections represent nickel oxide with a thickness of about 10
  on each side.
Download figure:
Standard image High-resolution image
4. Conclusions
The coefficient for heterogenous recombination of O atoms on the surface of oxidized nickel disc to parent molecules was determined experimentally. First, the O atom density in the afterglow chamber was measured at various experimental conditions using the method originally proposed by Šorli and Ročak. Three different metallic tubes were probed in order to validate the reliability of the method. The same conditions were adopted for measuring the heating curves of a well-oxidized nickel disc. The heating curves enabled calculation of the recombination coefficient from known density of O atoms in the measuring chamber. Various gas flow rates, effective pumping speeds and O-atom densities enabled determination of the temperature and pressure variation of the recombination coefficient in the range of pressures between about 40 and 200 Pa, and the range of temperatures between about 370 and 750 K. The measured results were fitted with an empirical formula. The formula is useful at any attempt to use nickel as the catalytic material in advanced probes for sensing the density of oxygen atoms in devices for oxidation of delicate materials in a highly controllable manner.
Acknowledgments
This research was funded by the Slovenian Research Agency, Grant Nos. P2-0082 and L2-4487.
Data availability statement
The data cannot be made publicly available upon publication because they are not available in a format that is sufficiently accessible or reusable by other researchers. The data that support the findings of this study are available upon reasonable request from the authors.