The potential global distribution of an emerging forest pathogen, Lecanosticta acicola, under a changing climate
 Nikica Ogris
 Rein Drenkhan
 Petr Vahalík
 Thomas Cech4
  Martin Mullett
- 1Department of Forest Protection, Slovenian Forestry Institute, Ljubljana, Slovenia
- 2Institute of Forestry and Engineering, Estonian University of Life Sciences, Tartu, Estonia
- 3Department of Forest Management and Applied Geoinformatics, Faculty of Forestry and Wood Technology, Mendel University in Brno, Brno, Czechia
- 4Department of Forest Protection, Federal Research and Training Centre for Forests, Natural Hazards and Landscape (BFW), Vienna, Austria
- 5Department of Forest Protection and Wildlife Management, Faculty of Forestry and Wood Technology, Phytophthora Research Centre, Mendel University in Brno, Brno, Czechia
- 6Forest Research, Alice Holt Lodge, Farnham, United Kingdom
Brown spot needle blight (BSNB), caused by Lecanosticta acicola (Thüm.) Syd., is an emerging forest disease of Pinus species originating from North America and introduced to Europe and Asia. Severity and spread of the disease has increased in the last two decades in North America and Europe as a response to climate change. No modeling work on spread, severity, climatic suitability, or potential distribution has been done for this important emerging pathogen. This study utilizes a global dataset of 2,970 independent observations of L. acicola presence and absence from the geodatabase, together with Pinus spp. distribution data and 44 independent climatic and environmental variables. The objectives were to (1) identify which bioclimatic and environmental variables are most influential in the distribution of L. acicola; (2) compare four modeling approaches to determine which modeling method best fits the data; (3) examine the realized distribution of the pathogen under climatic conditions in the reference period (1971–2000); and (4) predict the potential future global distribution of the pathogen under various climate change scenarios. These objectives were achieved using a species distribution modeling. Four modeling approaches were tested: regression-based model, individual classification trees, bagging with three different base learners, and random forest. Altogether, eight models were developed. An ensemble of the three best models was used to make predictions for the potential distribution of L. acicola: bagging with random tree, bagging with logistic model trees, and random forest. Performance of the model ensemble was very good, with high precision (0.87) and very high AUC (0.94). The potential distribution of L. acicola was computed for five global climate models (GCM) and three combined pathways of Shared Socioeconomic Pathway (SSP) and Representative Concentration Pathway (SSP-RCP): SSP1-RCP2.6, SSP2-RCP4.5, and SSP5-RCP8.5. The results of the five GCMs were averaged on combined SSP-RCP (median) per 30-year period. Eight of 44 studied factors determined as most important in explaining L. acicola distribution were included in the models: mean diurnal temperature range, mean temperature of wettest quarter, precipitation of warmest quarter, precipitation seasonality, moisture in upper portion of soil column of wettest quarter, surface downwelling longwave radiation of driest quarter, surface downwelling shortwave radiation of warmest quarter and elevation. The actual distribution of L. acicola in the reference period 1971–2000 covered 5.9% of Pinus spp. area globally. However, the model ensemble predicted potential distribution of L. acicola to cover an average of 58.2% of Pinus species global cover in the reference period. Different climate change scenarios (five GCMs, three SSP-RCPs) showed a positive trend in possible range expansion of L. acicola for the period 1971–2100. The average model predictions toward the end of the century showed the potential distribution of L. acicola rising to 62.2, 61.9, 60.3% of Pinus spp. area for SSP1-RCP2.6, SSP2-RCP4.5, SSP5-RCP8.5, respectively. However, the 95% confidence interval encompassed 35.7–82.3% of global Pinus spp. area in the period 1971–2000 and 33.6–85.8% in the period 2071–2100. It was found that SSP-RCPs had a little effect on variability of BSNB potential distribution (60.3–62.2% in the period 2071–2100 for medium prediction). In contrast, GCMs had vast impact on the potential distribution of L. acicola (33.6–85.8% of global pines area). The maps of potential distribution of BSNB will assist forest managers in considering the risk of BSNB. The results will allow practitioners and policymakers to focus surveillance methods and implement appropriate management plans.
1. Introduction
Lecanosticta acicola is a fungus that causes a foliar disease of pines known as brown spot needle blight (BSNB) (van der Nest et al., 2019a; Tubby et al., 2023). Symptoms of the disease begin as small irregular shaped yellow dots which develop into larger, dark orange to brown, sometimes resin soaked, spots often surrounded by a yellow halo (van der Nest et al., 2019a; Tubby et al., 2023). Needle tips above the point of infection die, turning orange-brown, and needles are eventually shed prematurely (van der Nest et al., 2019a; Tubby et al., 2023). Infection therefore results in a loss of photosynthetic ability, reduced growth and eventually tree mortality under high infection levels (van der Nest et al., 2019a; Tubby et al., 2023).
The pathogen is known to infect at least 70 host taxa, primarily Pinus species, but also Cedrus and Picea spp., with the known host range continuously growing and likely to include most pine species (Tubby et al., 2023). The global range and impact of L. acicola have been steadily increasing since the 1990s and the pathogen is present in 39 countries worldwide, in Europe, Asia, and North, Central, and South America. In Europe a marked upsurge in the impact and incidence of BSNB has occurred over the past decade, where the disease is now present in 24 European countries (Mullett et al., 2018; Tubby et al., 2023). The pathogen has been spread to Europe from North America, with a number of distinct introductions taking place (Janoušek et al., 2016; Laas et al., 2022). It is indeed believed that L. acicola originates from Mexico or North America, where it was first described, and has caused extensive damage to Pinus species (van der Nest et al., 2019b).
Although anthropogenic spread of L. acicola occurs primarily through plant movement, its subsequent establishment, spread, and disease severity is strongly influenced by climate, known to be a critical driver in the lifecycle of many fungal pathogens (Woods et al., 2016; Mesanza et al., 2021; Tubby et al., 2023). The disease and symptoms of BSNB are similar to Dothistroma needle blight (DNB) caused by Dothistroma spp., the most damaging and significant foliar disease of pines worldwide (Bulman et al., 2016; Drenkhan et al., 2016; Adamson et al., 2018; Tubby et al., 2023). Climate change has significantly influenced impacts of DNB on pine forests in Britain and western Canada (Woods et al., 2005, 2016; Archibald and Brown, 2007). Areas with large natural forests and forest plantations in the Northern Hemisphere, including western Canada, eastern Russia, and Fennoscandia, are at increased risk from DNB, as several studies predict that DNB severity will increase (Watt et al., 2011a; Drenkhan et al., 2016). Specifically, increased temperature and moisture availability (precipitation and/or relative humidity) seem to have the highest impact on DNB severity (Woods et al., 2005, 2016; Watt et al., 2021).
Similarities and analogies in Dothistroma species and L. acicola ecology, biology, behavior and host ranges raise concerns that BSNB could also increase in range and impact (Laas et al., 2019; Oskay et al., 2020; Raitelaitytė et al., 2023). Temperature and moisture availability (precipitation and/or humidity) also appear to strongly influence behavior of L. acicola and development of BSNB (Wyka et al., 2018; Mesanza et al., 2021; Tubby et al., 2023). Recent climatic changes appear to have caused considerable increases in BSNB severity in the northern USA and Canada (Broders et al., 2015; Wyka et al., 2017) and have been implicated in the growing impact of the disease in Europe (Tubby et al., 2023). As BSNB increases in incidence and severity, the number of studies investigating the effects of weather on the pathogen have slowly grown (e.g., Wyka et al., 2018; Mesanza et al., 2021) yet we still know surprisingly little about the drivers of BSNB.
Lecanosticta acicola has been far less intensively studied than Dothistroma species, and no modeling work on spread, severity, climatic suitability, or potential distribution specifically of L. acicola has been done, even though it is recognized as an important emerging pathogen by forest managers, forest pathologists and policymakers. Addressing such evidence deficits will be critical to predicting potential range expansion of the pathogen and allow practitioners and policymakers to focus surveillance methods and implement proactive management plans.
Species distribution models (SDMs) are mathematical tools that combine observations of species occurrence with environmental factors (Elith and Leathwick, 2009). They are used to deepen ecological understanding and to predict species distributions across regions, sometimes requiring extrapolation in space and time. SDMs are now widely used across all ecosystems (Elith and Leathwick, 2009) and can use a variety of different modeling approaches.
This study utilizes a global dataset of 2,970 independent observations of L. acicola presence and absence from the geodatabase of Tubby et al. (2023), together with Pinus spp. distribution data and 44 independent climatic and environmental variables. Using these data the objectives were to (1) identify which bioclimatic and environmental variables are most influential in the distribution of L. acicola; (2) compare four modeling approaches to determine which modeling method best fits the data; (3) examine the realized distribution of the pathogen under climatic conditions in the reference period (1971–2000); and (4) predict the potential future global distribution of the pathogen under various climate change scenarios (2001–2100). These objectives were achieved with a species distribution modeling approach.
2. Materials and methods
This study used an ensemble of models to calculate the potential global distribution of L. acicola under bioclimatic conditions in a reference period (1971–2000) and projected future period (2001–2100). The binary variable of L. acicola presence/absence was selected as the principal target variable, and the global distribution of all Pinus species was used as the spatial extent for which predictions were made. Data for bioclimatic variables was collected, selecting only those variables which were not autocorrelated for further processing. A model’s performance was evaluated and predictions for several climate change scenarios calculated as follows (Figure 1).
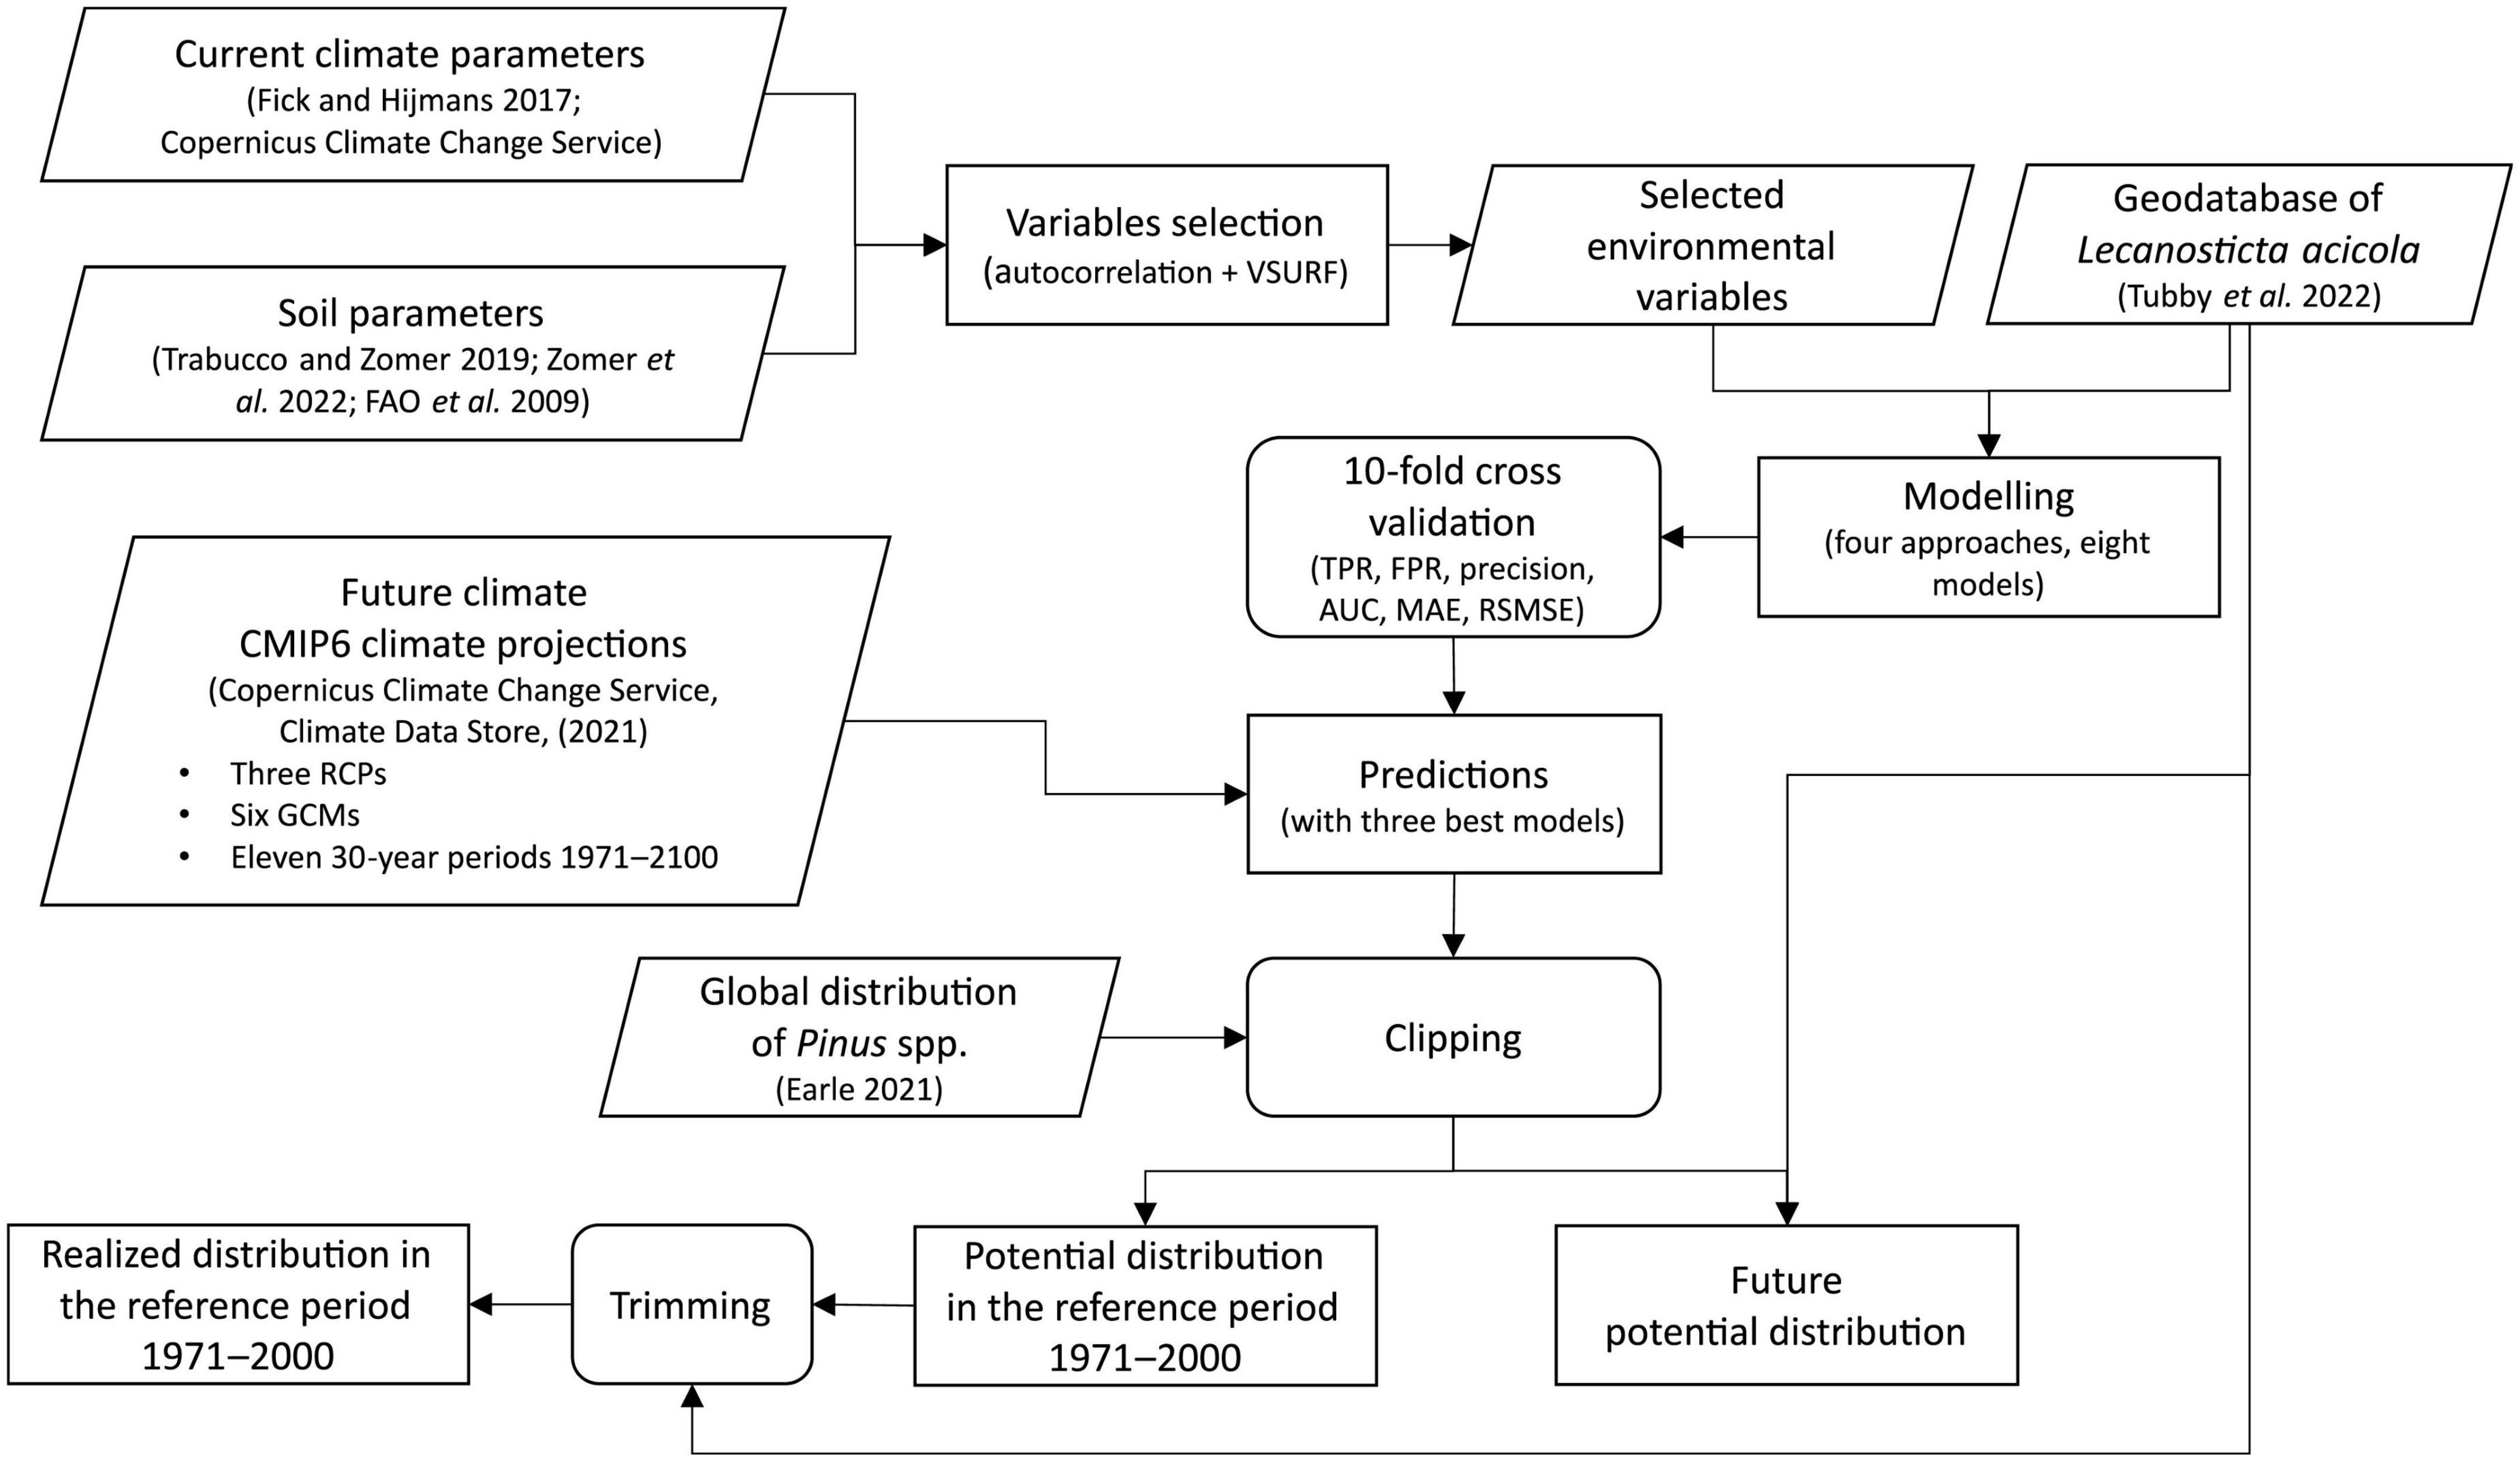
Figure 1. Flowchart showing the modeling process.
2.1. Geodatabase of Lecanosticta acicola distribution
The geodatabase described in Tubby et al. (2023), generated following the approaches used for examinations of Dothistroma species and Fusarium circinatum Nirenberg and O’Donnell range and impact (Drenkhan et al., 2016, 2020), was used to describe the current geographic distribution of L. acicola. A global consortium of specialist researchers contributed to data collection with the objective of collating records and locations of L. acicola worldwide. Certain data entry fields were mandatory, including pathogen presence/absence, identity of data holder, host species, date of record, and forest type (urban, natural, plantation). Voluntary fields allowed entry of more detailed data on disease severity, presence of other pathogens, local climate, soil type and management practices, among other variables (see Tubby et al., 2023; Supplementary Table 1 for details).
The geodatabase is projected into the WGS 1984 coordinate system. All data are publicly available on a web map application hosted by Mendel University in Brno, Czechia.1 The geodatabase is a live system with periodic additions. In the current study the database version from the 16th of December 2022 was used for model development. The geodatabase contained 3,081 records from Asia, Europe, North America, South America, Oceania, and Africa. Only data from the wider environment were used (n = 2,970), nursery records were omitted. The database contained 896 confirmed reports of L. acicola and 2,074 negative records where L. acicola was marked as absent (Tubby et al., 2023).
The majority of the presence/absence data were confirmed by molecular methods (e.g., conventional PCR, qPCR, rtPCR), i.e., 79.8% of the absence data and 48.9% of the presence data (Tubby et al., 2023). In addition, 37.9% of the presence data and 6.0% of the absence data were identified by morphological examination with a compound microscope. A smaller proportion of data were identified by visual inspection only, 14.2 and 13.2% of the absence and presence data, respectively. Most presence/absence data came from official systematic surveys and are therefore considered highly reliable (Tubby et al., 2023).
2.2. Distribution of pines and model spatial resolution
The gymnosperm database was used to establish a global distribution of pines (Earle, 2021; accessed 24. July 2022). The database contained 6,109 records from the BRAHMS database at Conifers of the world (Farjon, 2021; accessed 11. November 2021), and four GBIF Occurrence download (GBIF, 2022; accessed 12. November 2021). The database considered 119 Pinus species. We assumed that all Pinus species were equally susceptible to L. acicola infection and that their distribution and susceptibility would not change under climate change.
The worldwide distribution of Pinus spp. was generalized to 1 × 1-degree cells taking into account the native range of taxa and extralimital occurrences, e.g., agroforestry, horticulture, or naturalized. In total 3,769 model cells with pines occurred (Figure 2).

Figure 2. Global distribution of Lecanosticta acicola and Pinus spp. Data sources: L. acicola (Tubby et al., 2023), Pinus sp. (Earle, 2021).
Therefore, the spatial resolution of the model was 1 × 1-degree cells. The geographical distribution of L. acicola was then matched to the spatial resolution of the model. L. acicola was present in 222 and absent in 182 model cells (Figure 2). If a model cell contained positive and negative records of L. acicola, the model cell was marked as positive for L. acicola. The dataset contained nearly balanced presence/absence data. However, sampling bias was not investigated.
2.3. Independent variables
Initially, data for 44 independent variables were collected and converted into the model spatial resolution (Supplementary Table 1). Elevation and 19 bioclimatic variables were acquired from WorldClim version 2.1 climate data for 1970–2000 (Supplementary Table 1; Fick and Hijmans, 2017, 2020).
Four variables from the global high resolution soil water balance dataset were included (Trabucco and Zomer, 2010, 2019; average over 1950–2000 period): potential evapotranspiration (PET), actual evapotranspiration (AET), monthly fraction of soil water content available for evapotranspiration processes (as percentage of maximum soil water content; a measure of soil stress), and the Priestley-Taylor alpha coefficient (generalized as the ratio of annual AET over annual PET; a description of overall aridity stress on vegetation).
Furthermore, the global aridity index was obtained from the global aridity index and PET database (Zomer et al., 2022) and expressed as a ratio of mean annual precipitation over mean annual reference evapotranspiration for the averaged 1971–2000 time period.
Four topsoil properties were included in the database: organic carbon (% of weight), pH, reference bulk density (kg/dm3), and base saturation (%). Soil data was acquired from the harmonized world soil database (FAO et al., 2009).
Additionally, five variables were included from monthly global climate historical data computed in the framework of the sixth phase of the Coupled Model Intercomparison Project (CMIP6): near-surface relative humidity (%), near-surface wind speed (m/s), moisture in the upper portion of the soil column (MRSOS, vertical sum per unit area from the surface down to the bottom of the soil model of water in all phases contained in soil; kg/m2), surface downwelling longwave radiation (RLDS, radiative longwave flux of energy downward at the surface; W/m2), surface downwelling shortwave radiation (RSDS, radiative shortwave flux of energy downward at the surface; W/m2). All five variables were included in three variants (altogether 15 variables), i.e., average values in the period 1971–2000 for driest quarter, warmest quarter, and wettest quarter where quarter is a period of 3 months.
Bioclimate and soil variables were available with a spatial resolution of 30 s (approximately 1 km; Supplementary Table 2). However, relative humidity, wind speed, MRSOS, RLDS and RSDS were available at a much coarser scale, i.e., 0.5–2.8° (approximately 55.6–311.2 km). We decided to use a spatial resolution of 1-degree to match the spatial resolution of the Pinus dataset. Finally, the data with various spatial resolutions were resampled to a 1-degree model grid using bilinear interpolation.
2.4. Selection of the model variables
Autocorrelation between variables was tested using the FindCorr function from DescTools package version 0.99.45 (Signorell et al., 2022) in R statistical software (R Core Team, 2022) using 0.90 pair-wise absolute correlation cut-off threshold. The FindCorr function automated a search for autocorrelated independent variables. FindCorr is based on the correlation matrix calculated using the “cor” function where Pearson’s correlation coefficient was chosen as the measure of linear correlation between two variables. Before using the “cor” function, it was checked that the assumptions of the Pearson’s correlation coefficient were met: (1) the variables are numerical and continuous, (2) there is a linear relationship between the variables, (3) the variables are normally distributed, and (4) the data are from a representative sample. All variables were numeric, continuous, had a visible linear relationship, and the data sample was representative. Variables that were not normally distributed were log transformed to achieve approximate normality (elevation, BIO3, all precipitation variables, aridity index, ETP, topsoil organic carbon, topsoil base saturation). Altogether ten highly autocorrelated variables were removed from further model development (Supplementary Table 1 and Supplementary Figure 1).
Further variable selection was done using random forests with the VSURF package version 1.1.0 (Genuer et al., 2010, 2019). VSURF incorporates three steps for variable selection based on random forests for supervised classification and regression problems. The first “thresholding step” concentrates on eliminating irrelevant variables from the dataset. The second “interpretation step” selects all variables related to the response for interpretation purposes. The third “prediction step” refines the selection by eliminating redundancy in the set of variables selected by the second step, for prediction purposes. A detailed description of the individual steps can be found in the VSURF package documentation (Genuer et al., 2010, 2019). One hundred random forests were grown in each step and each random forest had 300 classification trees.
2.5. Model development and evaluation of model performance
Four modeling approaches were used: (1) generalized linear model (GLM) with binomial distribution with logit link function, (2) individual classification trees (random tree, J48, LMT), (3) bagging (with three different base learners: random tree, J48, LMT), and (4) random forest (RF).
Generalized linear models (GLMs) are frequently used, regression-based SDMs. GLMs can handle non-normal error distributions, additive terms and non-linear fitted functions (McCulloch et al., 2005). GLMs generalize “linear regression by allowing the linear model to be related to the response variable via a link function and by allowing the magnitude of the variance of each measurement to be a function of its predicted value” (Zhao, 2013). The GLM consists of three elements: (1) a probability distribution, (2) a linear predictor, and (3) a link function. A binomial probability distribution with logit link function is most commonly chosen for presence/absence data.
Classification trees are decision trees which are among the most popular tools for machine learning and data mining (Blockeel, 1998). “A decision tree is a hierarchical structure where each internal node uses a test on an attribute, each branch corresponds to an outcome of the test, and each leaf gives a prediction for the value of the dependent class variable” (Džeroski, 2001). The paths from root to leaf represent classification rules. A number of classification trees have been developed since the 1990s including J48, Random tree and LMT (logistic model tree). In our study we used three methods: J48, Random tree and LMT. The J48 method is used for generating a pruned or unpruned C4.5 decision tree (Quinlan, 1993). Random tree constructs a classification tree that considers a number of randomly chosen attributes at each node and performs no pruning (Breiman, 2001). LMT builds logistic model trees, which are classification trees with logistic regression functions at the leaves (Landwehr et al., 2005; Sumner et al., 2005).
”Bagging is an ensemble method that constructs the different classifiers by making bootstrap replicates of the training set and using each of these replicates to construct one classifier. Each bootstrap sample is obtained by randomly sampling training instances, with replacement, from the original training set, until an equal number of instances is obtained” (Breiman, 1996, 2001; Kocev et al., 2007). Breiman (1996) has shown that bagging can give substantial gains in predictive performance when applied to an unstable learner such as classification and regression tree learners. The classification tree learners J48, Random tree and LMT are also available in the bagging method.
A random forest is now widely used in SDMs (e.g., Mi et al., 2017; Watt et al., 2021; Koldasbayeva et al., 2022). “A random forest is an ensemble of trees, where diversity among the predictors is obtained by bagging, and additionally by changing the feature set during learning. More precisely, at each node in the decision trees, a random subset of the input attributes is taken, and the best feature is selected from this subset” (Breiman, 2001). “Random forests are a combination of tree predictors such that each tree depends on the values of a random vector sampled independently and with the same distribution for all trees in the forest” (Breiman, 2001; Kocev et al., 2007). It is an ensemble method which is better than a single classification tree because it reduces over-fitting by averaging the result (Jin et al., 2014; Carvajal et al., 2018; Nahar and Ara, 2018; Naseem et al., 2021). The final predictions in random forest are calculated from an ensemble of predictions from individual trees used as a median prediction. Different studies have shown that random forest outperforms other methods such as extreme gradient boosting, multiple regression (Watt et al., 2021), geographically weighted regression, artificial neural network, and support vector machine for regression (Chen et al., 2019).
Altogether, eight models were developed (Table 1). The best settings for each method were explored by changing its parameters repeatedly. The settings that gave the highest accuracy were kept as optimal. The models were validated using 10-fold cross-validation. The three best models were used as an ensemble for the predictions where the most frequent prediction per model cell was considered.
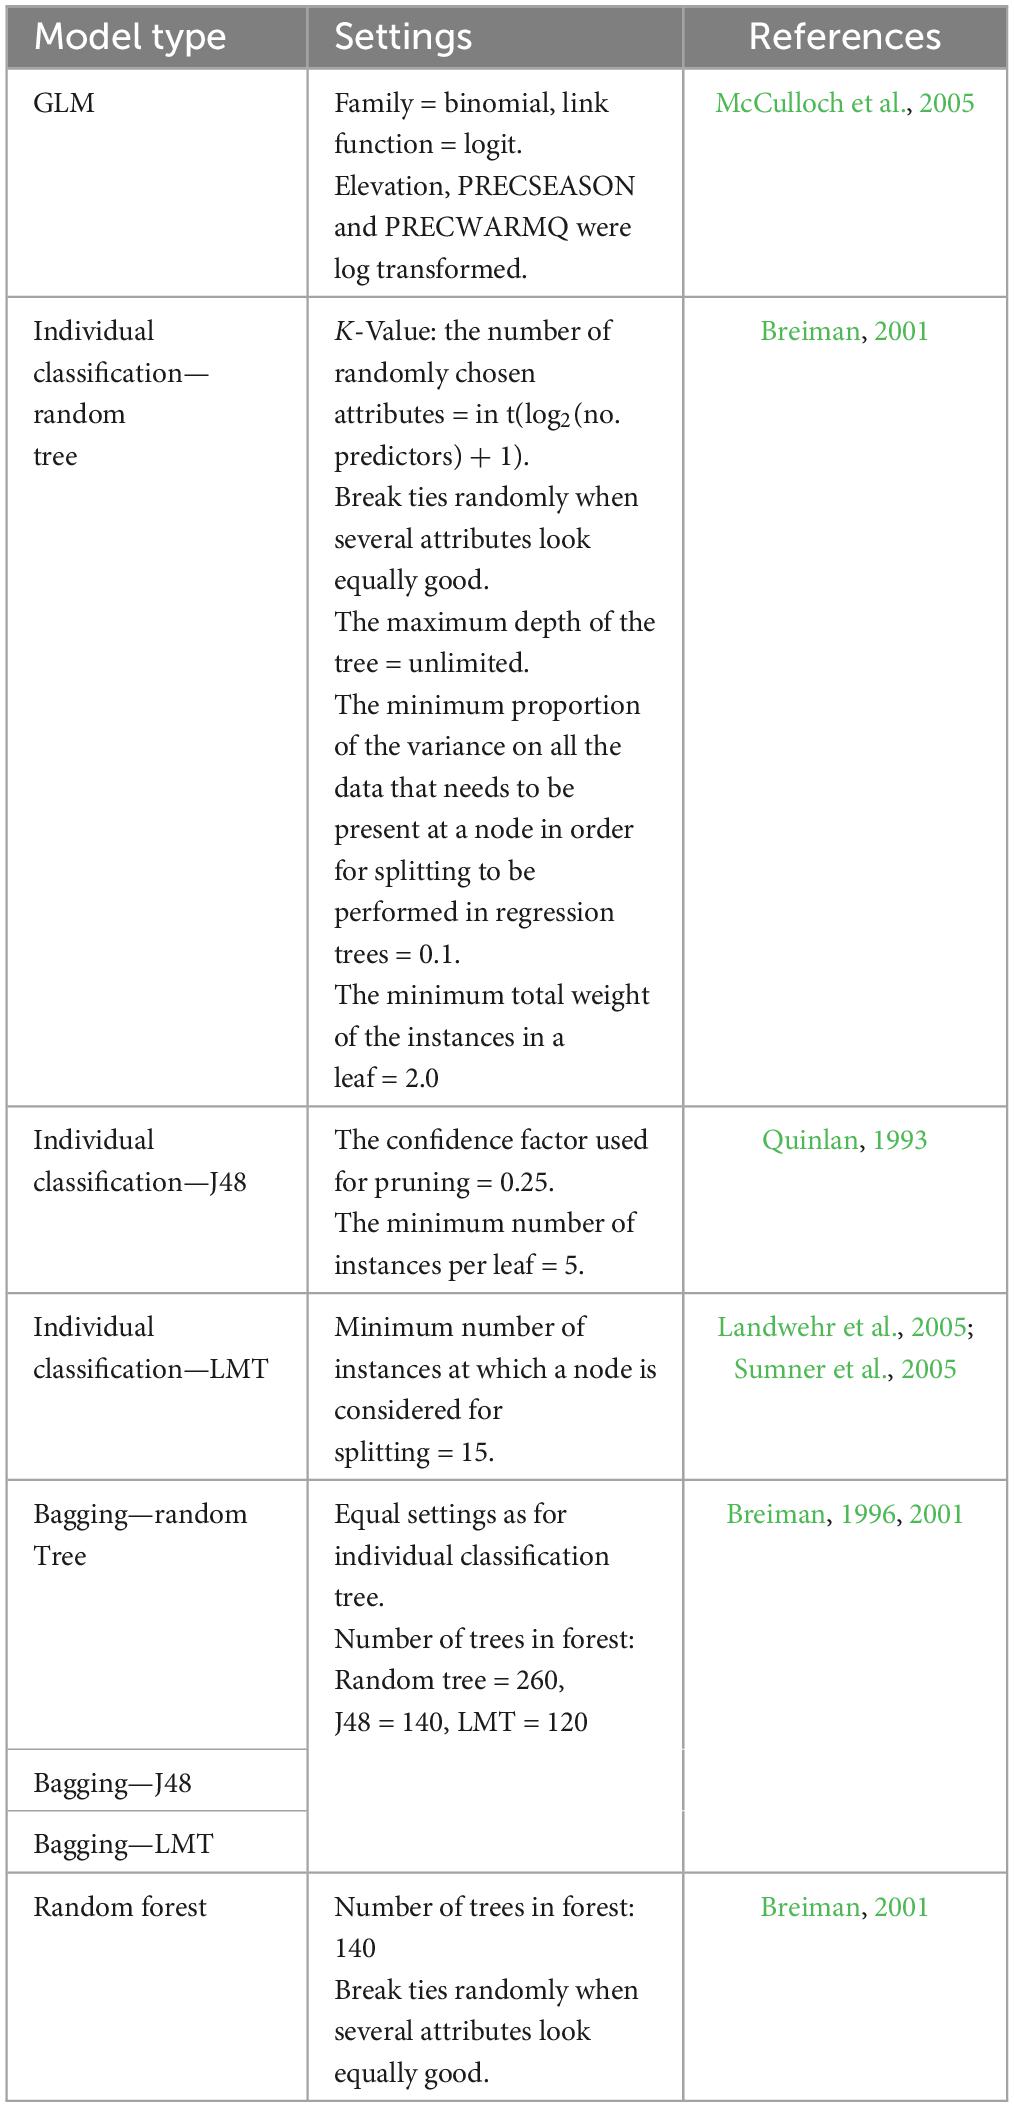
Table 1. Model types used for the modeling of Lecanosticta acicola potential distribution.
The models can be further improved if spatial autocorrelation is taken into account. Spatial autocorrelation is the correlation between spatially adjacent values of a single variable. In our study, we did not consider spatial autocorrelation. Therefore, the bias due to spatial autocorrelation was unknown (Diniz-Filho et al., 2003).
Attribute importance was calculated based on Gini impurity. For a decision tree, the impurity decrease from each feature can be averaged, and the features are ranked according to this measure. Gini impurity gives the probability of misclassifying an observation. Therefore, the lower the Gini the lower the likelihood of misclassification, i.e., the lower Gini the higher variable importance. The Gini impurity has a minimum (highest level of purity) of 0 and a maximum value of 0.5 indicating a random assignment of classes. Gini impurity for the ith node is given by Breiman et al. (1998):
where pi,k is the proportion of samples that belong to class k in the ith node of the tree.
Model performance was evaluated with mean absolute error (MAE), root mean squared error (RMSE), true positive rate [TPR or sensitivity = TP/(TP + FN)], false positive rate [FPR or fall-out = FP/(FP + TN)], precision = TP/(TP + FP), ROC area (Receiver Operating Characteristic area), and Kappa = (observed accuracy—expected accuracy)/(1—expected accuracy). ROC area is an area under the curve (AUC), where the TPR is plotted on the Y-axis, and the FPR on the X-axis (Witten and Frank, 2005).
2.6. Range expansion under climate change scenarios
The potential distribution of L. acicola was computed for five global climate models (GCM, Table 2) and three combined pathways of Shared Socioeconomic Pathway (SSP) and Representative Concentration Pathway (RCP): SSP1-RCP2.6, SSP2-RCP4.5, and SSP5-RCP8.5 (van Vuuren et al., 2011; Riahi et al., 2017). In the remainder of the text, we refer to these simply as RCP scenarios and they are used to illustrate different pathways for future climate forcing. The predictions were made for eleven 30-year periods between 1971 and 2100. The results of the five GCMs were averaged on combined SSP-RCP (median) per 30-year period. Data on the presence or absence of L. acicola were for the period 1922–2021, but not all climate data were available for this period. Most climate data were available for the period after 1970. Therefore, a standard meteorological period of 30 years (1971–2000) was chosen as the reference period.
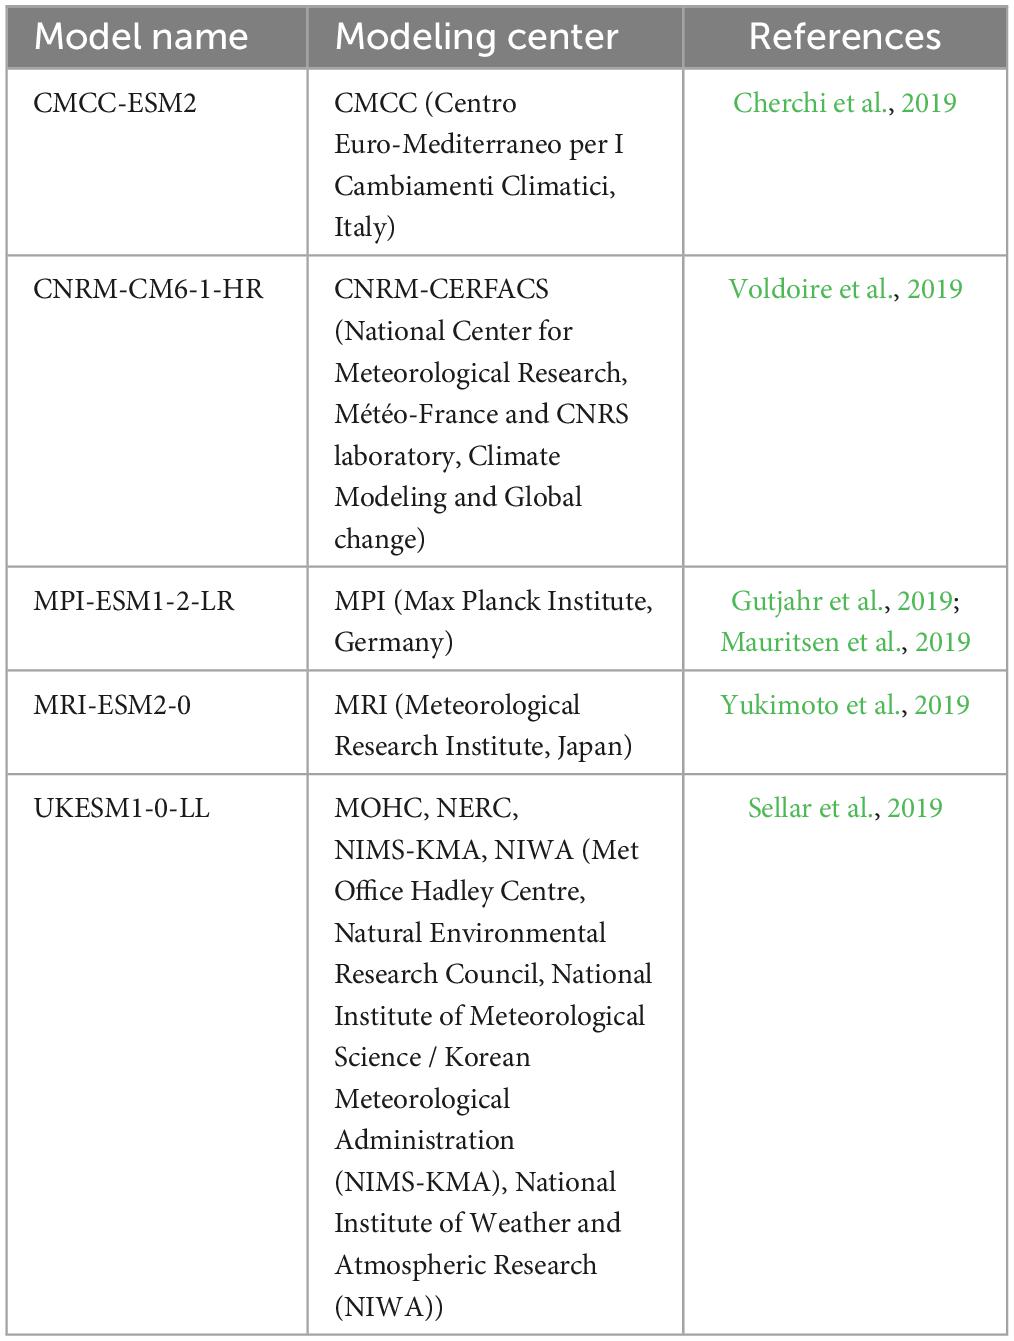
Table 2. Global climate models used for prediction of the potential distribution of Lecanosticta acicola.
The model’s results were clipped by the global distribution of pines (Earle, 2021) which resulted in maps of potential distribution of L. acicola. Potential distribution in the reference period was compared with the known distribution of L. acicola (Tubby et al., 2023) to get the realized distribution (Figure 1).
Uncertainty of the GCMs predictions were classified as (1) certain when all five GCMs predicted the same result, (2) low when one GCM had a different result, and (3) medium when two GCMs had different results.
2.7. Software
The database was prepared and managed in Microsoft SQL Server 2016 (version 13.0.6419.1). Variable selection was done using R statistical software (R Core Team, 2022). The models using machine learning methods were developed with Weka 3.8.6 (Hall et al., 2009; Frank et al., 2016), GLM was developed with R. Maps were drawn with ESRI ArcMap 10.6.1. Charts were drawn with R and Microsoft Excel version 2304.
3. Results
3.1. Selected variables and number of model cells
Eight of 44 independent variables were selected for the model development (Table 3).
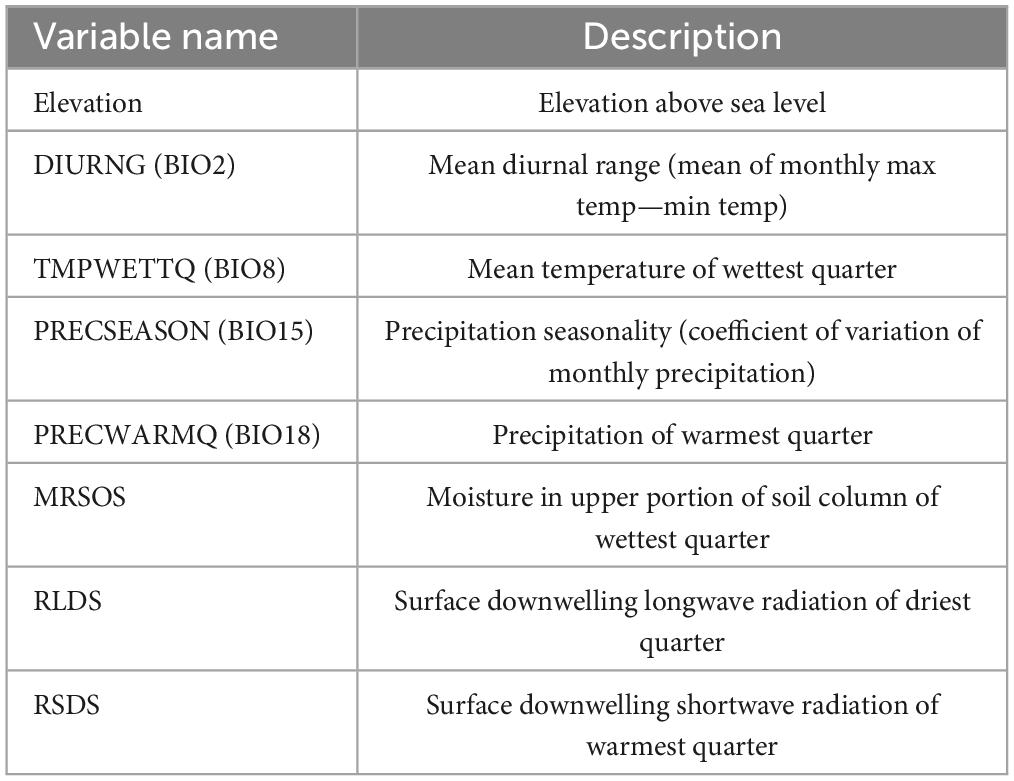
Table 3. Variables selected for model development.
There were 3,769 model cells covering the native and extralimital range of pines (Table 4). Europe and North America shared almost the same number of model cells containing pines, i.e., 33.1 and 32.5%, respectively. Asia followed with 25.6%. All other continents had a non-native distribution of pines covering under 5% of model cells.
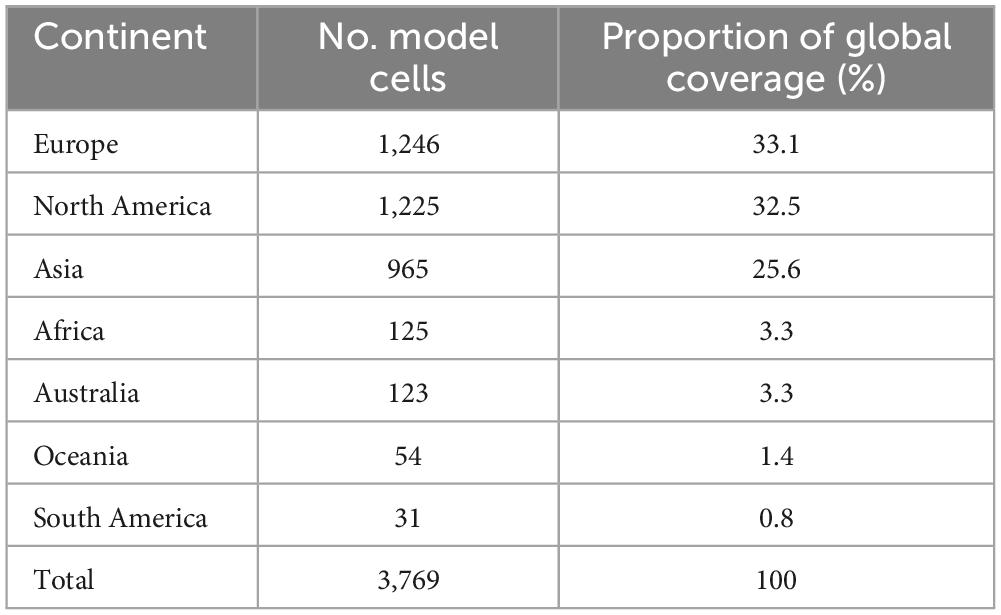
Table 4. Global distribution of Pinus species, by continent.
3.2. Performance of the models and variable importance
The worst performing model was GLM by almost all evaluation indicators. Individual classification trees performed better than GLM. Among individual classification trees, the best was LMT and the worst, random tree. The bagging approach performed better than individual classification trees and GLM. Among bagging the best classifier was random tree and the worst J48. Random forest performed nearly the same, but slightly better than bagging with LMT. The best model was bagging with random tree, with a very high AUC (0.938) and high precision (0.878). The best three models were selected for the climate change predictions: bagging—random tree, bagging—LMT, and random forest (Table 5).
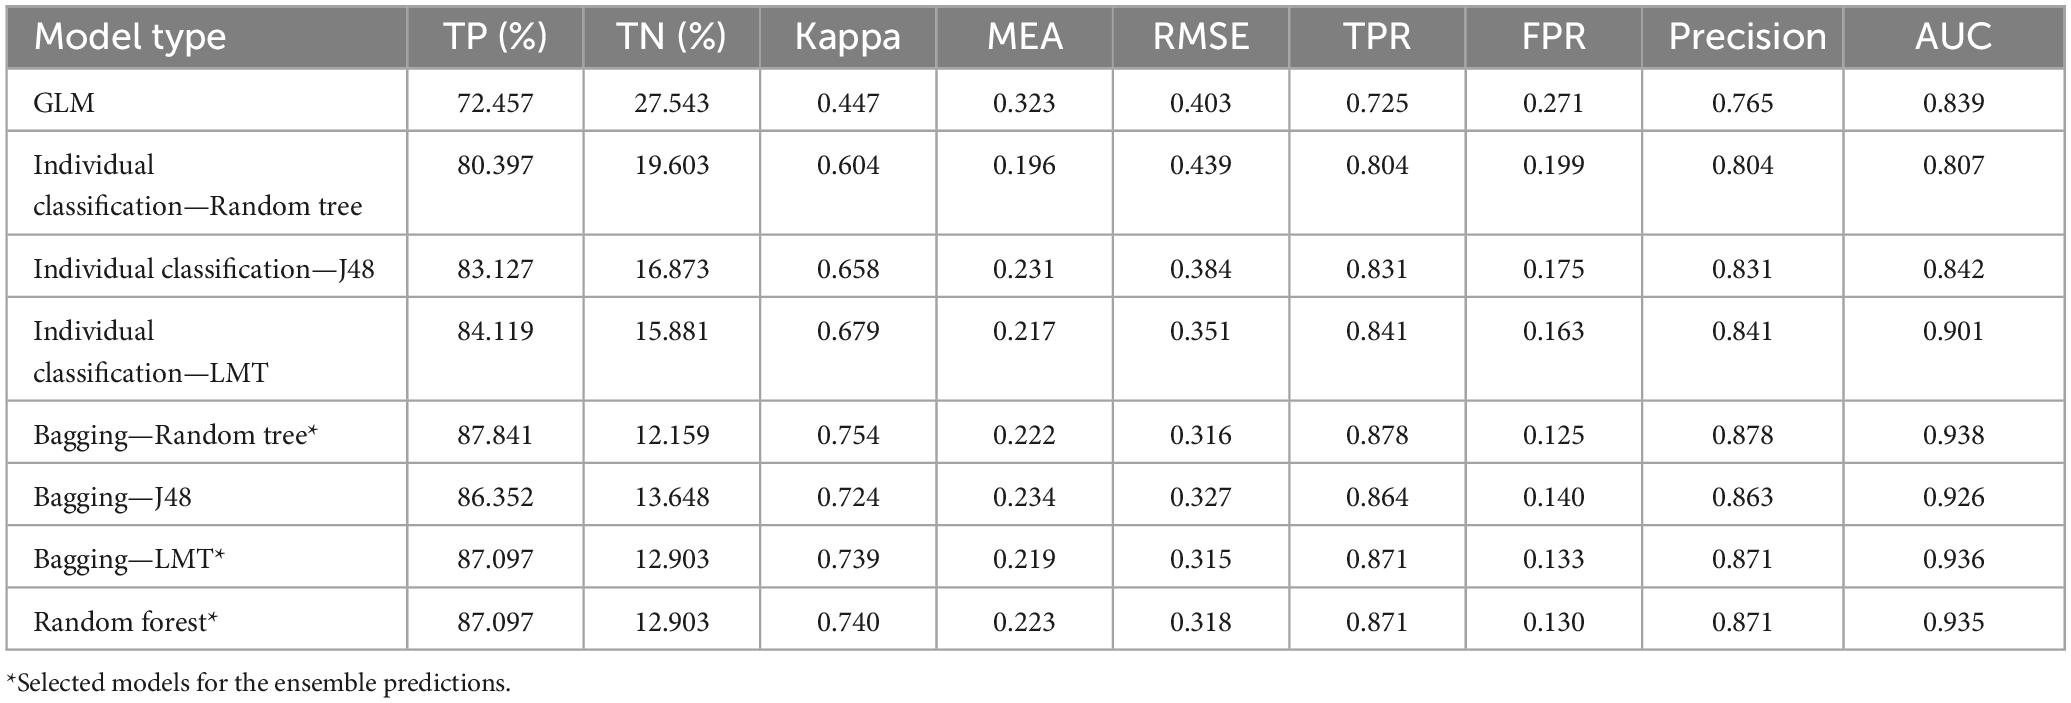
Table 5. Performance of the models.
Variable importance, based on average Gini impurity, ranged from 0.33 to 0.40. The most important variables were RLDS, DIURNG, and PRECWARMQ. Elevation and TMPWETTQ had nearly the same Gini impurity. PRECSEASON was also identified as important for L. acicola distribution. The least important variables were MRSOS and RSDS. However, differences between Gini impurities of the variables were small (Figure 3).
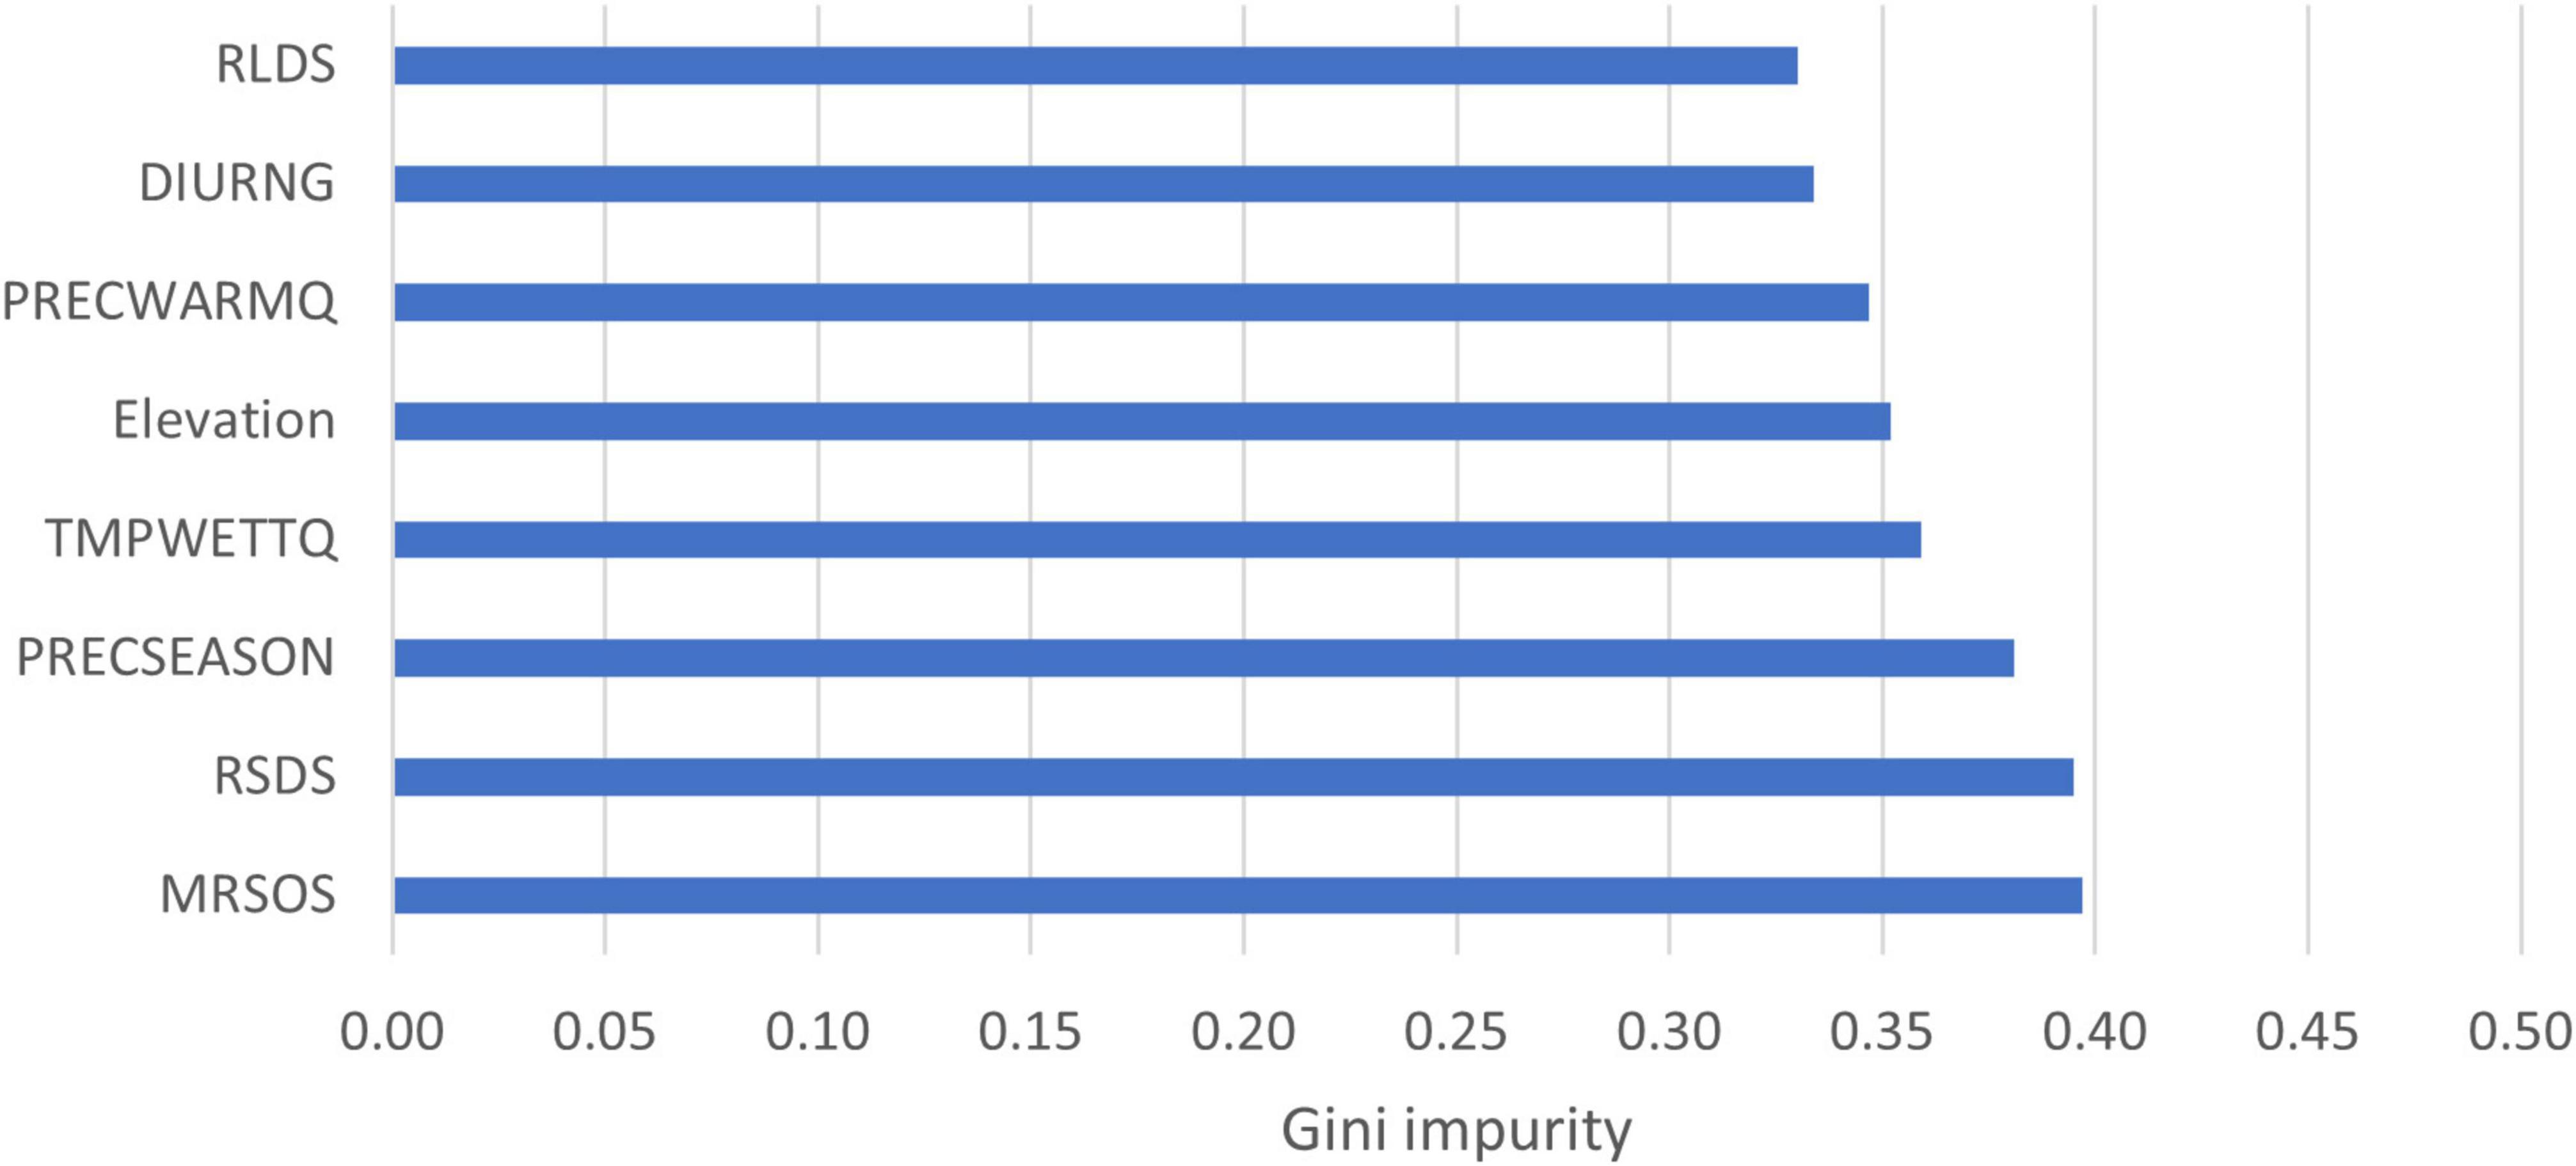
Figure 3. Attribute importance based on average Gini impurity decrease. RLDS, surface downwelling longwave radiation of driest quarter; DIURNG, mean diurnal range; PRECWARMQ, precipitation of warmest quarter; Elevation, height above sea level; TMPWETTQ, mean temperature of wettest quarter; PRECSEASON, precipitation seasonality; RSDS, surface downwelling shortwave radiation of warmest quarter; MRSOS, moisture in upper portion of soil column of wettest quarter.
3.3. Realized distribution in the reference period 1971–2000
Data on the occurrence of L. acicola were mainly from Europe and North America (Figure 4). BSNB was also detected in a small number of cases in Asia and South America, but not in Oceania and Africa. Most of the absence data were recorded in Europe. Absence data were available for all continents in the geodatabase.
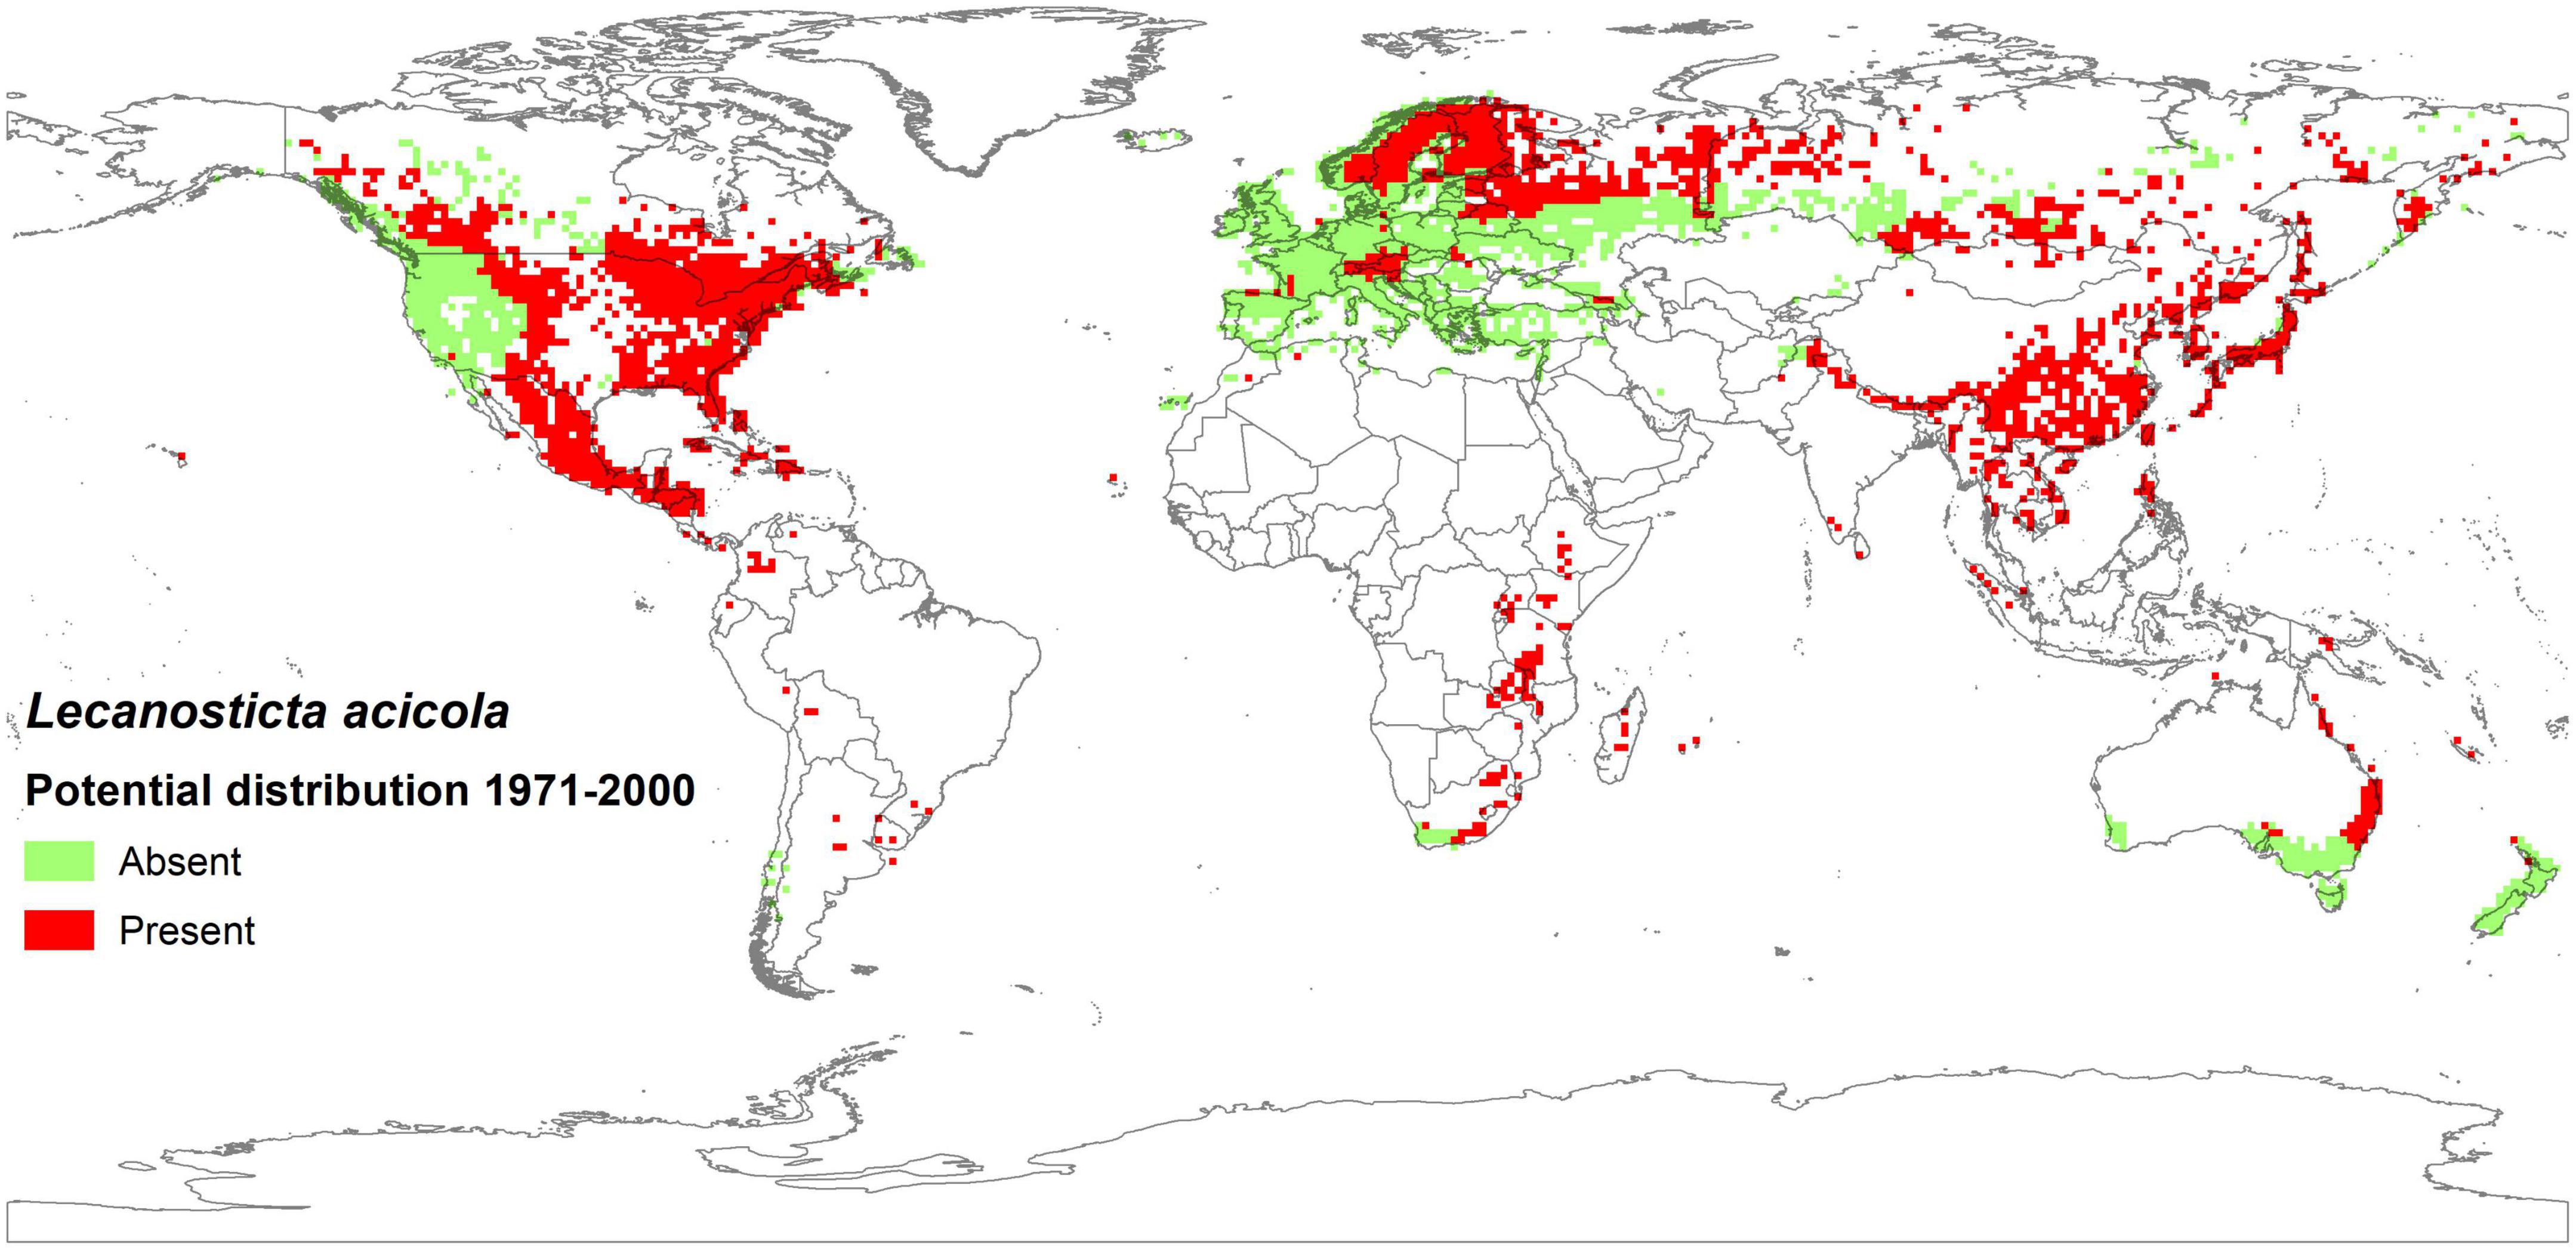
Figure 4. Potential distribution of Lecanosticta acicola on Pinus spp. illustrating the median predictions based on historical data of five GCMs in the reference period 1971–2000.
The actual distribution of L. acicola in the reference period covered 5.9% of Pinus spp. area globally (Tubby et al., 2023), but the model ensemble indicated suitable environmental conditions for the pathogen across 58.2% of Pinus spp. cover in this period (Figure 4).
The most suitable conditions for L. acicola in 1971–2000 were in Asia, North America and Africa, where the potential distribution was computed to cover 75, 69, and 62% of continental Pinus spp. area, respectively, taking into account the median of five GCMs and the RCP4.5 climate change scenario. In contrast, only 35% of Pinus spp. area in Europe fitted the model conditions of L. acicola in 1971–2000 (Figures 4, 7).
The comparison between the actual distribution and the potential distribution of L. acicola, taking into account median predictions based on historical data of five GCMs in the period 1971–2000, showed that 81.6% of model cells were classified correctly, i.e., 40.9% cells predicted to be absent for L. acicola and 40.7% present. In some cases, the model predicted presence of L. acicola but actual distribution data showed an absence of the disease (4.0% of model cells, false positive predictions). This type of potential expansion of actual range was mostly detected in Europe (13 model cells) and in Africa (three model cells). In contrast, in some locations the model ensemble predicted absence of the disease, but actual distribution showed presence (14.4% of model cells). These false negative median predictions were again, mostly in Europe (50 model cells), with a few in North America (six model cells) and Asia (one model cell) (Figure 5).
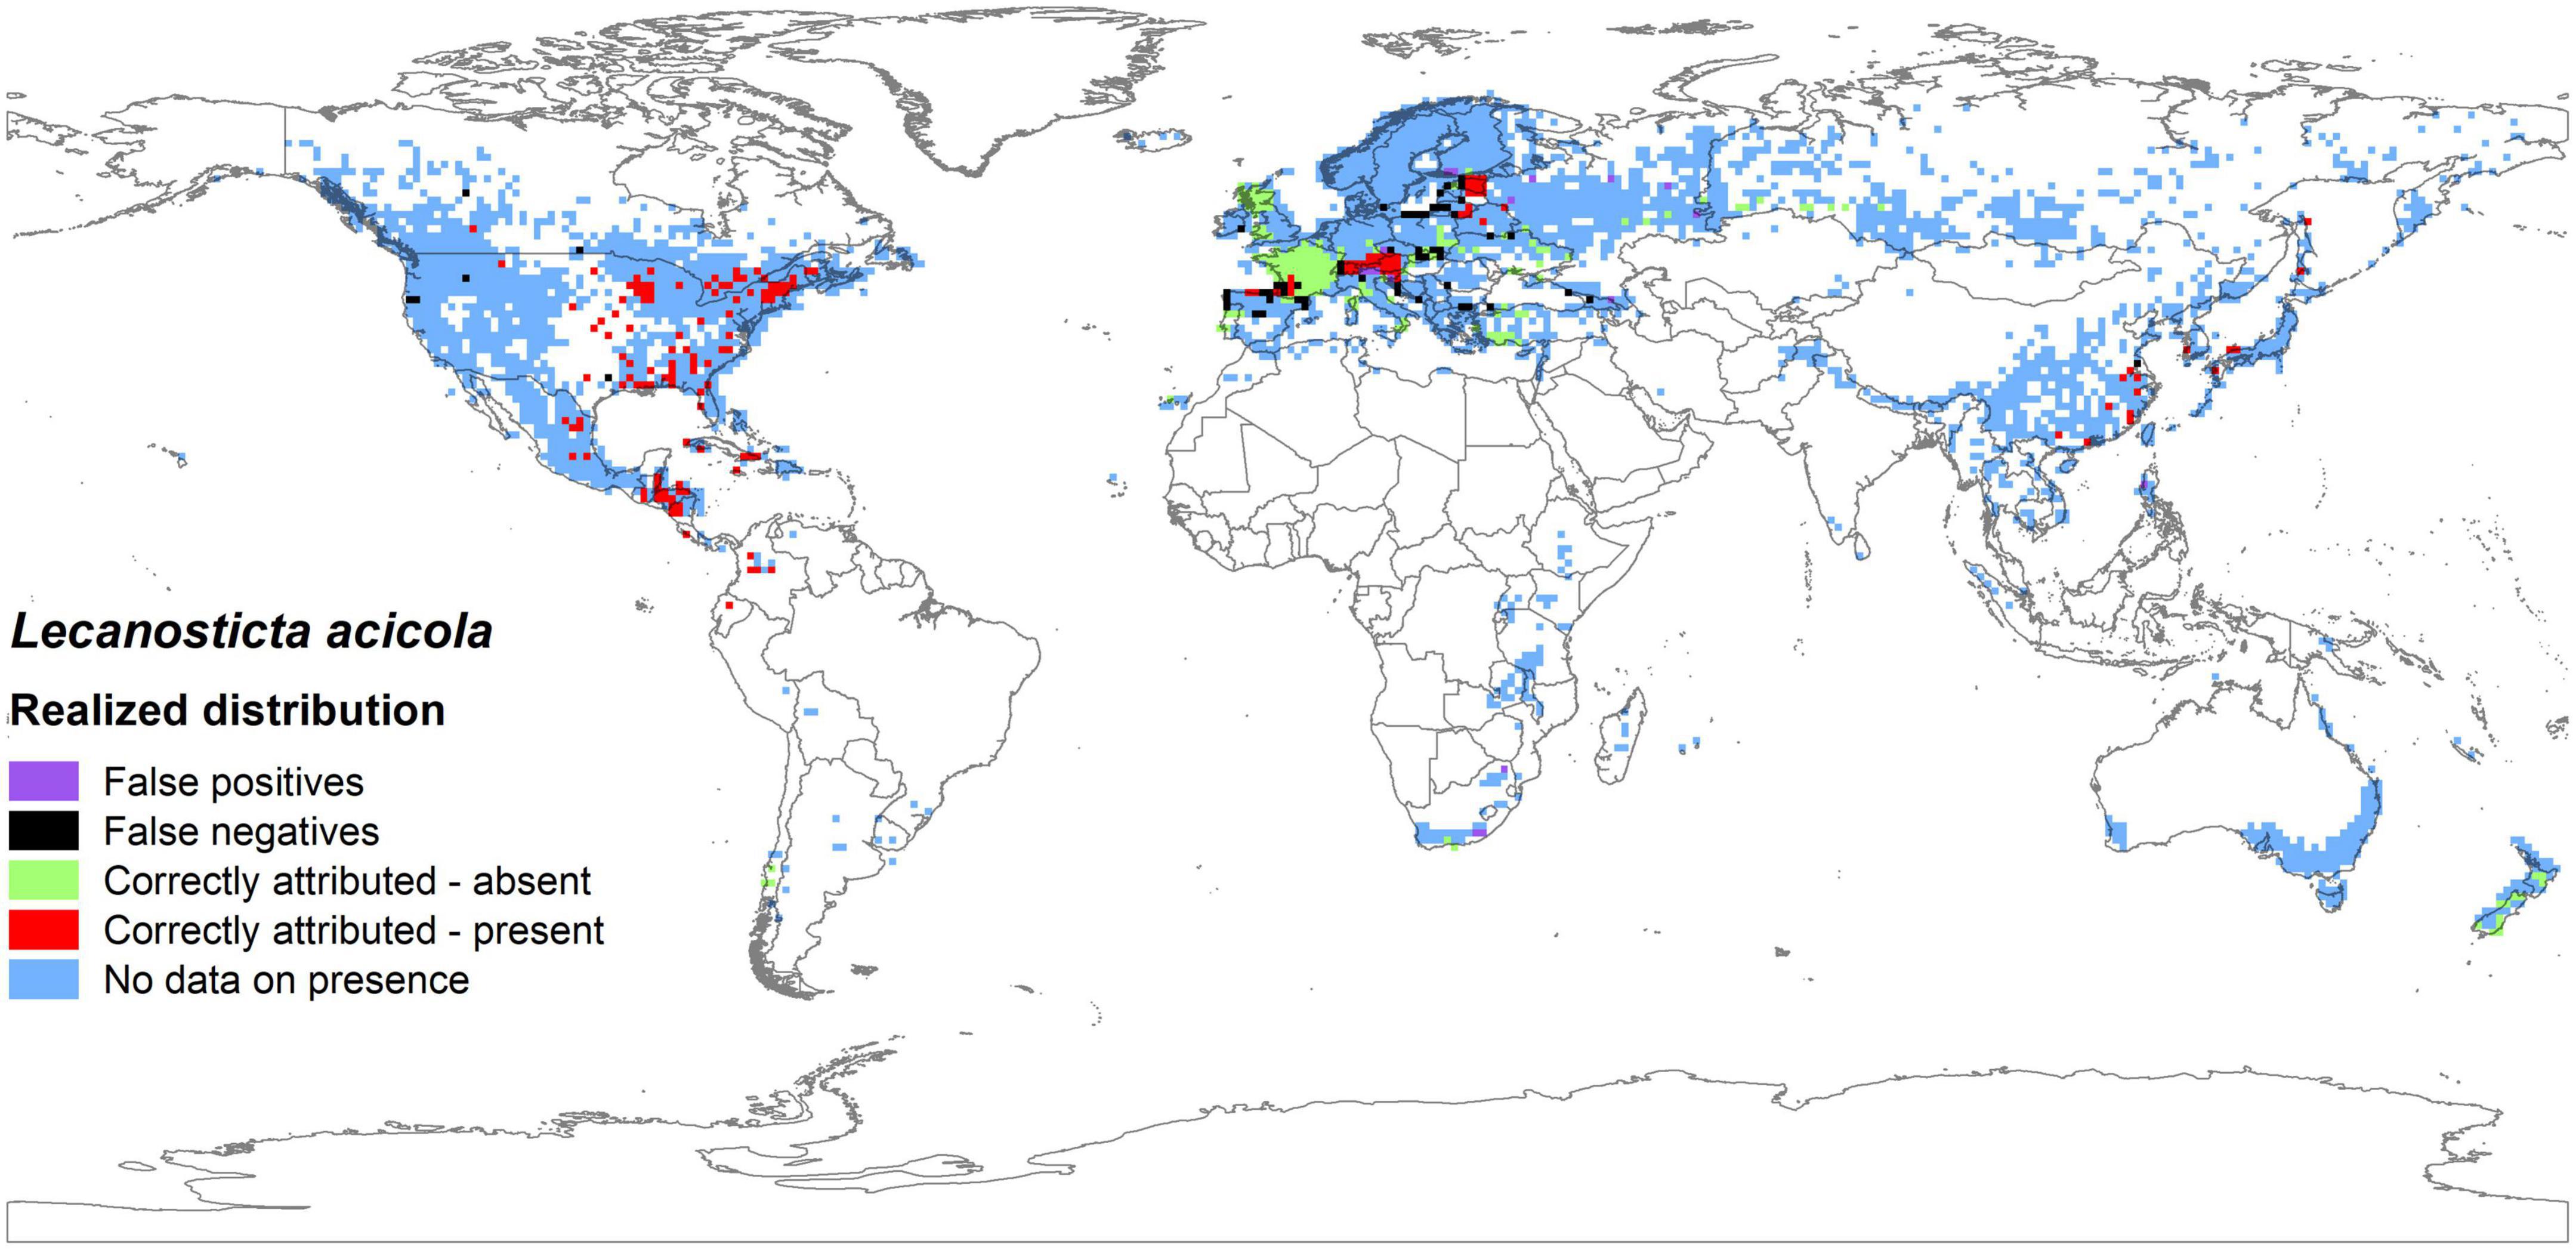
Figure 5. Comparison between actual and potential distribution of Lecanosticta acicola based on the median predictions from historical data of five GCMs in the reference period 1971–2000 (false positives illustrate where the model predicted presence, but actual distribution data show absence of disease; false negatives show where models predicted absence of the disease, but actual distribution showed presence).
Globally, actual distribution of L. acicola covered 10.1% of potential distribution in the reference period (Table 6). The highest realized distribution of L. acicola was determined in South America with disease known to be present in 22.7% of potentially suitable areas. In second place was Europe, with 21.1% of realized distribution. Asia had only 2.3% realized distribution. In Africa and Oceania, the disease was absent.
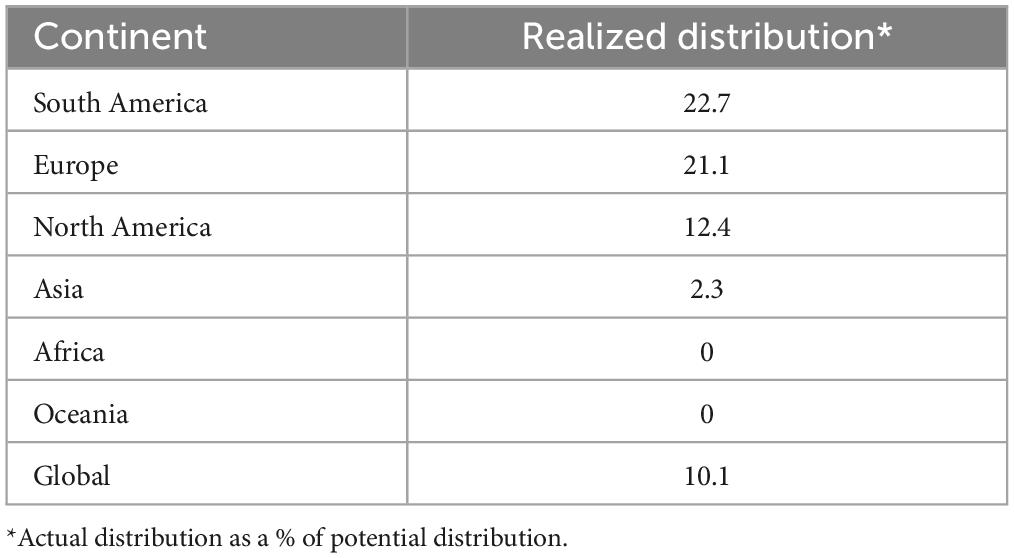
Table 6. Realized distribution of Lecanosticta acicola based on the median predictions from historical data of five GCMs in the reference period 1971–2000 by continent.
3.4. Range expansion predictions for climate change scenarios 2001–2100
The different climate change scenarios (five GCMs, three RCPs) showed a positive trend in possible range expansion of L. acicola for the period 2001–2100. The average model predictions toward the end of the century (2071–2100) show the potential distribution of L. acicola rising to 62.2, 61.9, 60.3% of Pinus spp. area for RCP2.6, RCP4.5, RCP8.5, respectively. Predictions for different RCPs were almost consistent up to 2031, smaller differences are expected after 2031. However, on a global scale the relative change in median prediction from 2001 to 2100 was only 4.0, 3.7, 2.1% of Pinus spp. area for RCP2.6, RCP4.5, RCP8.5, respectively. In contrast, the 95% confidence interval was 35.7–82.3% of Pinus spp. area in the period 1971–2000 and 33.6–85.8% in the period 2071–2100 (Figure 6).
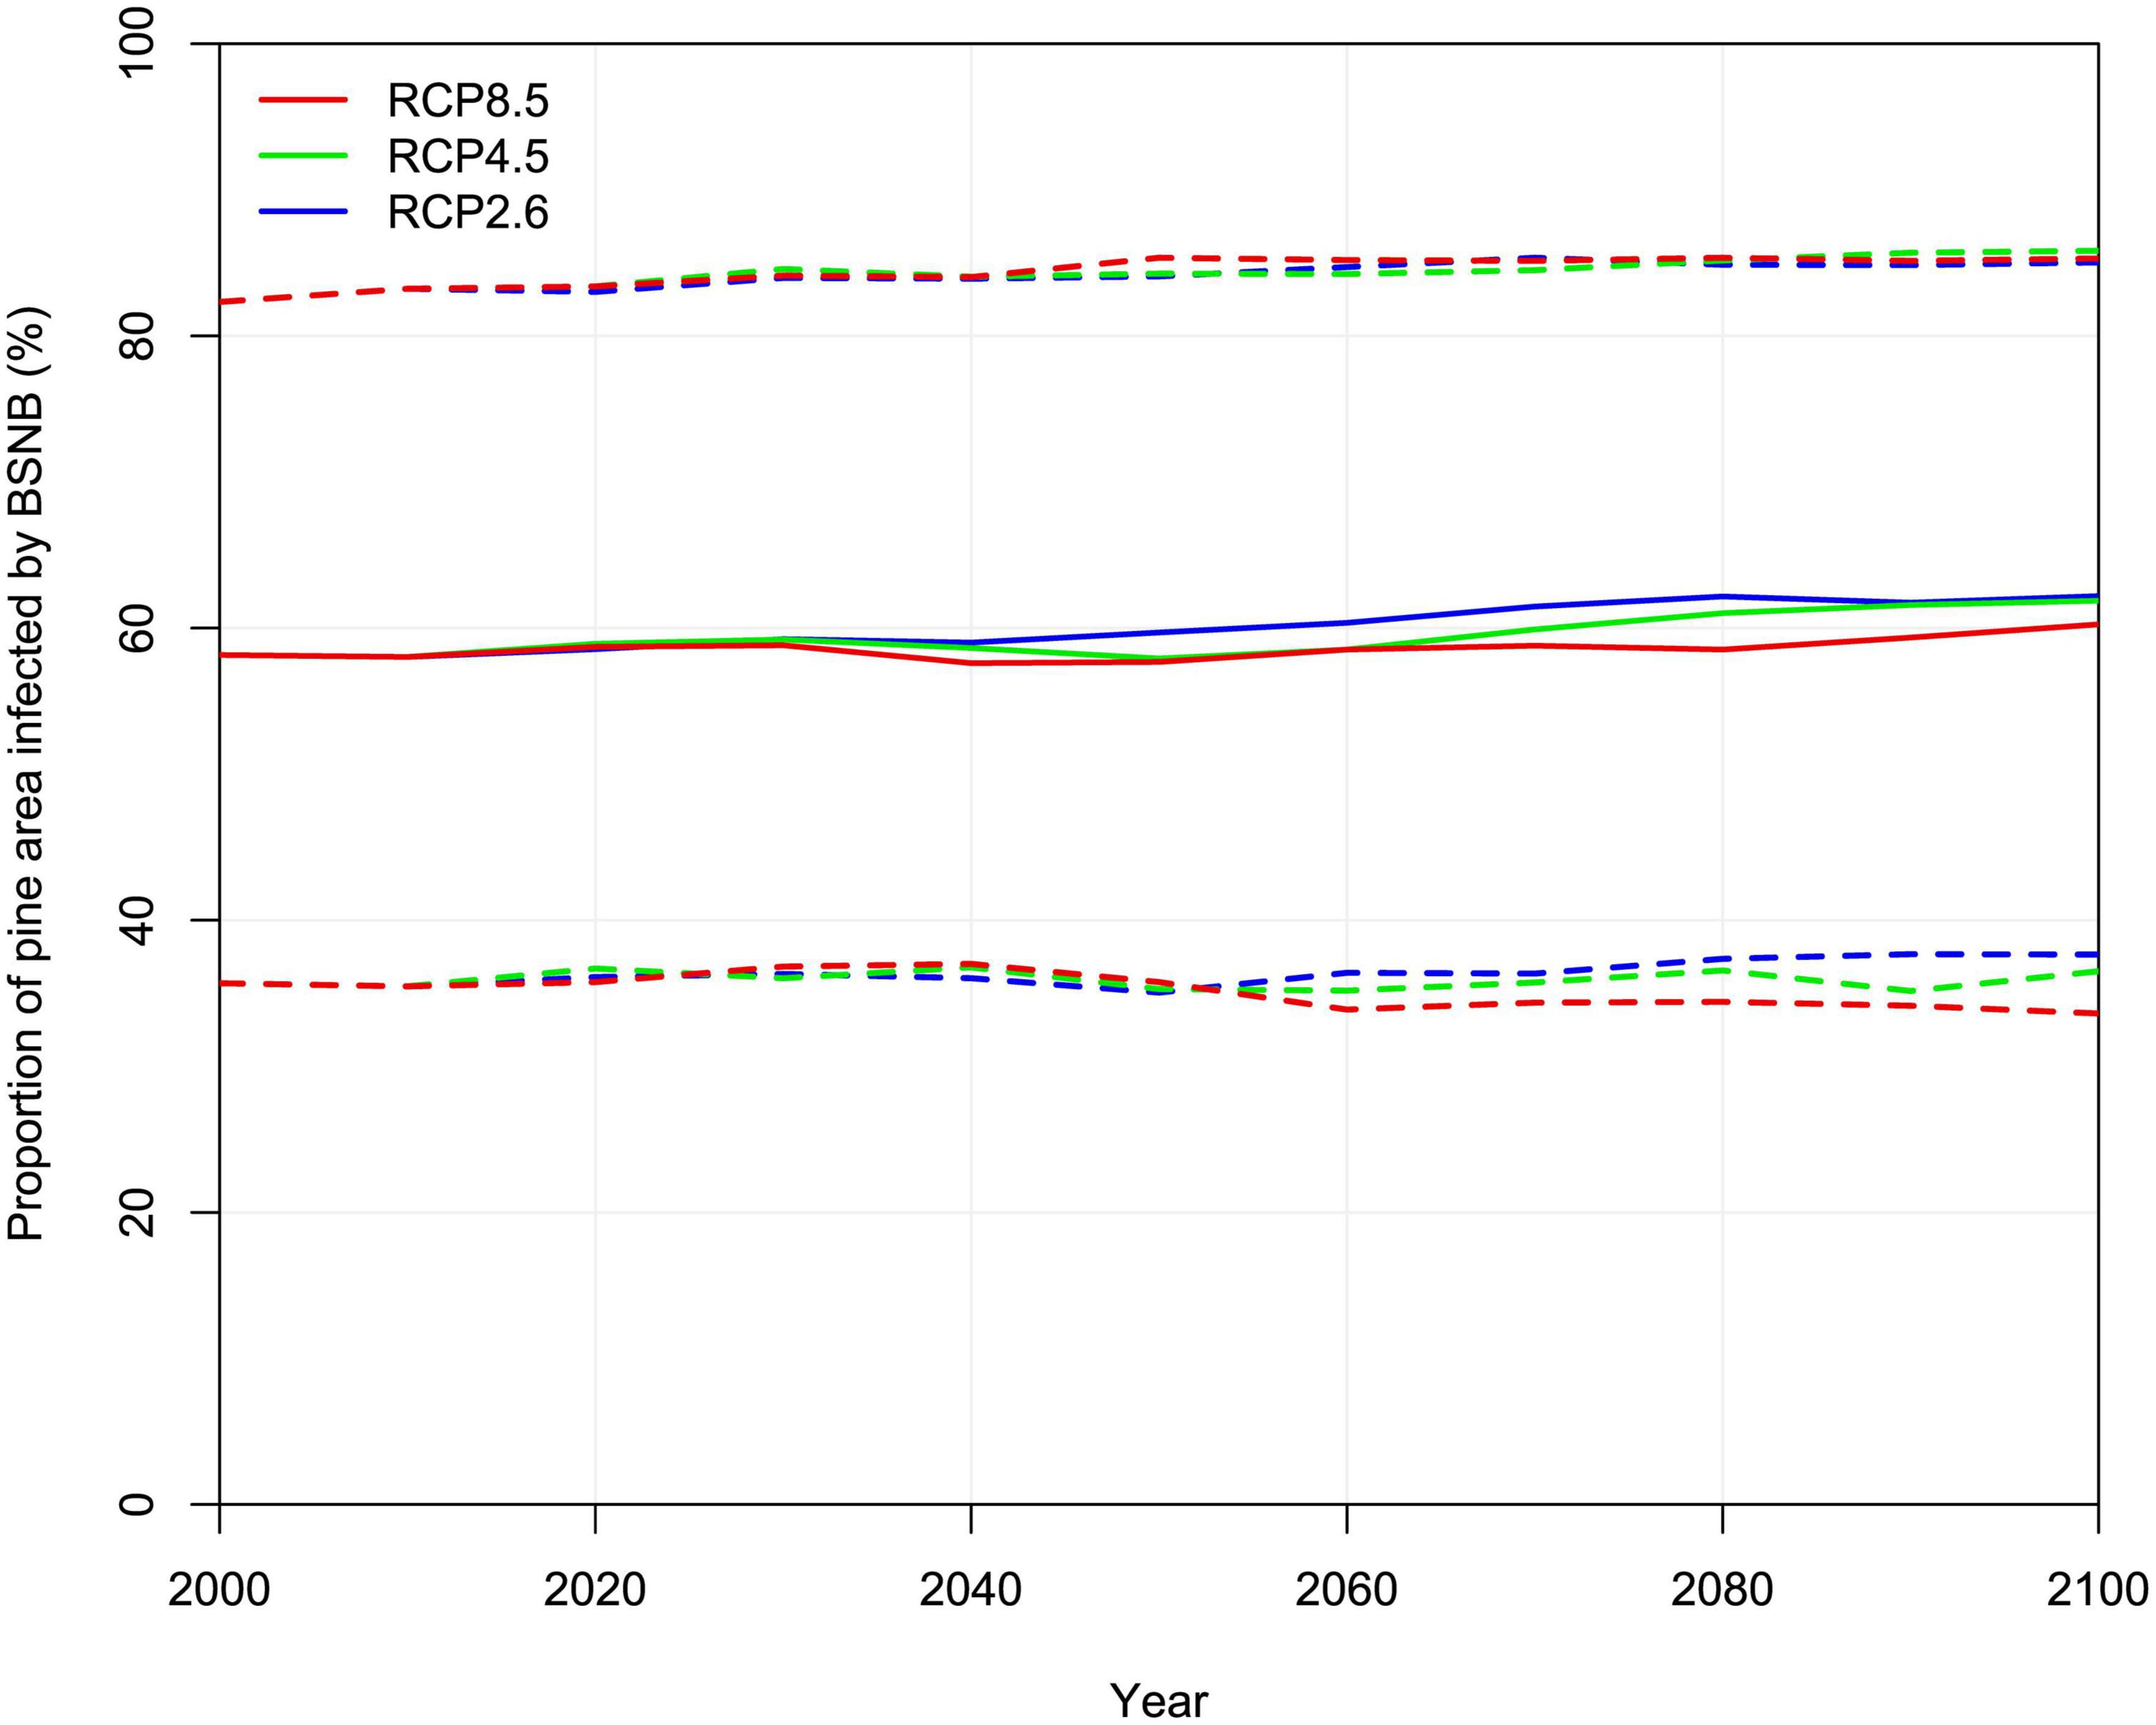
Figure 6. Potential global distribution of Lecanosticta acicola according to three RCPs climate change scenarios expressed as % of global pine area for 30-year periods (value at 2100 is a prediction for 2071–2100). Solid lines depict median values of the five GCMs, dashed lines show 95% confidence interval.
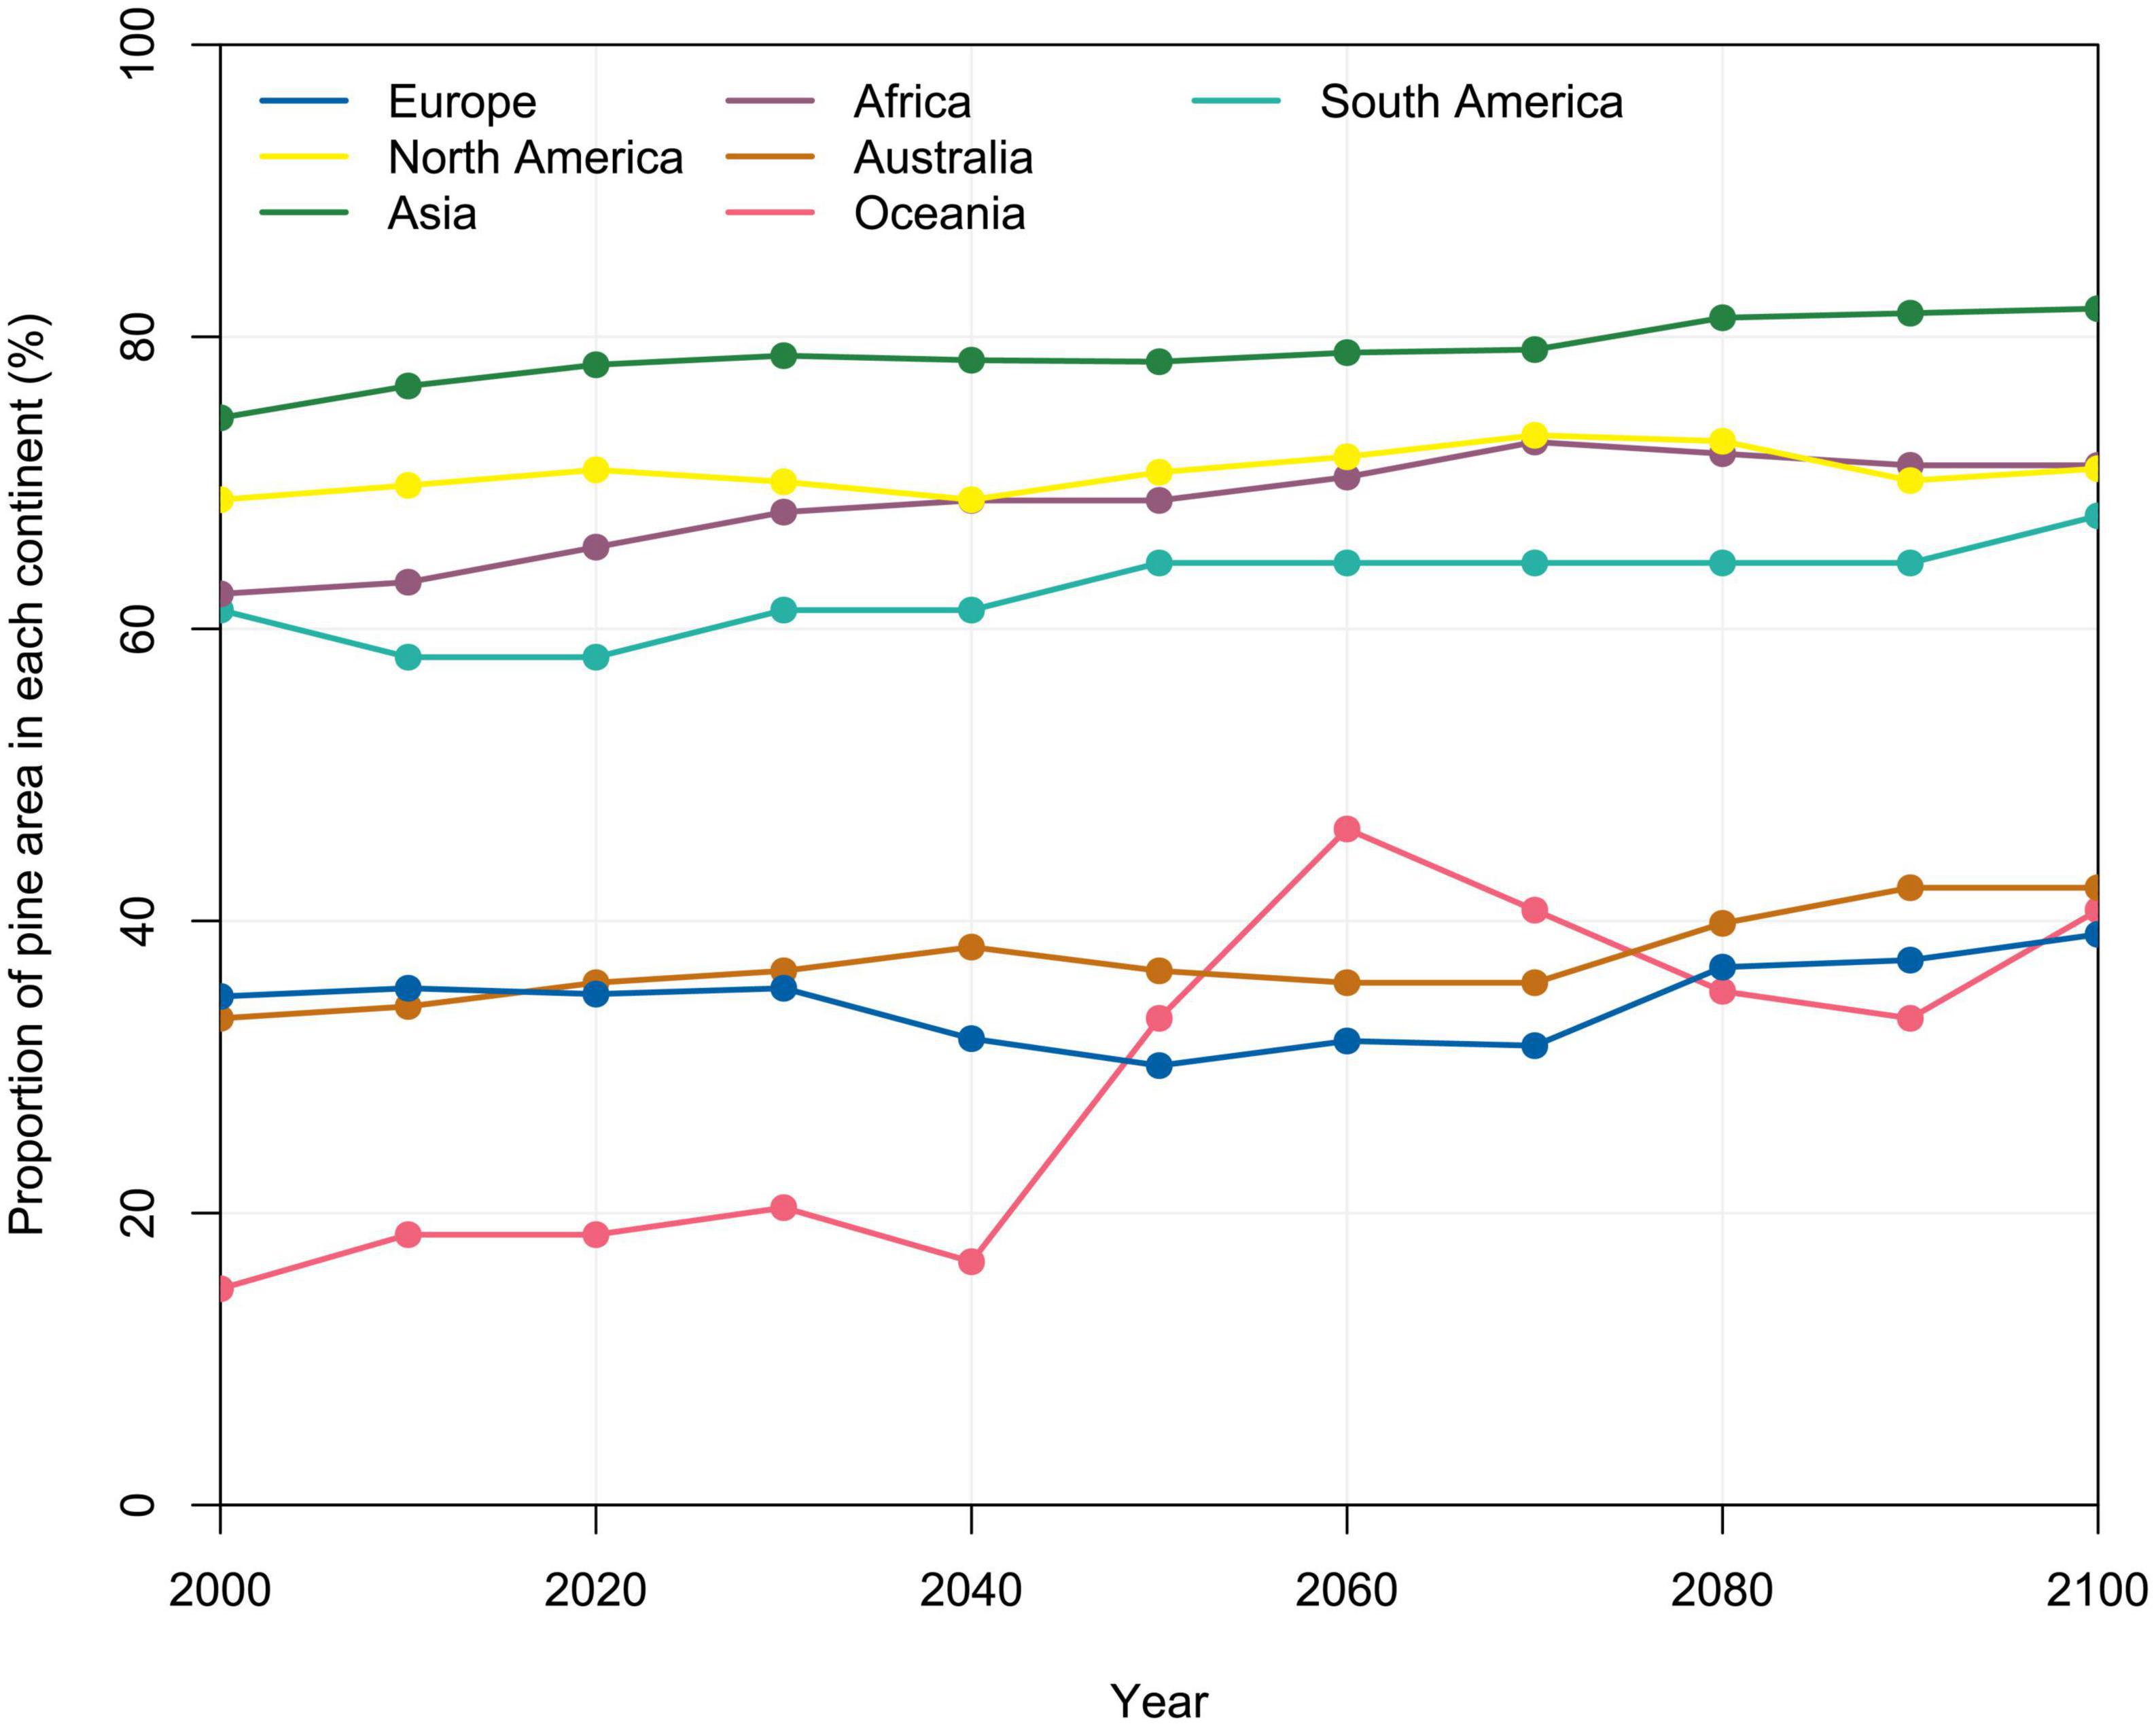
Figure 7. Potential distribution of Lecanosticta acicola according to the median of five GCMs and the RCP4.5 climate change scenario across different continents, expressed as the proportion of Pinus spp. area in each continent (%) for 30-year periods (value at 2100 is a prediction for 2071–2100).
The linear relationship between diseased pine area and time was statistically significant (p < 0.001). Linear correlation for all three RCPs was positive and very high to medium, i.e., Pearson correlation coefficient measured 0.97, 0.84, 0.64 for RCP2.6, RCP4.5, RCP8.5, respectively. The average increase of potential global distribution of L. acicola measured 0.05, 0.04, and 0.01% per year for RCP2.6, RCP4.5, RCP8.5, respectively.
On all continents potential distribution of L. acicola will be higher at the end of 21st century than in the reference period 1971–2000. The highest relative change in the potential distribution of L. acicola, compared to the potential distribution in 2000, considering the median of five GCMs and the RCP4.5 climate change scenario until the end of 21st century, is expected in Oceania, Australia, and Africa with 175, 26.8, and 14.1% increases, respectively, compared to the potential distribution in 1971–2000. By 2071–2100 the model predicts an increase in the potential distribution of L. acicola of 12.2% in Europe, 10.5% in South America and 10.0% in Asia. In North America a negligible change of 3.1% is expected. Intriguingly, the potential distribution of L. acicola in Europe generally decreases between 2040 and 2070, although thereafter rapidly rises from 2071 to 2100 (Figure 7).
A spatial comparison between the potential distribution of L. acicola in the reference period 1971–2000 and the median prediction of five GCMs considering RCP4.5 in the period 2071–2100 showed that most of the model cells (87.7%) will not change status (i.e., presence/absence of L. acicola will not change). The model predicted that L. acicola could expand its potential distribution to an additional 8.0% of Pinus spp. area, to cover a total of 61.9% of Pinus spp. area. Most of this expansion was registered in Europe (3.2%), Asia (2.1%), and North America (1.8%). Expansion was detected in a northward direction in the Northern Hemisphere, and southward in the Southern Hemisphere. A reduction in the potential distribution of the disease was predicted in 4.3% of model cells, mostly in Europe (2.6%), North America (1.3%) and Asia (0.3%) (Figure 8).
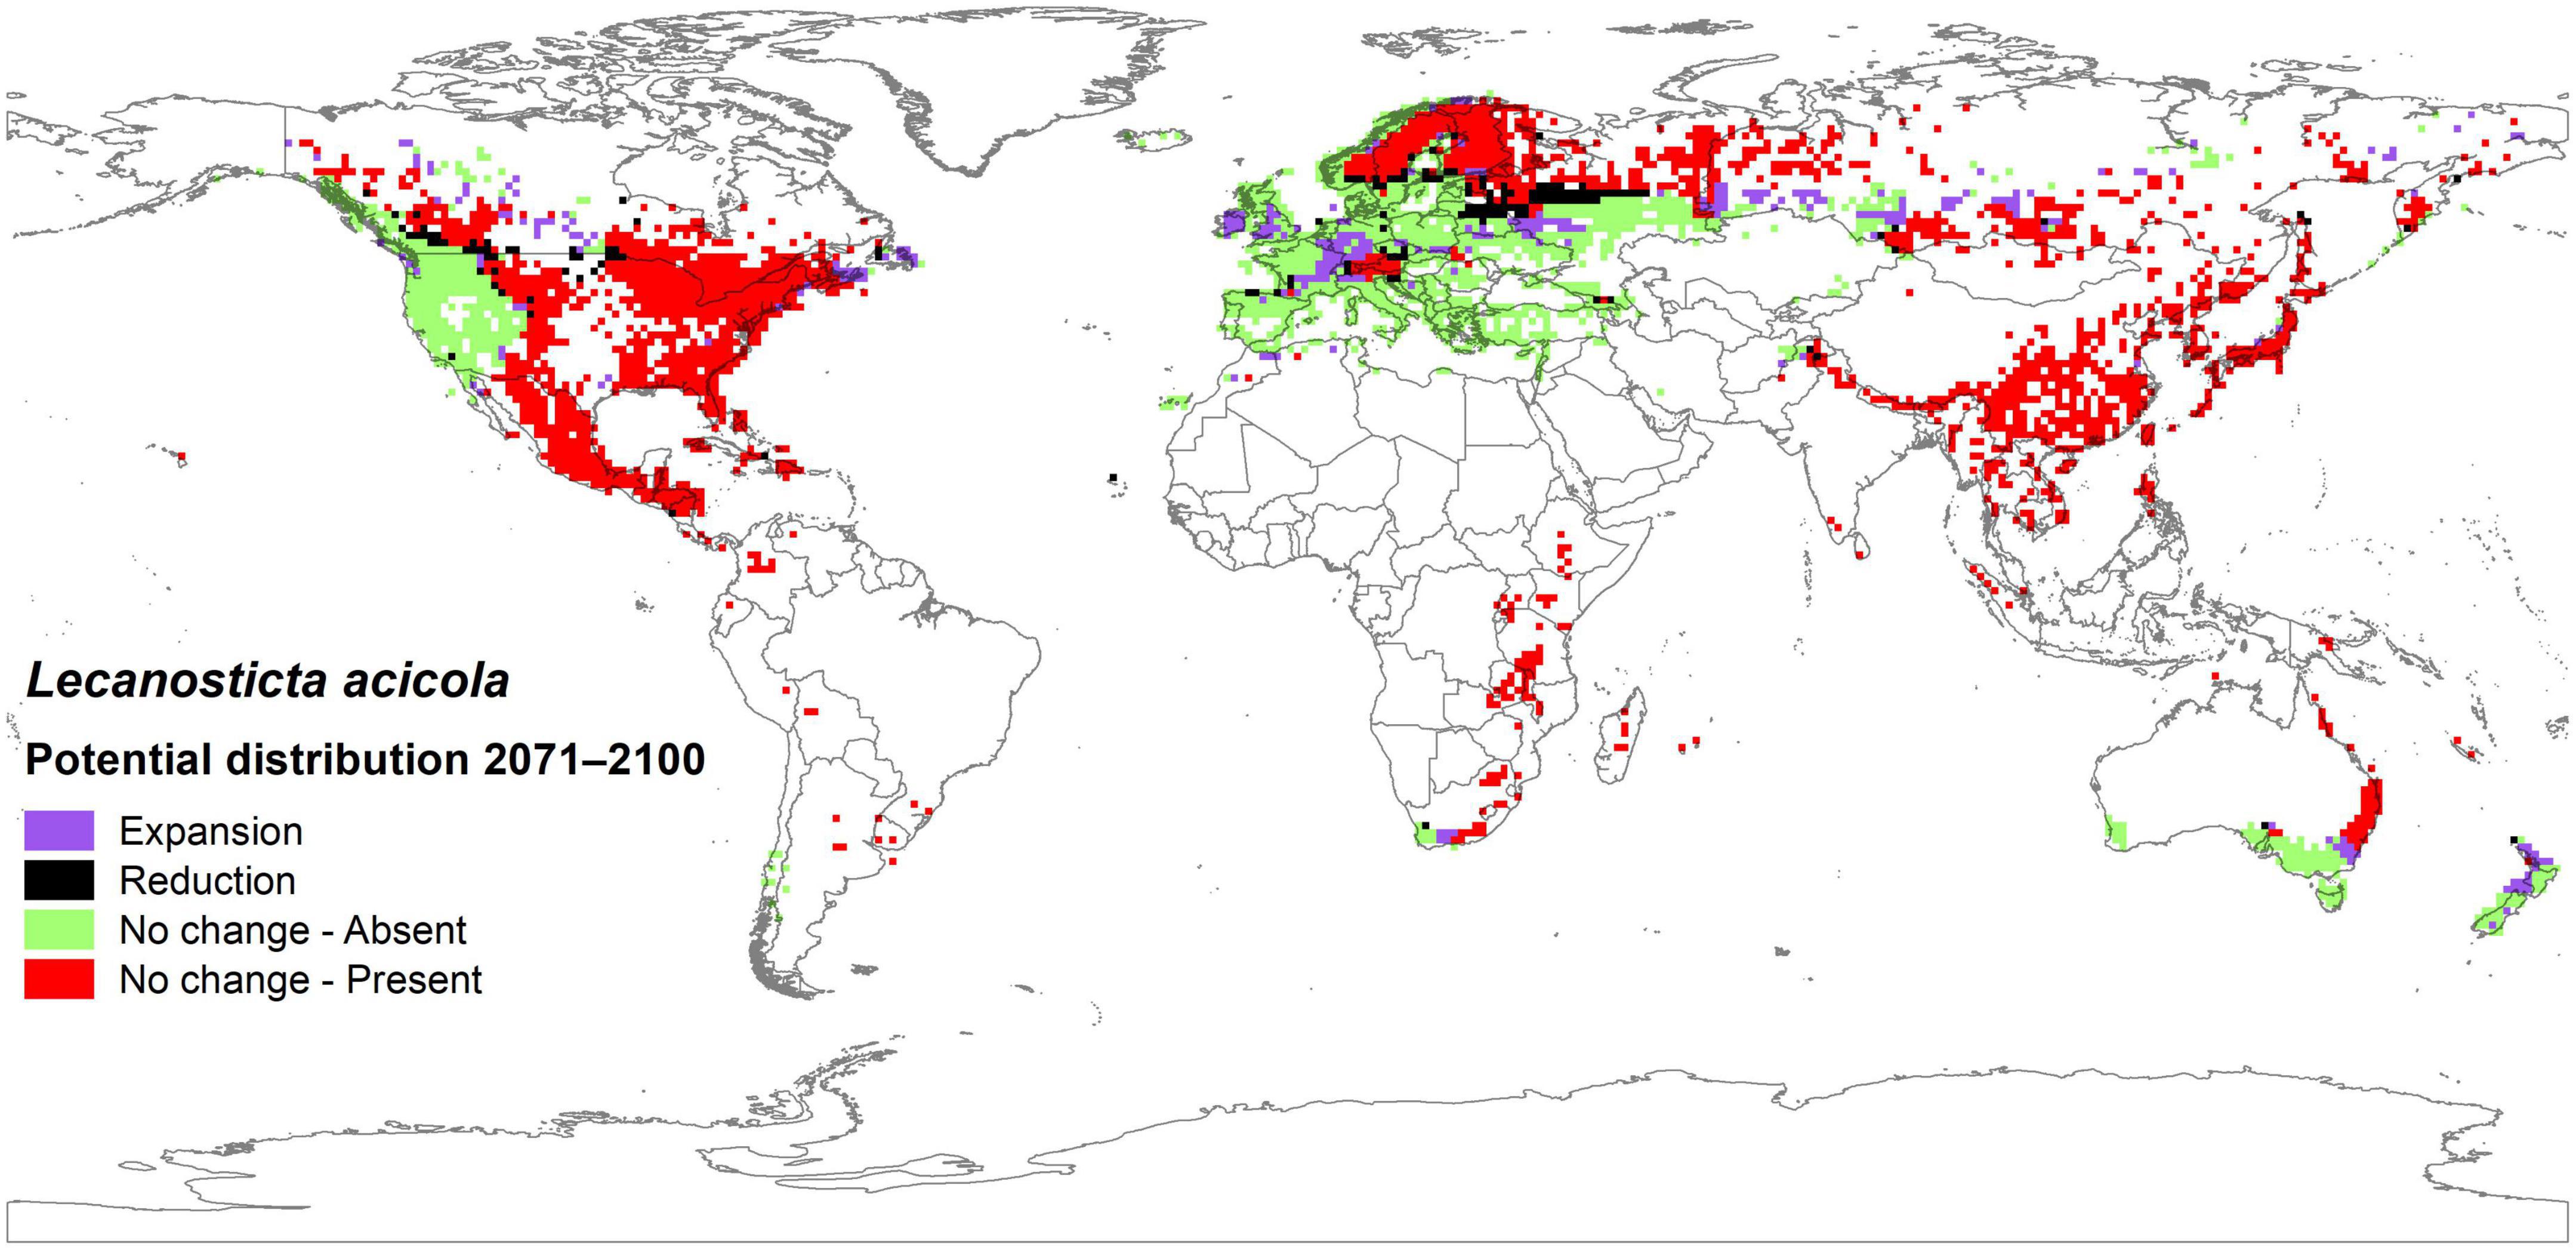
Figure 8. Potential distribution of Lecanosticta acicola based on median predictions from five GCMs, with RCP4.5 in the period 2071–2100 compared to the potential distribution in the reference period 1971–2000.
Each model’s cell uncertainty of GCMs predictions was classified as low and medium as described in the methods. Low and medium uncertainty of GCMs predictions were identified in 46.7–51.8% of model cells for three RCPs in the period 1971–2100 (Figure 9). The lowest uncertainty was for RCP2.6 and the highest for RCP8.5, although differences between RCP uncertainties were small. Uncertainty increased from 1971 to 2100.
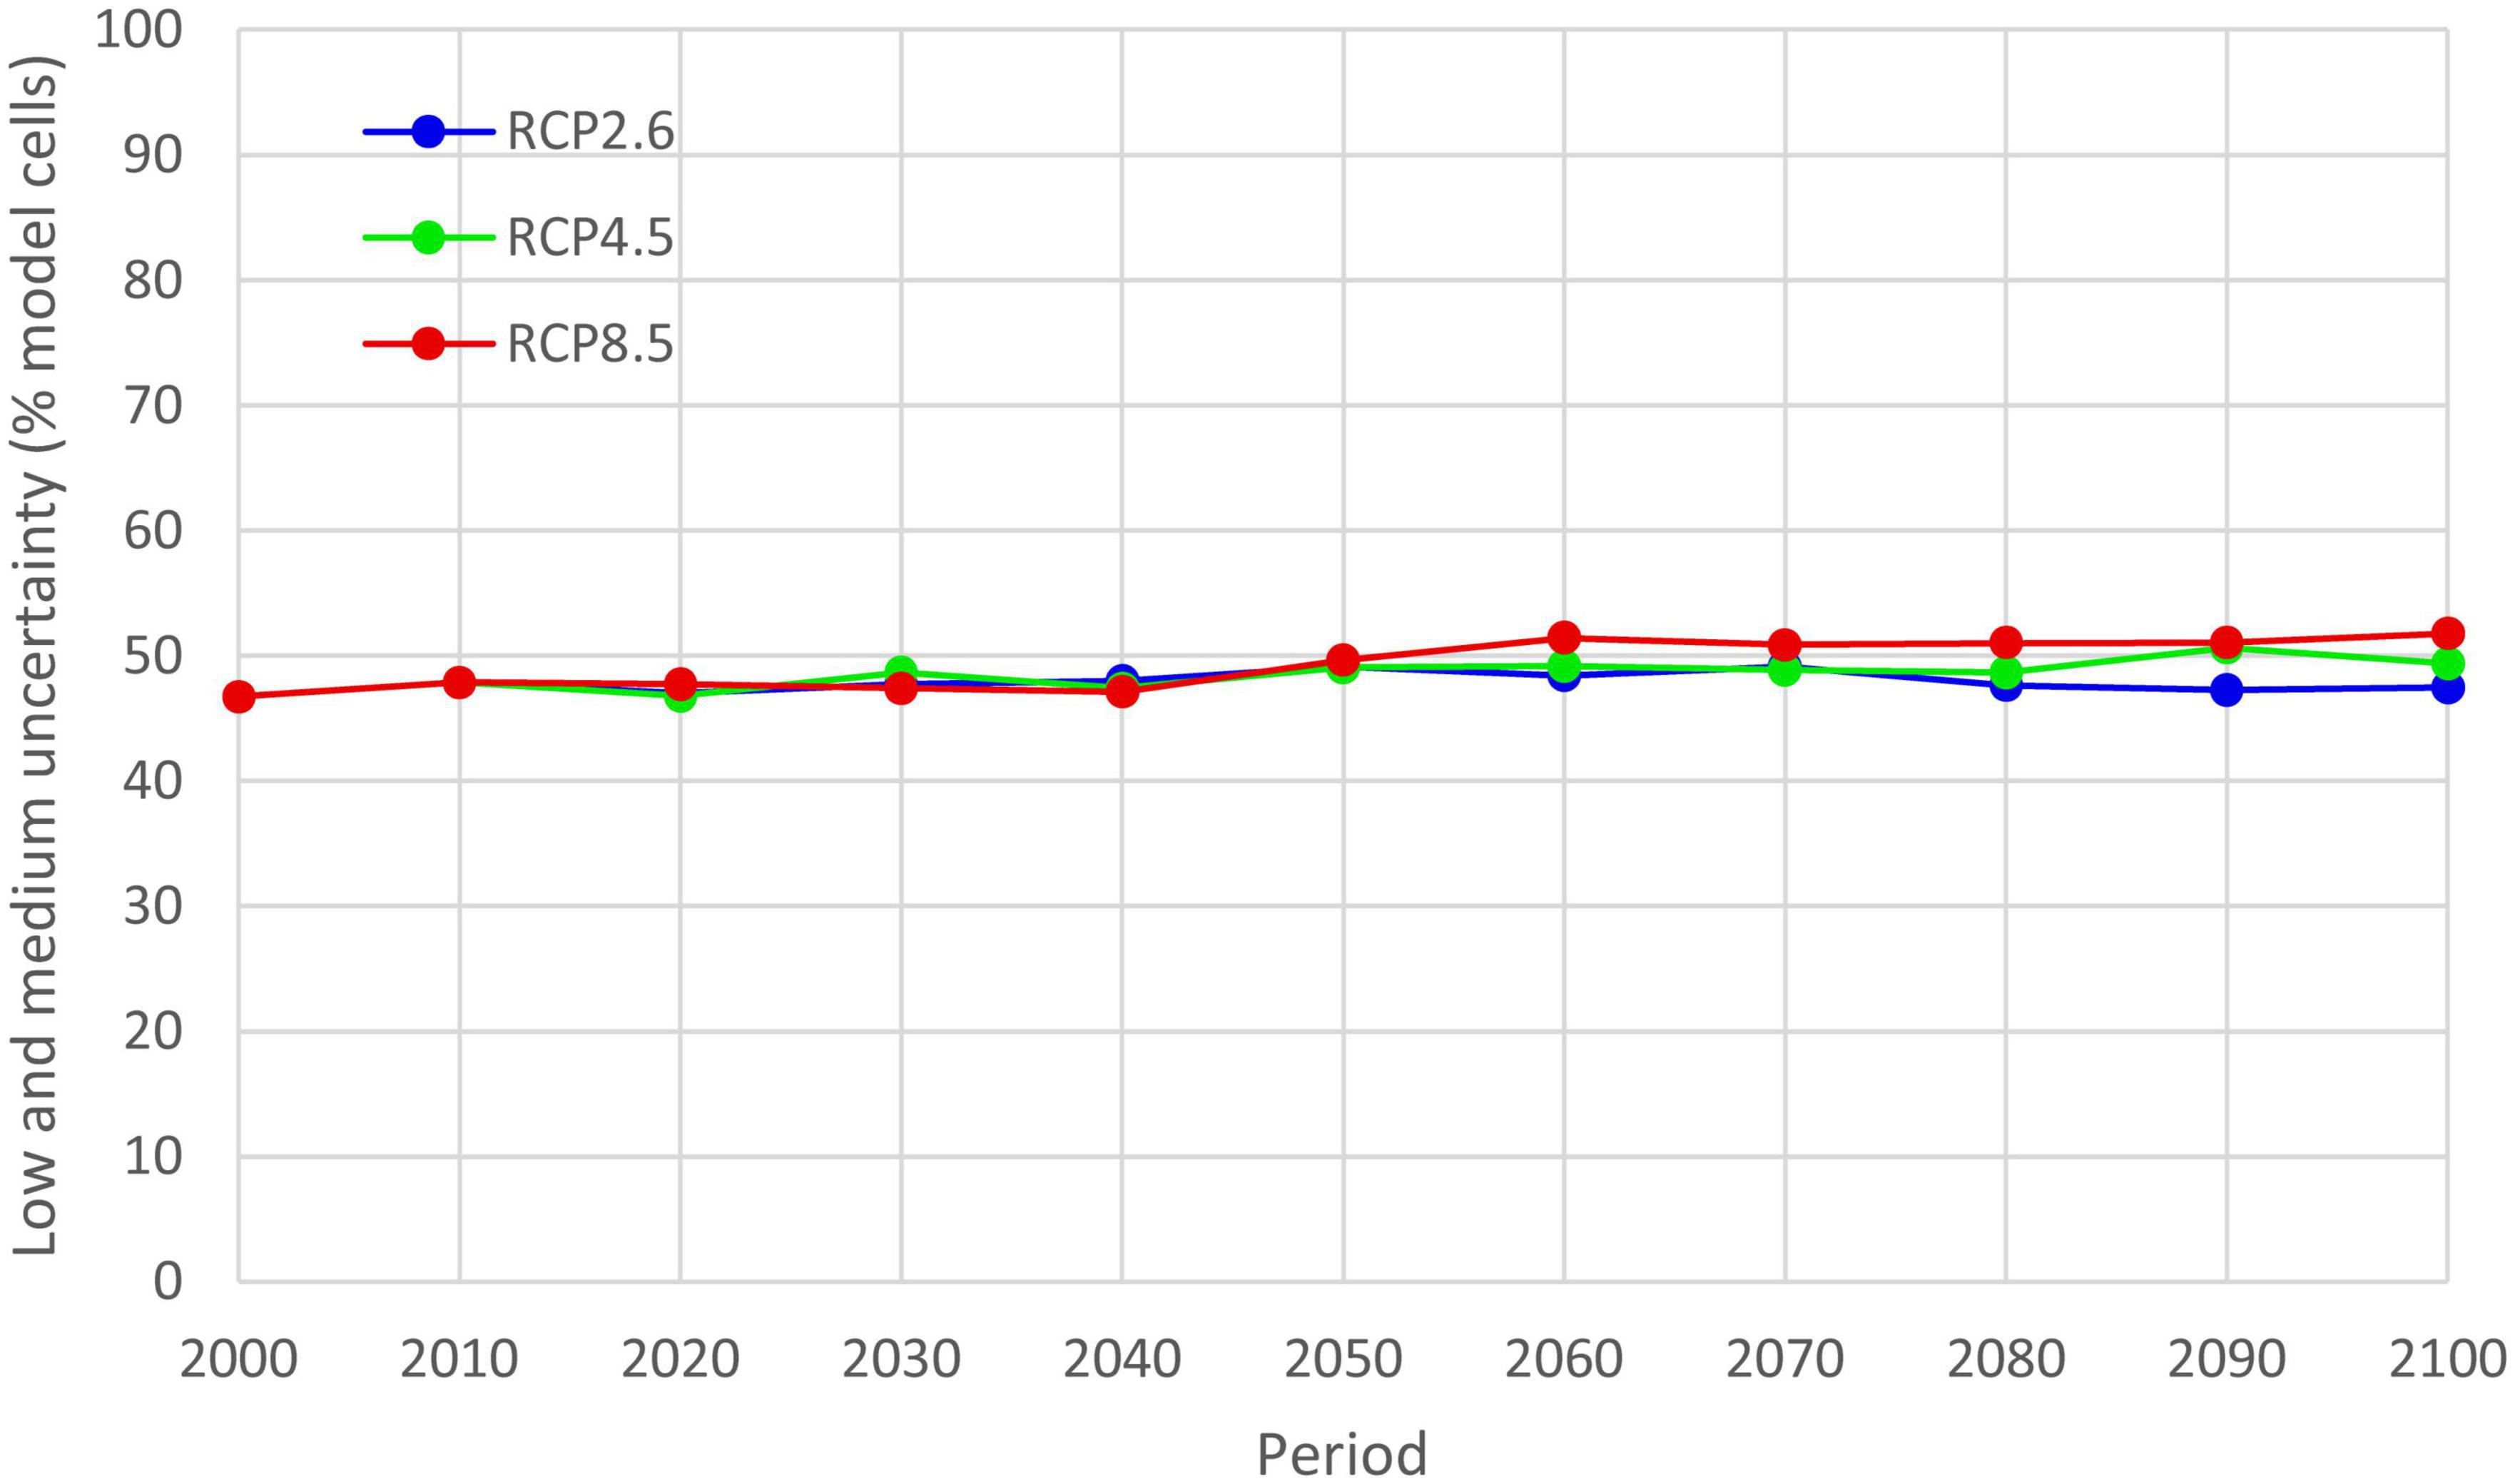
Figure 9. Uncertainty of the five GCMs predictions of potential distribution of Lecanosticta acicola for three RCPs in the period 1971–2100 illustrating increasing levels of uncertainty with time. Low and medium uncertainty are classes of uncertainty depicting that one or two GCMs had different results.
The highest uncertainty of the predictions was for Oceania and Europe and the lowest for Australia and South America (Figure 10). Australia, South America, Africa and Asia had similar uncertainties of the model ensemble predictions, e.g., uncertainty for 2071–2100 for those continents ranged from 22.6 to 34.6%. Uncertainty of the predictions for North America was medium. Uncertainty in model predictions increased over the period 1971–2100 for all continents except South America, where levels of uncertainties decreased.
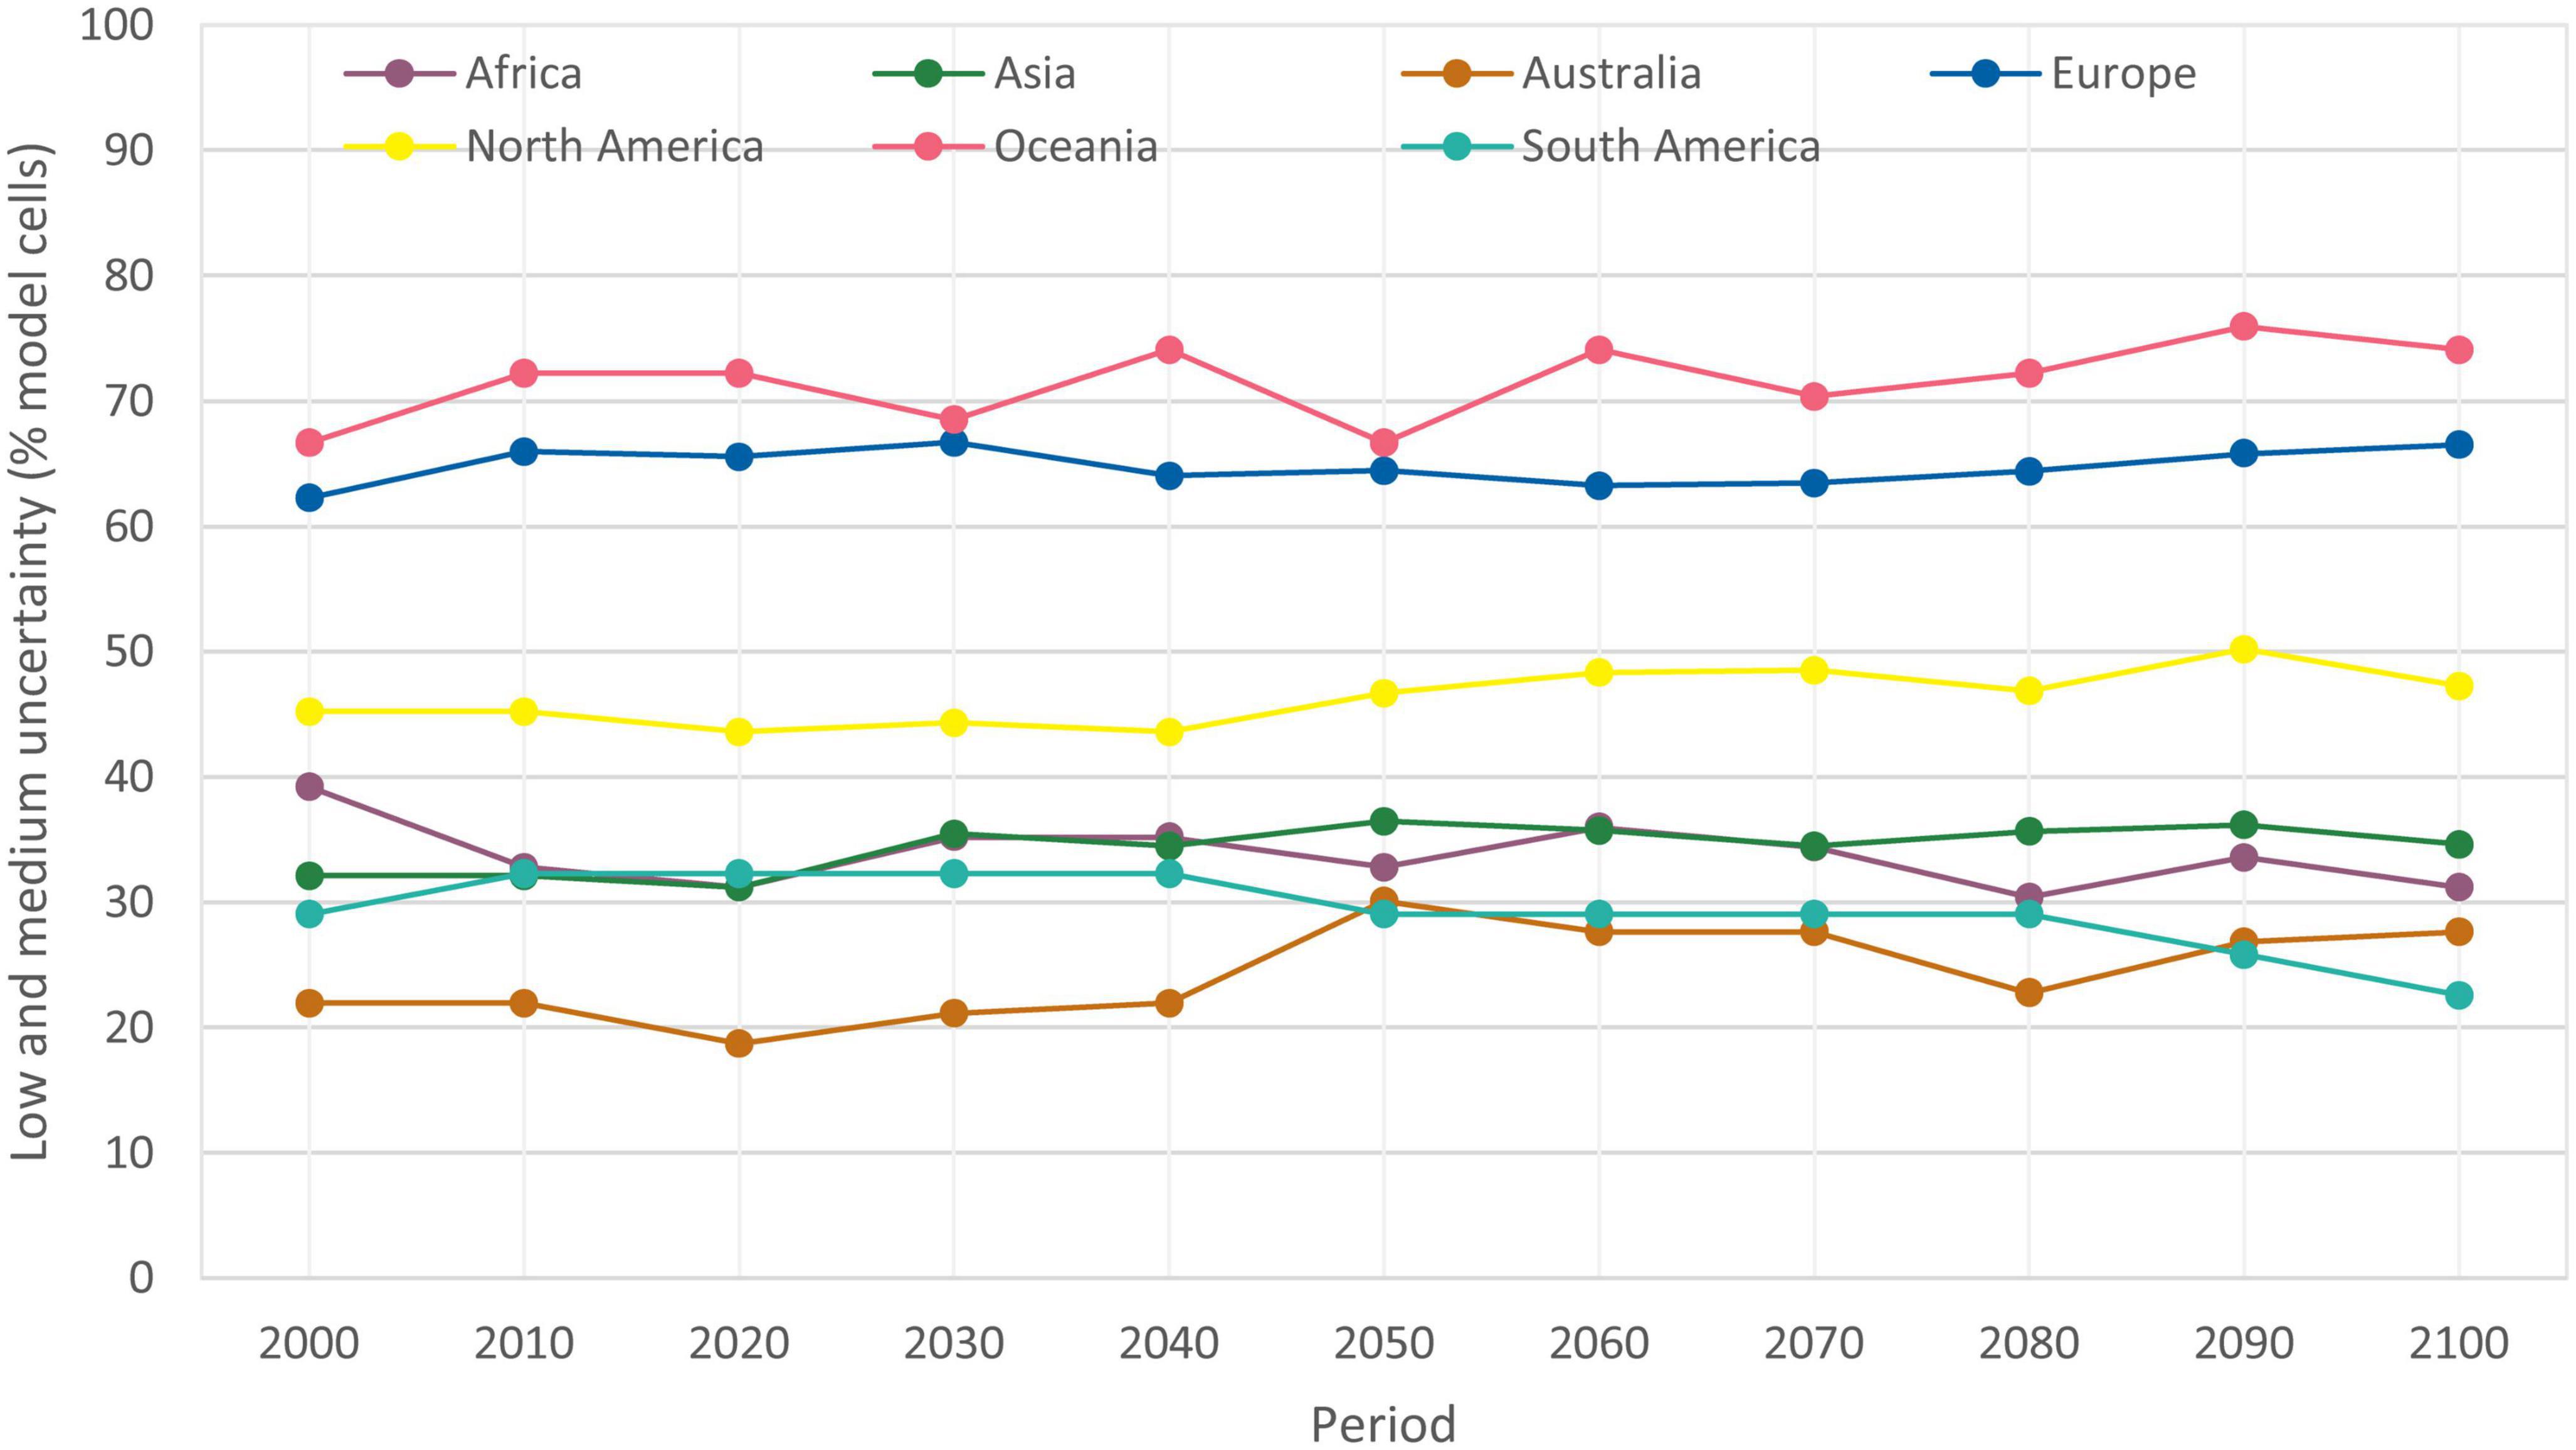
Figure 10. Uncertainty of the five GCMs predictions of potential distribution of Lecanosticta acicola for RCP4.5 in the period 1971–2100 by continent. Low and medium uncertainty are classes of uncertainty depicting that one or two GCMs had different results.
There was high confidence (low uncertainty) in the model predictions for RCP4.5 in the period 2071–2100 for most of the south Europe, east Asia, most of North America except for the central states, Africa and Australia (Figure 11). Most of New Zealand had medium and low uncertainties. In Australia medium and low uncertainty was concentrated to Victoria, New South Wales and South Australia. In South Africa most of the model cells with low and medium uncertainties were found on the coastline between Cape Town and Gqeberha. In North America, uncertain model predictions were mostly found in Rocky Mountains and Great Plains. Uncertainty of GCMs predictions for central, east and west Europe were low to medium.

Figure 11. Uncertainty map of the five GCMs predictions of potential distribution of Lecanosticta acicola for RCP4.5 in the period 2071–2100, where “certain” indicates outputs from all GCMs agree, “low” uncertainty indicates one GCM had different result, and “medium” uncertainty indicates two GCMs had different results.
4. Discussion
Pine species are a significant component of global forests, with great economic, cultural, and ecological importance, and a significant role to play in carbon sequestration (e.g., UN, 2015; EC, 2021a,b). However, a changing climate has the potential to influence their resilience to pathogens such as L. acicola. Data from a recently compiled, global dataset of Lecanosticta species distribution clearly demonstrated L. acicola tolerates a wide range of temperatures and precipitation (Tubby et al., 2023). Furthermore, as evidence suggests L. acicola has significantly expanded its range over the past 20 years (Munck et al., 2011; van der Nest et al., 2019a; Tubby et al., 2023), there is a need to understand how climate change might affect the risk posed by L. acicola to global pine forests.
The current study built on the findings of earlier, regional disease monitoring studies which indicated increased prevalence and severity of disease outbreaks might be related to changes in climate (Broders et al., 2015; Wyka et al., 2018). Warmer winters, cooler spring temperature and cumulative precipitation over the spring and summer were important predictors of the presence and severity of white pine needle damage (WPND), of which L. acicola is one of a number of causal agents, in North America (Wyka et al., 2017). Similarly, daily maximum temperature and daily cumulative precipitation were the two best variables explaining L. acicola spore abundance in the Basque region of Spain, where low precipitation and average maximum daily temperatures >25°C resulted in very little spore release (Wyka et al., 2018; Mesanza et al., 2021).
When L. acicola presence/absence data from the geodatabase compiled by Tubby et al. (2023) were examined, climatic variables relating to temperature and precipitation also proved very significant in explaining areas suitable for proliferation of L. acicola globally. L. acicola can survive temperatures in planta of between –24 and +35°C (Tubby et al., 2023) but has an optimum temperature for growth in the region of 20–25°C (Kais, 1972) and two of the eight most significant variables in the current study, DIURNG and TMPWETTQ, related to temperature. Along with rainfall, high moisture (leaf wetness) and relative humidity are necessary for conidia production, dissemination, and germination in L. acicola (Kais, 1975; Wyka et al., 2018) and other foliar pathogen such as Dothistroma species (Pérez Jara, 1973; Watt et al., 2011b; Woods et al., 2016). In the current model, three of the most significant variables related directly to moisture availability: PRECSEASON, PRECWARMQ and MRSOS. Relative air humidity was not significant in the model produced by Mesanza et al. (2021) and was also removed from our model at the second “interpretation step” of VSURF procedure. Interestingly, MRSOS was identified as more important than relative humidity, and moisture levels in the top layers of soil in the wettest quarter were included in the model. Although its role in the life cycle of L. acicola remains unclear, it is possible that higher water availability in the litter and upper soil layers might facilitate spore production and release from acervuli during the wettest part of the year.
The model ensemble in this study also found solar radiation (as RLDS and RSDS) to be significant. This variable was discarded from the Mesanza et al. (2021) study, although solar radiation is known to influence DNB severity (Watt et al., 2021). Solar radiation affects temperature directly, and as discussed above, temperature itself is a significant explanatory variable. However, solar radiation may also have direct impacts on behavior of L. acicola, by affecting spore production, and the host, by triggering stomata to open, allowing entry of fungal pathogens (Purschwitz et al., 2006; Iturritxa et al., 2015). Solar radiation also affects moisture levels indirectly by increasing evaporation. This effect is exacerbated by increasing wind speeds (Watt et al., 2021), however, two of three wind variables were removed due to high autocorrelation, and the third wind variable was removed at the first step of the VSURF variables selection procedure.
Coarse spatial resolution of the model and input data could have large effects on the model and its results. If a finer spatial resolution were chosen, the importance of the variables could change, and other variables would be included in the model that otherwise were excluded from the model, such as relative humidity and wind speed. However, the spatial resolution of the relative humidity data ranged from 0.70 to 2.8° (approximately 77.8 to 311.2 km), which is far from ideal (1 km or less). Also, the host distribution data had a resolution of 1-degree. Therefore, as a compromise we decided to use a spatial resolution of 1-degree, into which all data were resampled.
An ensemble of the three best models developed utilizing the selected environmental parameters, five GCMs and three RCPs, demonstrated that the potential distribution range of L. acicola could cover up to 85.8% of Pinus spp. area by the end of the 21st century, considering the upper limit of the 95% confidence interval. Variability between the RCPs was small, e.g., the median prediction ranged from 60.3 to 62.2% in the period 2071–2100. Interestingly, the lowest value belonged to RCP8.5 and the highest to RCP2.6, showing that smaller changes in temperature will likely be more favorable for BSNB than greater changes. Those results could be interpreted as: (1) in the scenarios RCP8.5 and RCP4.5 daily maximum temperature could exceed the optimum temperature for L. acicola growth and spore production and release (Kais, 1972; Wyka et al., 2018), decreasing the global area suitable for the pathogen proliferation; and (2) performance of extrapolation of the model ensemble from the current climate to other climate conditions was poor, because the RCP2.6 is a scenario closest to the climate of the reference period. The latter was considered with the model ensemble approach which reduce errors when extrapolating (Elith and Leathwick, 2009). Therefore, the model predictions indicate possible unfavorable conditions for potential distribution of L. acicola in the future due to higher temperatures. On the other hand, GCMs had a huge impact on the potential distribution range, i.e., 33.6–85.8% of global Pinus spp. area, as they encompass large variations in climate predictions, and medium uncertainty of the predictions. Therefore, it is important to include an adequate number of GCMs in species distribution modeling, e.g., at least 5 to 10, to encompass a range of possible climate developments inside specific RCPs. Furthermore, it is imperative that the predictions are correctly interpreted using an uncertainty map.
When the realized distribution of BSNB was examined, most false negatives and false positives occurred in Europe. This could be a consequence of the uneven distribution of absence data in the geodatabase, where most absence data were collected in Europe. It would be interesting to investigate different selection methods for pseudo-absences and their impact on model results (Barbet-Massin et al., 2012). However, this was beyond the scope of the current study.
In North America 68.8% of Pinus spp. area was considered suitable during the reference period (1971–2000) but the realized distribution was only 12.4%. Indeed, the pathogen is probably native to North America or Mexico (van der Nest et al., 2019b) and already relatively widely established in eastern regions of North America. The models predict very little change (3.1%) in range expansion to the end of 21st century. Realized distribution of L. acicola in Europe was 21.1% in the reference period. The potential distribution of L. acicola in Europe during the reference period covered 34.8% of Pinus spp. area, but could reach 39.1% by 2100. Again, this is a relatively minor increase in its potential distribution (12.2%). The highest relative changes in the pathogen’s potential distribution are expected in Africa, Australia and Oceania, with a 14.1, 26.8, and 175% increase, respectively, compared to the reference period. The very high relative change in L. acicola potential distribution in Oceania is largely due to increased potential areas for expansion across New Zealand, a country known for its longstanding battles against other pine needle pathogens including red needle cast (RNC; Ganley et al., 2014) and DNB (Bulman et al., 2016). Predictions illustrate that the potential distribution of L. acicola in Oceania remains relatively stable until 2040 and thereafter suddenly increases to 2060. Somewhat different results were obtained for DNB where model predictions under climate change showed increased risk for North America, Europe, and New Zealand (Oceania), but reduced risk for forests worldwide (Watt et al., 2011a).
While range expansion in North America, Europe and Asia appears likely under climate change predictions as L. acicola is already present in these regions, the real potential for L. acicola to disseminate across Oceania, Australia and Africa remains far more uncertain. The significant increase in area of pine forests at risk of BSNB will only be realized following the introduction of the pathogen to these regions. Whilst inter-continental dissemination via wind-blown ascospores is a possibility, as has occurred with D. septosporum (Barnes et al., 2022), introduction via anthropogenic means on infected planting stock is a likely pathway (Santini et al., 2013). The model outputs emphasize the critical importance for these regions of maintaining strict biosecurity measures, as the accidental introduction of L. acicola could have hugely significant impacts on forest condition and ecosystem services, given the large areas of vulnerable pine forests.
Possible expansion of BSNB in the future could be partly explained by a moderate increase in temperature; The recent expansion of BSNB in Europe might support this hypothesis (Tubby et al., 2023). However, too high temperatures will have a negative effect on potential distribution of L. acicola as discussed earlier. A limiting factor for the disease is also likely to be precipitation whose patterns could drastically change in the future. A decrease in rainfall could lead to a decrease in potential distribution of BSNB in some regions as showed by our model, mostly in Europe. However, reduction is expected only in 4.3% of model cells considering RCP4.5 in the period 2071–2100. But expansion of potential distribution is predicted in an additional 8% of pine area, altogether 61.9% of global pine area. Nevertheless, the model predicted increases in suitable areas for L. acicola, where it could expand its distribution in the future. The trend was calculated to be positive and statistically significant for all three RCPs.
In all of these regions, while the models predict varying degrees of range expansion, they do not attempt to predict changes in disease severity and impact. Such changes in severity of WPND have already been observed in northern regions of North America (Broders et al., 2015; Wyka et al., 2017) and Alpine regions of Austria (Tubby et al., 2023). Similarly, the profile of D. septosporum, increased from a sporadically reported organism on Pinus species in southern England and Wales, to a pathogen which resulted in species change across Britain’s Public Forest Estate (Archibald and Brown, 2007; Bulman et al., 2016).
Spread of pathogens to new, distant regions is possible via human mediated pathways, e.g., infected plants for planting or in the case of pine pitch canker caused by F. circinatum, also by infected seeds and contaminated soil and equipment (Drenkhan et al., 2020). Biosecurity measures are indeed of utmost importance when a disease cannot easily cross spatial discontinuities in the distribution of host species due to the short dispersal of spores as in case of F. circinatum (Möykkynen et al., 2015; Drenkhan et al., 2020). Biosecurity measures, together with awareness raising will be vital if we want to limit further spread of L. acicola as shown in Slovenia, where tourists were identified as important likely pathway of BSNB (Tubby et al., 2023).
While the results of the model ensemble show increases in potential dissemination of L. acicola, these predictions do not take into account changes in the distribution and susceptibility of pine species resulting from climate change. Several studies predict climate-induced changes in host susceptibility to forest pathogens (Kliejunas et al., 2009; Linnakoski et al., 2019), as stresses imposed by drought or high temperatures influence expression of defense chemicals (Stenlid and Oliva, 2016; Klutsch et al., 2017). Climate change is also likely to affect the pine host distribution (e.g., Xu and Yan, 2001; García-López and Allué, 2010; Coops and Waring, 2011; Hirata et al., 2017; Mauri et al., 2022). The range of P. sylvestris is predicted to decrease across the Iberian Peninsula under many climate change predictions (Garzón et al., 2008; Benito Garzón and Vizcaíno-Palomar, 2021) as is the range of, for example, P. strobiformis in the southern United States and Mexico (Shirk et al., 2018). These factors will have consequences for the realized range of L. acicola in the near future, despite the ability of the pathogen to thrive in a wide range of habitats and climates (Tubby et al., 2023). Our simulations showed that RCPs did not have a substantial effect on the potential distribution of the studied pathogen. Therefore, we could speculate that the ecological niche of L. acicola is plastic enough to allow adaptation to changes in Pinus spp. availability in the future due to climate change. Nevertheless, this matter should be considered in another study.
The current study tested four modeling approaches with eight models, and performance of the model ensemble was very good, with high precision (0.87) and very high AUC (0.94), meaning predictions made by the ensemble are plausible. However, many other approaches exist for SDM, e.g., generalized additive models, generalized boosting models, multiple adaptive regression splines, maximum entropy, and cellular automata (Elith and Leathwick, 2009; Thuiller et al., 2009; Möykkynen et al., 2017). Finally, it is important to use a multi-model approach which can improve the use of the model for extrapolation and reduce errors (Elith and Leathwick, 2009). Our model ensemble included random forest and bagging with two different base learners (LMT and random tree). Random forest and bagging outperformed single classification trees and GLM which agrees with the results of other studies (Jin et al., 2014; Carvajal et al., 2018; Nahar and Ara, 2018; Chen et al., 2019; Naseem et al., 2021; Watt et al., 2021).
Our study is based on a comprehensive global dataset of Lecanosticta species (Tubby et al., 2023). The dataset was extensive and of high quality because it is based on official country surveys, peer-reviewed articles, and most of the records were confirmed by laboratory analysis with the data being contributed by specialist researchers worldwide. Many factors were included within the models which explain the disease spatial distribution very well. Because the model inputs were of high quality, the model outputs can be considered with higher confidence which is clearly depicted in the model performance indicators. Consequently, we believe that the developed models strongly characterize the impact of these variables on BSNB potential distribution.
This study clearly shows that suitable conditions for BSNB cover more than half of global Pinus spp. area in the reference period 1971–2000, and its potential distribution range is predicted to increase in the near future. The maps of potential distribution of BSNB could assist forest managers in considering the risk of BSNB. The results will allow practitioners and policymakers to focus surveillance methods and implement appropriate management plans. Knowledge gained from model learning can help determine regions where the disease is not likely to occur but environmental conditions are suitable for Pinus species.
5. Conclusion
1. The potential distribution of L. acicola in the reference period (1971–2000) covered 58.2% of global Pinus spp. area while the realized distribution covered only 10.1% of global potential distribution of L. acicola.
2. Predictions for future climate change scenarios showed a positive trend in the potential distribution of L. acicola from 1971 to 2100.
3. Representative Concentration Pathways had little effect on L. acicola potential distribution (60.3–62.2% in the period 2071–2100 for medium prediction). A hotter climate and precipitation deficits could limit L. acicola potential spread in some regions in the future due to climate change.
4. Global climate models had a large impact on the potential distribution of L. acicola resulting in wide 95% confidence intervals of 33.6–85.8% of global pine area. Low and medium uncertainty of GCMs predictions were identified in 46.7–51.8% of model cells for three RCPs in the period 1971–2100.
5. Out of 44 bioclimatic and environmental variables the eight most influential for the spatial distribution of L. acicola were determined to be: surface downwelling longwave radiation of driest quarter, mean diurnal temperature range, precipitation of the warmest quarter, elevation, mean temperature of the wettest quarter, precipitation seasonality, surface downwelling shortwave radiation of warmest quarter, and moisture in the upper portion of the soil column during the wettest quarter.
6. Certain regions currently thought to be free of L. acicola have some of the highest predicted range expansion values, emphasizing the critical importance of adherence to strict biosecurity measures.
7. Whilst these modeling efforts provide an informative summary of potential increases in L. acicola prevalence in global Pinus forests, the possibility of changes in the severity of the disease and host potential distribution require further investigation.
Data availability statement
The raw data supporting the conclusions of this article will be made available by the authors, without undue reservation.
Author contributions
NO contributed to conception, design of the study, performed formal analysis and was responsible for overall methodology, data curation, and validation and visualization. NO, KT, and MM wrote the first draft of the manuscript. PV managed the geodatabase. All authors contributed to manuscript revision, reading, and approved the submitted version.
Funding
This study was co-funded by Slovenian Research Agency (Research Program P4-0107 Forest Biology, Ecology and Technology), the Administration for Food Safety, Veterinary Sector and Plant Protection (Slovenia), the Estonian Research Council (grant PRG1615), Forest Research, United Kingdom, and the European Regional Development Fund, Project Phytophthora Research Centre Reg. No. CZ.02.1.01/0.0/0.0/15_003/0000453.
Acknowledgments
We thank all participants in the Euphresco BROWNSPOT project that contributed the data to the geodatabase of global distribution of L. acicola (Tubby et al., 2023). We acknowledge the World Climate Research Programme which, through its Working Group on Coupled Modeling, coordinated and promoted CMIP6. We also thank the climate modeling groups for producing and making available their model output, the Earth System Grid Federation (ESGF) for archiving the data and providing access, and the multiple funding agencies who support CMIP6 and ESGF.
Conflict of interest
The authors declare that the research was conducted in the absence of any commercial or financial relationships that could be construed as a potential conflict of interest.
Publisher’s note
All claims expressed in this article are solely those of the authors and do not necessarily represent those of their affiliated organizations, or those of the publisher, the editors and the reviewers. Any product that may be evaluated in this article, or claim that may be made by its manufacturer, is not guaranteed or endorsed by the publisher.
Supplementary material
The Supplementary Material for this article can be found online at: https://www.frontiersin.org/articles/10.3389/ffgc.2023.1221339/full#supplementary-material
Footnotes
References
Adamson, K., Mullett, M. S., Solheim, H., Barnes, I., Müller, M. M., Hantula, J., et al. (2018). Looking for relationships between the populations of Dothistroma septosporum in northern Europe and Asia. Fungal Genet. Biol. 110, 15–25. doi: 10.1016/j.fgb.2017.12.001
Archibald, S., and Brown, A. V. (2007). The relationship between climate and the incidence of red band needle blight in the East Anglia Forest District, Britain. Workshop of the IUFRO Working party 7.02.02. Foliage, shoot and stem diseases of forest trees. Sopron: IUFRO.
Barbet-Massin, M., Jiguet, F., Albert, C. H., and Thuiller, W. (2012). Selecting pseudo-absences for species distribution models: How, where and how many? Methods Ecol. Evol. 3, 327–338. doi: 10.1111/j.2041-210X.2011.00172.x
Barnes, I., van der Nest, A., Granados, G. M., and Wingfield, M. J. (2022). “Dothistroma needle blight,” in Forest microbiology, eds F. O. Asiegbu and A. Kovalchuk (Amsterdam: Academic Press), 179–199. doi: 10.1016/B978-0-323-85042-1.00008-2
Benito Garzón, M., and Vizcaíno-Palomar, N. (2021). “Biogeographical patterns of local adaptation and plasticity of mediterranean pines and their implications under climate change,” in Pines and their mixed forest ecosystems in the Mediterranean basin, eds G. Ne’eman and Y. Osem (Cham: Springer International Publishing), 71–82. doi: 10.1007/978-3-030-63625-8_4
Blockeel, H. (1998). Top-down induction of first order logical decision trees. Ph.D. thesis. Leuven: Katholieke Universiteit.
Breiman, L., Friedman, J. H., Olshen, R. A., and Stone, C. J. (1998). Classification and regression trees. Boca Raton, FL: Chapman & Hall.
Broders, K., Munck, I., Wyka, S., Iriarte, G., and Beaudoin, E. (2015). Characterization of fungal pathogens associated with white pine needle damage (WPND) in Northeastern North America. Forests 6, 4088–4104. doi: 10.3390/f6114088
Bulman, L. S., Bradshaw, R. E., Fraser, S., Martín-García, J., Barnes, I., Musolin, D. L., et al. (2016). A worldwide perspective on the management and control of Dothistroma needle blight. For. Pathol. 46, 472–488. doi: 10.1111/efp.12305
Carvajal, T. M., Viacrusis, K. M., Hernandez, L. F. T., Ho, H. T., Amalin, D. M., and Watanabe, K. (2018). Machine learning methods reveal the temporal pattern of dengue incidence using meteorological factors in metropolitan Manila, Philippines. BMC Infect. Dis. 18:183. doi: 10.1186/s12879-018-3066-0
Chen, L., Wang, Y., Ren, C., Zhang, B., and Wang, Z. (2019). Optimal combination of predictors and algorithms for forest above-ground biomass mapping from Sentinel and SRTM data. Remote Sens. 11:414. doi: 10.3390/rs11040414
Cherchi, A., Fogli, P. G., Lovato, T., Peano, D., Iovino, D., Gualdi, S., et al. (2019). Global mean climate and main patterns of variability in the CMCC-CM2 coupled model. J. Adv. Model. Earth Syst. 11, 185–209. doi: 10.1029/2018MS001369
Coops, N. C., and Waring, R. H. (2011). A process-based approach to estimate lodgepole pine (Pinus contorta Dougl.) distribution in the Pacific Northwest under climate change. Clim. Change 105, 313–328. doi: 10.1007/s10584-010-9861-2
Diniz-Filho, J. A. F., Bini, L. M., and Hawkins, B. A. (2003). Spatial autocorrelation and red herrings in geographical ecology. Glob. Ecol. Biogeogr. 12, 53–64. doi: 10.1046/j.1466-822X.2003.00322.x
Drenkhan, R., Ganley, B., Martín-García, J., Vahalík, P., Adamson, K., Adamčíková, K., et al. (2020). Global geographic distribution and host range of Fusarium circinatum, the causal agent of pine pitch canker. Forests 11:724. doi: 10.3390/f11070724
Drenkhan, R., Tomešová-Haataja, V., Fraser, S., Bradshaw, R. E., Vahalík, P., Mullett, M. S., et al. (2016). Global geographic distribution and host range of Dothistroma species: A comprehensive review. For. Pathol. 46, 408–442. doi: 10.1111/efp.12290
Džeroski, S. (2001). “Data mining in a nutshell,” in Relational data mining, eds S. Džeroski and N. Lavrač (Berlin: Springer), 3–27.
EC (2021a). EU biodiversity strategy for 2030: bringing nature back into our lives. Luxembourg: European Commission.
Elith, J., and Leathwick, J. R. (2009). Species distribution models: Ecological explanation and prediction across space and time. Annu. Rev. Ecol. Evol. System. 40, 677–697. doi: 10.1146/annurev.ecolsys.110308.120159
FAO, IIASA, ISRIC, ISS-CAS, and JRC (2009). Harmonized world soil database (version 1.2). Rome: FAO.
Fick, S. E., and Hijmans, R. J. (2017). WorldClim 2: New 1-km spatial resolution climate surfaces for global land areas. Int. J. Climatol. 37, 4302–4315. doi: 10.1002/joc.5086
Frank, E., Hall, M. A., and Witten, I. H. (2016). The WEKA Workbench. online appendix for “data mining: practical machine learning tools and techniques”. Burlington, MA: Morgan Kaufmann.
Ganley, R. J., Williams, N. M., Rolando, C. A., Hood, I. A., Dungey, H. S., Beets, P. N., et al. (2014). Management of red needle cast caused by Phytophthora pluvialis a new disease of radiata pine in New Zealand. N. Zeal. Plant Protect. 67, 48–53. doi: 10.30843/nzpp.2014.67.5721
García-López, J. M., and Allué, C. (2010). Effects of climate change on the distribution of Pinus sylvestris L. stands in Spain. A phytoclimatic approach to defining management alternatives. For. Syst. 19, 329–339. doi: 10.5424/fs/2010193-8694
Garzón, M. B., Sánchez de Dios, R., and Sainz Ollero, H. (2008). The evolution of the Pinus sylvestris L. area in the Iberian Peninsula from the last glacial maximum to 2100 under climate change. Holocene 18, 705–714. doi: 10.1177/0959683608091781
Genuer, R., Poggi, J.-M., and Tuleau-Malot, C. (2010). Variable selection using random forests. Patt. Recogn. Lett. 31, 2225–2236. doi: 10.1016/j.patrec.2010.03.014
Genuer, R., Poggi, J.-M., and Tuleau-Malot, C. (2019). VSURF: variable selection using random forests. R package version 1.1.0. Vienna: The R Project for Statistical Computing.
Gutjahr, O., Putrasahan, D., Lohmann, K., Jungclaus, J. H., von Storch, J. S., Brüggemann, N., et al. (2019). Max Planck Institute Earth System Model (MPI-ESM1.2) for the high-resolution model intercomparison project (HighResMIP). Geosci. Model Dev. 12, 3241–3281. doi: 10.5194/gmd-12-3241-2019
Hall, M., Frank, E., Geoffrey, H., Pfahringer, B., Reutemann, P., and Witten, I. H. (2009). The WEKA data mining software: An update. SIGKDD Explor. 11, 1–9.
Hirata, A., Nakamura, K., Nakao, K., Kominami, Y., Tanaka, N., Ohashi, H., et al. (2017). Potential distribution of pine wilt disease under future climate change scenarios. PLoS One 12:e0182837. doi: 10.1371/journal.pone.0182837
Iturritxa, E., Mesanza, N., and Brenning, A. (2015). Spatial analysis of the risk of major forest diseases in Monterey pine plantations. Plant Pathol. 64, 880–889. doi: 10.1111/ppa.12328
Janoušek, J., Wingfield, M. J., Monsivais, J. G. M., Jankovský, L., Stauffer, C., Konečný, A., et al. (2016). Genetic analyses suggest separate introductions of the pine pathogen Lecanosticta acicola into Europe. Phytopathology 106, 1413–1425. doi: 10.1094/phyto-10-15-0271-r
Jin, H., Kim, S., and Kim, J. (2014). Decision factors on effective liver patient data prediction. Int. J. Bio-Sci. Bio-Technol. 6, 167–178. doi: 10.14257/ijbsbt.2014.6.4.16
Kais, A. G. (1972). Variation between southern and northern isolates of Scirrhia acicola. Phytopathology 62:768.
Kais, A. G. (1975). Environmental factors affecting brown-spot infection on longleaf pine. Phytopathology 65, 1389–1392. doi: 10.1094/Phyto-65-1389
Kliejunas, J. T., Geils, B. W., Glaeser, J. M., Goheen, E. M., Hennon, P., Kim, M.-S., et al. (2009). Review of literature on climate change and forest diseases of western North America. Albany, CA: U.S. Department of Agriculture.
Klutsch, J. G., Shamoun, S. F., and Erbilgin, N. (2017). Drought stress leads to systemic induced susceptibility to a nectrotrophic fungus associated with mountain pine beetle in Pinus banksiana seedlings. PLoS One 12:e0189203. doi: 10.1371/journal.pone.0189203
Kocev, D., Vens, C., Struyf, J., and Džeroski, S. (2007). “Ensembles of Multi-Objective Decision Trees,” in Machine Learning: ECML 2007, 18th European Conference on Machine Learning, Warsaw, Poland, Proceedings, eds J. N. Kok, J. Koronacki, R. L. de Mantaras, S. Matwin, D. Mladenič, and A. Skowron (Heidelberg: Springer-Verlag), 624–631.
Koldasbayeva, D., Tregubova, P., Shadrin, D., Gasanov, M., and Pukalchik, M. (2022). Large-scale forecasting of Heracleum sosnowskyi habitat suitability under the climate change on publicly available data. Sci. Rep. 12:6128. doi: 10.1038/s41598-022-09953-9
Laas, M., Adamson, K., Barnes, I., Janoušek, J., Mullett, M. S., Adamčíková, K., et al. (2022). Diversity, migration routes, and worldwide population genetic structure of Lecanosticta acicola, the causal agent of brown spot needle blight. Mol. Plant Pathol. 23, 1620–1639. doi: 10.1111/mpp.13257
Laas, M., Adamson, K., and Drenkhan, R. (2019). A look into the genetic diversity of Lecanosticta acicola in northern Europe. Fungal Biol. 123, 773–782. doi: 10.1016/j.funbio.2019.06.012
Landwehr, N., Hall, M., and Frank, E. (2005). Logistic model trees. Mach. Learn. 59, 161–205. doi: 10.1007/s10994-005-0466-3
Linnakoski, R., Kasanen, R., Dounavi, A., and Forbes, K. M. (2019). Editorial: Forest health under climate change: effects on tree resilience, and pest and pathogen dynamics. Front. Plant Sci. 10:1157. doi: 10.3389/fpls.2019.01157
Mauri, A., Girardello, M., Strona, G., Beck, P. S. A., Forzieri, G., Caudullo, G., et al. (2022). EU-Trees4F, a dataset on the future distribution of European tree species. Sci. Data 9:37. doi: 10.1038/s41597-022-01128-5
Mauritsen, T., Bader, J., Becker, T., Behrens, J., Bittner, M., Brokopf, R., et al. (2019). Developments in the MPI-M Earth System Model version 1.2 (MPI-ESM1.2) and Its Response to Increasing CO2. J. Adv. Model. Earth Syst. 11, 998–1038. doi: 10.1029/2018MS001400
McCulloch, C. E., Searle, S. R., and Neuhaus, J. M. (2005). Generalized, linear, and mixed models. Hoboken, NJ: John Wiley & Sons, Inc.
Mesanza, N., García-García, D., Raposo, E. R., Raposo, R., Iturbide, M., Pascual, M. T., et al. (2021). Weather variables associated with spore dispersal of Lecanosticta acicola causing pine needle blight in Northern Spain. Plants 10:2788. doi: 10.3390/plants10122788
Mi, C., Huettmann, F., Guo, Y., Han, X., and Wen, L. (2017). Why choose Random Forest to predict rare species distribution with few samples in large undersampled areas? Three Asian crane species models provide supporting evidence. PeerJ 5:e2849. doi: 10.7717/peerj.2849
Möykkynen, T., Capretti, P., and Pukkala, T. (2015). Modelling the potential spread of Fusarium circinatum, the causal agent of pitch canker in Europe. Ann. For. Sci. 72, 169–181. doi: 10.1007/s13595-014-0412-2
Möykkynen, T., Fraser, S., Woodward, S., Brown, A., and Pukkala, T. (2017). Modelling of the spread of Dothistroma septosporum in Europe. For. Pathol. 47:14. doi: 10.1111/efp.12332
Mullett, M. S., Adamson, K., Bragança, H., Bulgakov, T. S., Georgieva, M., Henriques, J., et al. (2018). New country and regional records of the pine needle blight pathogens Lecanosticta acicola, Dothistroma septosporum and Dothistroma pini. For. Pathol. 48:e12440. doi: 10.1111/efp.12440
Munck, I. A., Ostrofsky, W. D., and Burns, B. (2011). Eastern white pine needle damage. Washington, DC: USDA Forest Service.
Nahar, N., and Ara, F. (2018). Liver disease prediction by using different decision tree techniques. Int. J. Data Min. Know. Manage. Process 8, 1–9. doi: 10.5121/ijdkp.2018.8201
Naseem, R., Shaukat, Z., Irfan, M., Shah, M. A., Ahmad, A., Muhammad, F., et al. (2021). Empirical assessment of machine learning techniques for software requirements risk prediction. Electronics 10:168. doi: 10.3390/electronics10020168
Oskay, F., Laas, M., Mullett, M., Lehtijärvi, A., Doğmuş-Lehtijärvi, H. T., Woodward, S., et al. (2020). First report of Lecanosticta acicola on pine and non-pine hosts in Turkey. For. Pathol. 50:e12654. doi: 10.1111/efp.12654
Pérez Jara, E. (1973). ¿Qué papel juega Dothistroma pini Hulbary sobre el pino insigne según nuestras experiencias hasta hoy en el Sur de Chile?. Valdivia: Universidad Austral de Chile.
Purschwitz, J., Müller, S., Kastner, C., and Fischer, R. (2006). Seeing the rainbow: Light sensing in fungi. Curr. Opin. Microbiol. 9, 566–571. doi: 10.1016/j.mib.2006.10.011
R Core Team (2022). R: A language and environment for statistical computing. Vienna: R Foundation for Statistical Computing.
Raitelaitytė, K., Adamson, K., Markovskaja, S., Paulauskas, A., Mullett, M., and Drenkhan, R. (2023). Genetic structure of the pine needle pathogen Lecanosticta acicola in Lithuania and Northern Poland. Plant Pathol. 72, 246–254. doi: 10.1111/ppa.13655
Riahi, K., van Vuuren, D. P., Kriegler, E., Edmonds, J., O’Neill, B. C., Fujimori, S., et al. (2017). The Shared Socioeconomic Pathways and their energy, land use, and greenhouse gas emissions implications: An overview. Glob. Environ. Change 42, 153–168. doi: 10.1016/j.gloenvcha.2016.05.009
Santini, A., Ghelardini, L., De Pace, C., Desprez-Loustau, M. L., Capretti, P., Chandelier, A., et al. (2013). Biogeographical patterns and determinants of invasion by forest pathogens in Europe. New Phytol. 197, 238–250. doi: 10.1111/j.1469-8137.2012.04364.x
Sellar, A. A., Jones, C. G., Mulcahy, J. P., Tang, Y., Yool, A., Wiltshire, A., et al. (2019). UKESM1: description and evaluation of the U.K. Earth System Model. J. Adv. Model. Earth Syst. 11, 4513–4558. doi: 10.1029/2019MS001739
Shirk, A. J., Cushman, S. A., Waring, K. M., Wehenkel, C. A., Leal-Sáenz, A., Toney, C., et al. (2018). Southwestern white pine (Pinus strobiformis) species distribution models project a large range shift and contraction due to regional climatic changes. For. Ecol. Manage. 411, 176–186. doi: 10.1016/j.foreco.2018.01.025
Signorell, A., Aho, K., Alfons, A., Anderegg, N., Aragon, T., Arachchige, C., et al. (2022). DescTools: Tools for descriptive statistics. R package version 0.99.45. Dübendorf: Helsana. Available online at: https://cran.r-project.org/package=DescTools
Stenlid, J., and Oliva, J. (2016). Phenotypic interactions between tree hosts and invasive forest pathogens in the light of globalization and climate change. Philos. Trans. R. Soc. B Biol. Sci. 371:20150455. doi: 10.1098/rstb.2015.0455
Sumner, M., Frank, E., and Hall, M. (2005). “Speeding up logistic model tree induction,” in Knowledge Discovery in Databases: PKDD 2005, 9th European Conference on Principles and Practice of Knowledge Discovery in Databases, Porto, Portugal, Proceedings, eds A. M. Jorge, L. Torgo, P. Brazdil, R. Camacho, and J. Gama (Heidelberg: Springer-Verlag), 675–683.
Thuiller, W., Lafourcade, B., Engler, R., and Araújo, M. B. (2009). BIOMOD-A platform for ensemble forecasting of species distributions. Ecography 32, 369–373. doi: 10.1111/j.1600-0587.2008.05742.x
Trabucco, A., and Zomer, R. J. (2010). Global soil water balance geospatial database. London: CGIAR Consortium for Spatial Information.
Trabucco, A., and Zomer, R. J. (2019). Global high-resolution soil-water balance. London: CGIAR Consortium for Spatial Information.
Tubby, K., Adamcikova, K., Adamson, K., Akiba, M., Barnes, I., Boroń, P., et al. (2023). The increasing threat to European forests from the invasive foliar pine pathogen, Lecanosticta acicola. For. Ecol. Manage. 536:120847. doi: 10.1016/j.foreco.2023.120847
UN (2015). Transforming our world: the 2030 agenda for sustainable development. New York, NY: United Nations.
van der Nest, A., Wingfield, M. J., Janoušek, J., and Barnes, I. (2019a). Lecanosticta acicola: A growing threat to expanding global pine forests and plantations. Mol. Plant Pathol. 20, 1327–1364. doi: 10.1111/mpp.12853
van der Nest, A., Wingfield, M. J., Ortiz, P. C., and Barnes, I. (2019b). Biodiversity of Lecanosticta pine-needle blight pathogens suggests a Mesoamerican Centre of origin. IMA Fungus 10:2. doi: 10.1186/s43008-019-0004-8
van Vuuren, D. P., Edmonds, J., Kainuma, M., Riahi, K., Thomson, A., Hibbard, K., et al. (2011). The representative concentration pathways: an overview. Clim. Change 109:5. doi: 10.1007/s10584-011-0148-z
Voldoire, A., Saint-Martin, D., Sénési, S., Decharme, B., Alias, A., Chevallier, M., et al. (2019). Evaluation of CMIP6 DECK experiments with CNRM-CM6-1. J. Adv. Model. Earth Syst. 11, 2177–2213. doi: 10.1029/2019MS001683
Watt, M. S., Ganley, R. J., Kriticos, D. J., and Manning, L. K. (2011a). Dothistroma needle blight and pitch canker: The current and future potential distribution of two important diseases of Pinus species. Can. J. For. Res. 41, 412–424. doi: 10.1139/X10-204
Watt, M. S., Palmer, D. J., and Bulman, L. S. (2011b). Predicting the severity of Dothistroma on Pinus radiata under current climate in New Zealand. For. Ecol. Manage. 261, 1792–1798. doi: 10.1016/j.foreco.2011.01.043
Watt, M. S., Tan, A. Y. S., Fraser, S., and Bulman, L. S. (2021). Use of advanced modelling methods to predict dothistroma needle blight on Pinus radiata at a fine resolution within New Zealand. For. Ecol. Manage. 492:119226. doi: 10.1016/j.foreco.2021.119226
Witten, I. H., and Frank, E. (2005). Data mining: practical machine learning tools and techniques, 2nd Edn. San Francisco, CA: Morgan Kaufmann.
Woods, A., Coates, K. D., and Hamann, A. (2005). Is an unprecedented Dothistroma needle blight epidemic related to climate change? BioScience 55, 761–769. doi: 10.1641/0006-3568(2005)055[0761:IAUDNB]2.0.CO;2
Woods, A. J., Martín-García, J., Bulman, L., Vasconcelos, M. W., Boberg, J., La Porta, N., et al. (2016). Dothistroma needle blight, weather and possible climatic triggers for the disease’s recent emergence. For. Pathol. 46, 443–452. doi: 10.1111/efp.12248
Wyka, S. A., McIntire, C. D., Smith, C., Munck, I. A., Rock, B. N., Asbjornsen, H., et al. (2018). Effect of climatic variables on abundance and dispersal of Lecanosticta acicola spores and their impact on defoliation on eastern white pine. Phytopathology 108, 374–383. doi: 10.1094/phyto-02-17-0065-r
Wyka, S. A., Smith, C., Munck, I. A., Rock, B. N., Ziniti, B. L., and Broders, K. (2017). Emergence of white pine needle damage in the northeastern United States is associated with changes in pathogen pressure in response to climate change. Glob. Change Biol. 23, 394–405. doi: 10.1111/gcb.13359
Xu, D., and Yan, H. (2001). A study of the impacts of climate change on the geographic distribution of Pinus koraiensis in China. Environ. Int. 27, 201–205. doi: 10.1016/S0160-4120(01)00083-6
Yukimoto, S., Kawai, H., Koshiro, T., Oshima, N., Yoshida, K., Urakawa, S., et al. (2019). The Meteorological research Institute earth system model version 2.0, MRI-ESM2.0: Description and basic evaluation of the physical component. J. Meteorol. Soc. Jpn. 97, 931–965. doi: 10.2151/jmsj.2019-051
Zhao, Y. (2013). “Regression,” in R and data mining, ed. Y. Zhao (Cambridge, MA: Academic Press), 41–50.
Keywords: brown spot needle blight (BSNB), pines, species distribution model, climate change, biosecurity
Citation: Ogris N, Drenkhan R, Vahalík P, Cech T, Mullett M and Tubby K (2023) The potential global distribution of an emerging forest pathogen, Lecanosticta acicola, under a changing climate. Front. For. Glob. Change 6:1221339. doi: 10.3389/ffgc.2023.1221339
Received: 12 May 2023; Accepted: 14 July 2023;
Published: 28 July 2023.
Edited by:
Ari Mikko Hietala, Norwegian Institute of Bioeconomy Research (NIBIO), NorwayReviewed by:
Julio Javier Diez Casero, University of Valladolid, SpainJuha Honkaniemi, Natural Resources Institute Finland (Luke), Finland
Wilson Lara Henao, Norwegian Institute of Bioeconomy Research (NIBIO), Norway
Copyright © 2023 Ogris, Drenkhan, Vahalík, Cech, Mullett and Tubby. This is an open-access article distributed under the terms of the Creative Commons Attribution License (CC BY). The use, distribution or reproduction in other forums is permitted, provided the original author(s) and the copyright owner(s) are credited and that the original publication in this journal is cited, in accordance with accepted academic practice. No use, distribution or reproduction is permitted which does not comply with these terms.
*Correspondence: Nikica Ogris, nikica.ogris@gozdis.si
†These authors have contributed equally to this work and share last authorship