 Tadeja Volmut1
 Jurij Planinšec
 Boštjan Šimunič
- 1Faculty of Education, University of Primorska, Koper, Slovenia
- 2Science and Research Centre Koper, Institute for Kinesiology Research, Koper, Slovenia
- 3Faculty of Education, University of Maribor, Maribor, Slovenia
Regular physical activity (PA) reduces the health risk of childhood obesity and associated chronic diseases as well as mental health problems. Since PA declines as children age as well with future generations it is of highest importance to intervene in school and out-of-school settings. Out-of-school periods affect children's PA as it is mainly left to the interest and motivation of their parents. We compared accelerometer-based PA patterns in 93 6- to 9-year old children assessed four times: before (May/June), during (August), and after (September) summer holidays and at a 1-year follow up (May/June). Before summer holidays children were assessed also for anthropometry and motor tests. During summer holidays overall PA decreased by 18% (p < 0.001), physical inactivity increased by 5.5% (p < 0.001), moderate PA decreased by 53% (p < 0.001) and moderate to vigorous PA decreased by 45% (p < 0.001) when compared to before summer holidays. Furthermore, overall PA remained diminished also after summer holidays by 8.8% (p = 0.001) but recovered to baseline values at 1-year follow up. About 30% of overall PA and moderate to vigorous PA decrease during summer holidays could be explained by children's fitness level as a greater decrease was found in children with better results in standing long jump and 300-meter running time. Our finding detects an alarming summer holiday decrease in children PA that should not be neglected in future studies and intervention designs.
Introduction
Regular participation in physical activity reduces the health risk of childhood obesity and associated chronic diseases as well as mental health problems (1, 2). Therefore, it is of the highest importance to establish optimal physical activity patterns in childhood that are associated with future health and well-being (3). Further, it is well-documented that physical activity declines as children age (4, 5) and with future generations (6).
There are many original (7–13) and review (14–26) articles reporting seasonal variations in children's physical activity. A vast majority (83%) of these confirm seasonal changes in physical activity, indicating that a single assessment will not adequately characterize children's physical activity habits (9, 11). Seasonal variations and the validity of results depend on several factors (11, 27, 28): region where children reside (especially in regard to cold regions), children's age (especially 8–12 years), physical activity assessment method (most valid results from accelerometer-based studies) and study design (most valid results from repeated measures studies). Of the vast majority of studies reporting seasonal variations from 2 to 5 assessments, there are only four studies that compared physical activity and inactivity during summer holidays vs. school time (15, 18, 24, 26), and only three were longitudinal studies (18, 22, 24).
When comparing changes in physical inactivity and activity from school time to summer holidays, the results are not consistent (18, 22, 24, 26). Although sedentary behavior or physical inactivity consistently increased during summer holidays in all four studies, from 1.7 to 8%, it is less clear for light physical activity (LPA), which decreased during summer holidays by 2–10% (18, 22, 24) or even increased by 9% (26). Similarly, decreases in moderate physical activity (MPA) in the range of 3–13% are reported in only two studies (18, 22) as well as a 16% decrease in moderate to vigorous physical activity (MVPA) (22). Those discrepancies could be due to the low number of participants (18, 24), wrist accelerometer wear (24); comparison to different baseline seasons—some with more than one assessments during the school term (26), others in spring (22, 24), some in summer (18), some in winter (26). Thus, such an important and worrying modulation of physical activity during summer holidays warrants further investigation.
Summer holidays changes in physical activity and sedentary behavior could be affected by many factors, including sex, age, body-mass index or fat mass, fitness level, climate, and/or region, the school education system, family socio-economic status, parents' availability, and motivation for physical activity, availability of summer sport programmes, etc. Tanaka et al. (22) reported lower increase in sedentary behavior for girls involved in summer sports and boys without bedroom television ownership. Similarly, MVPA decreased less in boys involved in summer holidays sport programmes than in those who did not. To support this, Brazendale et al. (24) reported almost double increase (97.5% being > 4 h/day) in screen time during summer holidays in comparison to school time. The magnitude of the summer holidays effect could be reflected also in the increase of body mass index percentile per age after only 2 months of summer holidays (18). However, it remains to be seen whether children's fitness plays a role in preserving physical activity and whether inactivity changes during summer holidays.
Only one study investigated summer holidays' effect with multiple assessments during the school time. As we know, there is a substantial lowering of the physical activity in children with their increasing age (4, 5). Volmut et al. (4) reported a 40% decline in overall physical activity in children after the age of 4 years until the age of 16 years. Therefore, a decline of 3.3%/year is expected in longitudinal studies. Researchers must be aware of this and investigate summer holidays changes with multiple assessments before and/or after summer holidays. Only one cross-sectional study has followed this (26) and compared average school time data with summer holidays assessment. However, there are no longitudinal studies with more than two assessments.
Therefore, the aim of this study is to compare longitudinal changes in physical activity and inactivity within four assessments (three during school time and one during summer holidays) and investigate whether changes are associated with children's fitness. We hypothesized that summer holidays will increase physical inactivity and decrease MVPA, whereas greater changes will be observed in less fit children. Second, we will investigate whether physical activity and inactivity changes are reversible after summer holidays.
Materials and Methods
Participants
Initially 100 children (aged from 6- to 9-years; 49% boys) participated in the study. After data validation, 93 participants reached valid initial assessment and were invited for the next assessments (Table 1). They were randomly and evenly recruited from nine Slovenian schools, from two major cities: Maribor (28%) and Ljubljana (36%); and three cities from the coastal region (Koper, Piran, and Izola) (36%). Schools, parents, and children were pre-informed of the protocol and written consent was obtained from parents prior to the data collection. The study was approved by the Slovenian National Medical Ethics Committee (approval number: 153/07/09). The study was performed in accordance with the ethical standards of the 1964 Declaration of Helsinki and later amendments.
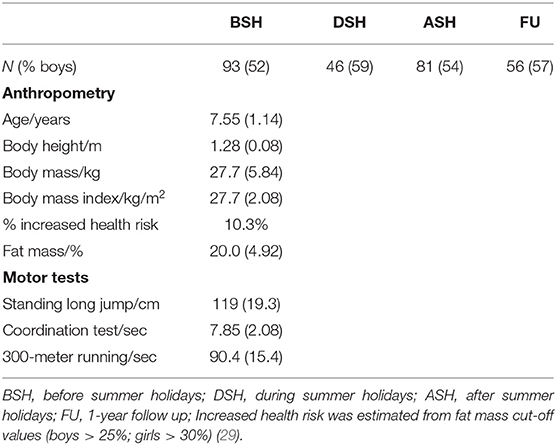
Table 1. Participants of the study.
Study Design
A longitudinal study design was used to assess physical activity in four time points in a 1-year period. Initial assessment took place during the school period in May/June (before summer holidays—BSH), the second assessment took place during summer holidays (DSH) in August, the third assessment took place during the school period in September (after summer holidays—ASH), and the fourth follow-up assessment took place again during school time in May/June (FU). At BSH children were assessed for anthropometrics and motor efficiency (standing long jump, 300-meter running test, and coordination test). As evident from Table 1, not all children attended all four measurements, whereas 46 (59% boys) were consistently assessed.
Measurement Procedures
At BSH children were assessed for anthropometrics and motor development only at BSH, while physical activity was assessed at BSH and later at DSH, ASH, and FU.
Anthropometrics was assessed as body height and mass using standard tools with 0.5 cm and 0.1 kg accuracy, respectively. Further, a body mass index (BMI) was calculated. Fat mass was assessed with a bioimpedance analyzer (Bioscan 916s, Maltron, UK). Four electrodes were applied according to the manual, two to the instep of the right foot, one to the back of the right hand, and one to the right wrist. Thirty minutes before and during the assessment children lay supine on a bed. Assessment was performed in the morning hours, before breakfast and before any moderate or intense physical exercise.
Motor efficiency was assessed by the means of motor tests during physical education hours. Children were assessed after a standardized 15 min warm-up, consisting of 5 min of running, 5 min of stretching, and 5 min of specific drills for three motor tests. Standing long jump was performed barefoot on a special mat with marked distances. An experienced researcher with the help of a physical education teacher assessed the results. Each child performed two warm-up jumps and three test jumps, the longest was taken for further analysis. The coordination test consisted of walking backward through three vertical rings, with legs and hands touching the floor. The distance between the starting line and the first ring was 1 meter and the 80 cm rings were 1 meter apart. The time was measured from the starting signal until the child exited the last ring. Each child performed two warm-up trials and two test trials, the shortest time was taken for further analysis. The 300-meter running test was performed outside at the local stadium. Children were instructed to run 300 meters as fast as possible and the time was recorded for further analysis.
Physical activity was assessed by means of accelerometers (GT3x, Actigraph, USA) during 5 consecutive days (from Wednesday to Sunday). Accelerometers were pre-programmed for 1 min epochs and attached with elastic strap on the right hip. Parents and children received instructions for accelerometer wear: not to be used during sleep, bathing and swimming; to be worn from 8 a.m. until 8 p.m. After each assessment period the data were transferred to the computer and further analyzed in Matlab (R2009a, Mathworks, USA). Only data from 8 a.m. and 8 p.m. (12 h) were analyzed with a removal of all 20 min consecutive zeros. Inclusion criteria for data validation were: (i) at least 80% of wearing time (9.6 h) for a valid day, and (ii) at least 2 valid weekdays and 1 valid weekend day for a valid record (30). From a valid record an overall physical activity in counts per minute (cpm) was calculated. Further, time spent in each physical activity phenotype was calculated based on Puyau et al. (31) cut-off values established for 6–16-year-old children. Specifically, a cut off 800 cpm was used to distinguish physical inactivity (PI) and LPA, a cut-off of 3,200 cpm was used to distinguish between LPA and MPA, and a cut-off 8,200 cpm was used to distinguish between MPA and VPA.
Statistics
All data were checked for normal distribution and normality was confirmed by visual inspection of histograms, Q-Q plots, kurtosis and skewness analysis (being lower than two standard errors of kurtosis and skewness), respectively, and the Shapiro-Wilk test confirmed normal distribution. The Leven test confirmed the equality of variances. Therefore, data are presented by means (with standard deviations) or [95% confidence intervals]. Using 3-way repeated analysis of variance we checked assessment time, age and sex differences. After dismissing age and sex differences we rearranged the physical activity data for mixed linear modeling where normality of residuals was confirmed by the same procedures as for the main variables. Subjects were classified as random factor, whereas assessment time point (BSH, DSH, ASH, FU), sex (boys and girls), age (6-, 7-, 8-, and 9-years) and city (coast, Ljubljana, and Maribor) were classified as fixed factors. In case of significant main effect, we applied a post hoc analysis with the Bonferroni correction of p-value to compare averages of two assessment points. Correlation analyses between changes in physical activity phenotypes during summer holidays and motor tests were performed using the Pearson correlation coefficient by applying the Bonferroni correction of p-value. All statistical decisions were made at p ≤ 0.05.
Results
After applying the Bonferroni correction (α = 0.0025) we could not detect any sex or age differences in physical activity phenotypes at any time points. Therefore, we pooled the sample for further analysis (Table 2).
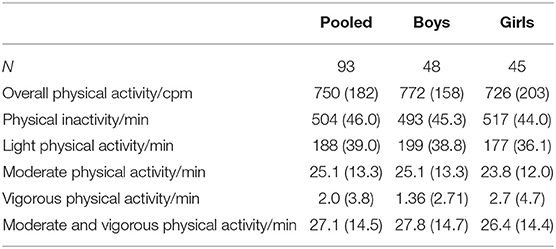
Table 2. Mean (with standard deviation) values for pooled and per gender participants assessed at baseline, before summer holidays.
After performing mixed linear modeling, we found assessment time contribution to the overall model in all physical activity phenotypes (p < 0.001). Sex contributed only in physical inactivity (p = 0.004) and LPA (p = 0.005), while age contributed in overall physical activity (p = 0.018), physical inactivity (p = 0.006), and LPA (p = 0.002). Geographical place of assessment (city) contributed only in VPA (p = 0.041).
Figure 1 presents changes in physical activity phenotypes when compared to baseline (BSH). An overall physical activity decreased by 18% in DSH (p < 0.001) remained decreased in ASH (8.8%; p = 0.001). PI increased by 5.5% (27.7 min) in DSH (p < 0.001), returned to baseline at ASH; however, in this FU it decreased by 9.3% (47 min) (p < 0.001). This decrease in PI at FU must be associated with a 23% (44 min) increase in LPA at the same time point (p < 0.001). MPA decreased by 53% (13 min) in DSH (p < 0.001) but not VPA, which decreased by 73% (1.5 min) in ASH (p = 0.011). Although large relative, but small absolute changes in VPA were found at ASH, this did not affect MVPA, which decreased by 45% (12 min) in DSH only (p < 0.001).
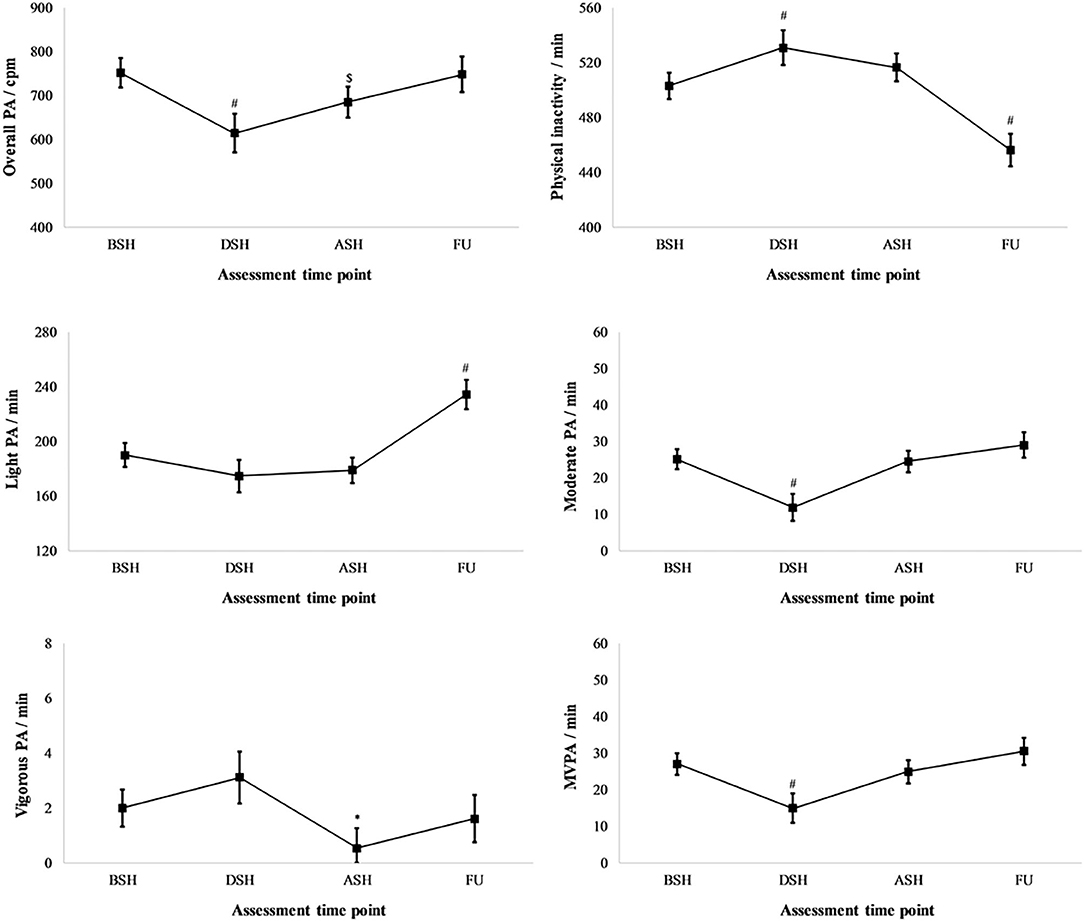
Figure 1. Changes in physical activity (PA) phenotypes during all four assessments: before (BSH), during (DSH), after (ASH) summer holidays and at 1-year follow up (FU). MVPA, moderate and vigorous physical activity. *p < 0.05; $p < 0.01; #p < 0.001.
Due to high multicollinearity between motor tests (|r|>0.500), only bivariate correlations could be presented (Table 3). We have found that relative changes in overall physical activity between BSH and DSH were correlated to the standing long jump test (r = −0.413; p = 0.004) and the 300-meter running test time (r = 0.421; p = 0.004) but not to BMI or fat mass. Interestingly, relative changes in PI between BSH and DSH were not correlated to any motor test or anthropometric measure. However, relative changes in MVPA between BSH and DSH were also correlated to the 300-meter running test time (r = 0.544; p < 0.001).
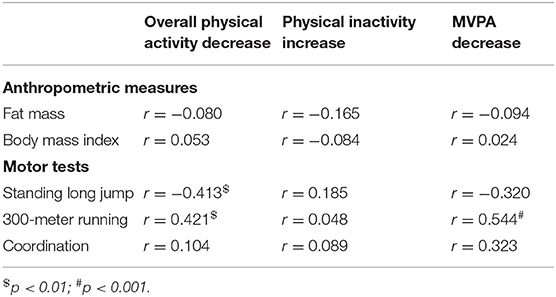
Table 3. Pearson correlation (r) analysis of relative decreases during summer holidays (DSH) when compared to before summer holidays (BSH) with motor tests and anthropometric measures.
Discussion
We compared longitudinal changes in physical activity and inactivity during a period of 12 months, including four assessments, three during school time (BSH, ASH, and FU), and one during summer holidays (DSH). When compared to BSH, we found that DSH overall physical activity decreased by 18%, together with 5.5% increased PI, 53% decreased MPA, and most importantly, with 45% decreased MVPA. We could conclude that physical activity phenotypes declined importantly in DSH. Even more, overall physical activity is not restored at ASH, being still lower by 8.8% than at BSH; however, it is restored at FU.
Although the summer months have been shown to be a time period when physical activity levels tend to be higher in children (28, 32), some well-designed longitudinal studies have showed that physical activity may actually be compromised during the summer holidays—as found also in our study. Although decreased MVPA during summer holidays is in line with the previous study by Tanaka et al. (22), we found a much greater decrease (45%, theirs being 16%). While increased PI was comparable in both studies (our study: 5.5% vs. 22: 4%) it seems that decreased MPA is a main contributor to the decrease in MVPA at DSH. However, in the study by McCue et al. (18), decreased MPA was not reflected in decreased MVPA. Tanaka et al. (22) reported results obtained from a similar sample at the same time-periods and interpreted the decline in MVPA at DSH due to higher maximum temperatures during the summer. Indeed Lewis et al. (33) reported that daily maximum temperature is significantly associated with MVPA and physical inactivity in Australia and Canada. MVPA and physical inactivity times appear to be optimal when the maximum temperature ranges between 20 and 25°C in both countries (33). This seems to hold for the study by Tanaka et al. (22), in which the average maximum daily temperature during the summer assessment was 31.6 (3.3) °C, with MVPA decreasing by 16% and PI increasing by 4%. Furthermore, in our study the average maximum daily temperature during the summer assessment was even higher, being 33.6 (1.3) °C, and the MVPA decrease was also the largest (45%); PI increased the most (5.5%), as well. During hot summer days, children tend to stay indoors to avoid heat and sun and that affects their physical activity (34, 35) and the outdoor physical activity in 6–9-year-old children is mainly left to the interest and motivation of their parents.
Previously published studies investigating the variability of children's physical activity in relation to the season are inconsistent. Most of the studies have shown seasonal differences in children's physical activity (9–11, 13, 14, 16, 17, 21, 22, 27, 28). After summarizing results, PI increases DSH from 1.7% (24) to 8% (18), while LPA decreases from 2% (23) to 10% (22), and MVPA increases from 8% (26) to 15.5% (22).
Other studies did not report change in MVPA during summer holidays. Although McCue et al. (18) found increased PI (16%), and decreased LPA (12%), and MPA (43%), there were no changes in VPA and MVPA. VPA remained unchanged in our study, too, although it was found to be very short in both studies (e.g., only 1–3 min). McCue et al. (18) suggested that the increased screen time might be an important contributor of increased sedentary behavior during summer holidays (36, 37); however, this was later dismissed by Brazendale et al. (24) when they found a 2-fold increased screen time without MVPA change and only 2.2% increased PI during summer holidays.
During summer holidays children have less-structured routines, and potentially less supervision throughout the day compared to their school schedules (37, 38). Indeed, all our participants assessed at DSH were involved in at least one organized out-of-school sport exercise in sport clubs. However, those activities were stopped at DSH, being continued at ASH, as goes for all school curricular and extracurricular physical activity or sport related activities.
Increased MVPA (24%), LPA (9%), and decreased PI (8%) at DSH were found by Nagy et al. (26). Although this seems to contradict our study and other studies (18, 22, 23), it should be noted that the study was cross-sectional and the reference values used in the study of Nagy et al. (26) were taken for the winter season. And it is well-known that physical activity is the lowest during winter (21, 28).
We should not neglect the fact that the overall physical activity remained down 8.8% at ASH compared to BSH. A similar finding was reported by Fu et al. (25), that reported 9% decreased daily steps immediately after 12 week summer holidays. The lower physical activity immediately after summer holidays may be reflected by the summer holiday period and additionally by the beginning of the new school year itself, as teachers may not have fully implemented physical activity breaks, physical education lessons may not have commenced, and plans to provide children with physical activity opportunities at recess have yet to be developed.
In recent years an accelerometer has been widely used for estimating physical activity, but we must point out that the accelerometer is not waterproof, to be used during water-based activities, which occurs most frequently during the summer holidays. This could add to the decline (or perception of decline) in physical activity during the summer, especially in our sample of children recruited also from coastal cities (Koper, Piran, and Izola). We have consistently used 1 min epochs and this might affect our results: overestimation of LPA, MPA, MVPA and underestimates PI and VPA in children (39). Furthermore, accelerometers were found to underestimate physical activity demand during cycling (40) and uphill hiking (41), both very popular physical activities in Slovenia. Perhaps this is one of the reasons why our participants have a higher decline in physical activity during summer periods.
We have found that declines during summer holidays, in comparison to BSH, were correlated to children's results in motor tests but not anthropometric measures. Generally, we found that better results in two motor tests (standing long jump and 300-meter running time) were correlated to a higher decrease in overall physical activity and MVPA but not to PI changes. This is the first study to evaluate motor tests as factors of physical activity decline during summer holidays. Although correlations were moderate, they explained the important 30% summer holidays decrease in MVPA variation.
Summer holidays, based on our results, are a time of large reduction in physical activity and an increase in physical inactivity in Slovenian children. This raises the question whether the same results would be achieved with older children and adolescents, as we know children and adolescents are undergoing an annual decrease in physical activity of up to 3.3% (4).
Our study was conducted prior to the COVID-19 epidemic. However, in the spring of 2020, we were hit by a global epidemic of the COVID-19, which brought lower physical activity, less time outdoors, higher sedentary behavior (including screen leisure time) in children and adolescents (42, 43). In addition, during the restrictive measures (closure of sport activities) due to the COVID-19 outbreak, up to 29% of children and adolescents showed no interest in continuing to engage in sport after the end of the first wave COVID-19 epidemic (44). It is obvious that such global effects need to be intervened on to assure health and motor efficiency of new-generation children.
We could conclude that physical activity decreases importantly during summer holidays and remains decreased after summer holidays. The greatest effect of summer holidays was found in decreased MVPA; however, increased physical inactivity should not be neglected. Although at the start of new school year the FU effects of summer holidays were restored, it should be noted, that overall physical activity remained 8.8% lower than before the summer holidays.
Data Availability Statement
The raw data supporting the conclusions of this article will be made available by the authors, without undue reservation.
Ethics Statement
The studies involving human participants were reviewed and approved by Slovenian National Medical Ethics Committee (approval number: 153/07/09). Written informed consent to participate in this study was provided by the participants' legal guardian/next of kin.
Author Contributions
TV and BŠ: conception of the study, data assessment and analysis, and writing the manuscript. RP and JP: conception of the study and writing the manuscript. All authors contributed to the article and approved the submitted version.
Funding
We declare that the only funding we obtained was from the Slovenian Research Agency (in combination with the Slovenian Ministry of Education and Sport) by financing the project entitled Children Amidst Influences of Modern Lifestyle—Motor Abilities, Physical Characteristics and Health Status of Slovenian Children which was coordinated by the Institute for Kinesiology Research, Science and Research Centre of Koper.
Conflict of Interest
The authors declare that the research was conducted in the absence of any commercial or financial relationships that could be construed as a potential conflict of interest.
Acknowledgments
This study was conducted along with the target-research project of the Slovenian Research Agency and the Slovenian Ministry of Education and Sport entitled Children Amidst Influences of Modern Lifestyle—Motor Abilities, Physical Characteristics and Health Status of Slovenian Children and coordinated by the Institute for Kinesiology Research, Science and Research Centre of Koper.
References
1. Fox K, Riddoch CJ. At Least Five a Week- Evidence on the Impact of Physical Activity and Its Relationship to Health. A Report From the Chief Medical Officer (2004).
2. Strong WB, Malina RM, Blimkie CJR, Daniels SR, Dishman RK, Gutin B, et al. Evidence based physical activity for school-age youth. J Pediatr. (2005) 146:732–7. doi: 10.1016/j.jpeds.2005.01.055
3. Jose KA, Blizzard L, Dwyer T, McKercher C, Venn AJ. Childhood and adolescent predictors of leisure time physical activity during the transition from adolescence to adulthood: a population based cohort study. Int J Behav Nutr Phys Act. (2011) 8:54. doi: 10.1186/1479-5868-8-54
4. Volmut T, Pišot R, Šimunič B. Objectively measured physical activity in children aged from 5 to 8 years/objektivno izmerjena gibalna aktivnost od pet- do osemletnih otrok. Slov J Public Health. (2013) 52:9–18. doi: 10.2478/sjph-2013-0002
5. Lounassalo I, Salin K, Kankaanpää A, Hirvensalo M, Palomäki S, Tolvanen A, et al. Distinct trajectories of physical activity and related factors during the life course in the general population: a systematic review. BMC Public Health. (2019) 19:271. doi: 10.1186/s12889-019-6513-y
6. Pratt M, Macera CA, Blanton C. Levels of physical activity and inactivity in children and adults in the United States: current evidence and research issues. Med Sci Sport Exerc. (1999) 31:S526. doi: 10.1097/00005768-199911001-00007
7. Gordon-Larsen P, McMurray RG, Popkin BM. Determinants of adolescent physical activity and inactivity patterns. Pediatrics. (2000) 105:e83. doi: 10.1542/peds.105.6.e83
8. Jurak G, Kovac M, Strel J. How Slovene primary school pupils spend their summer holidays. Prezivljanje Poletnih Pocitnic Slovenskih osnovnosolcev Kinesiol Slov. (2002) 8:35–43.
9. Riddoch CJ, Mattocks C, Deere K, Sounders J, Kirkby J, Tilling K, et al. Objective measurement of levels and patterns of physical activity. Arch Dis Child. (2007) 92:963–9. doi: 10.1136/adc.2006.112136
10. Bringolf-Isler B, Grize L, Mäder U, Ruch N, Sennhauser FH, Braun-Fahrländer C. Assessment of intensity, prevalence and duration of everyday activities in Swiss school children: a cross-sectional analysis of accelerometer and diary data. Int J Behav Nutr Phys Act. (2009) 6:50. doi: 10.1186/1479-5868-6-50
11. Kolle E, Steene-Johannessen J, Andersen LB, Anderssen SA. Seasonal variation in objectively assessed physical activity among children and adolescents in Norway: a cross-sectional study. Int J Behav Nutr Phys Act. (2009) 6:36. doi: 10.1186/1479-5868-6-36
12. Goodman A, Paskins J, Mackett R. Day Length and weather effects on children's physical activity and participation in play, sports, and active travel. J Phys Act Health. (2012) 9:1105–16. doi: 10.1123/jpah.9.8.1105
13. Harrison F, Atkin AJ, van Sluijs EMF, Jones AP. Seasonality in swimming and cycling: exploring a limitation of accelerometer based studies. Prev Med Rep. (2017) 7:16–9. doi: 10.1016/j.pmedr.2017.04.006
14. Fisher A, Reilly JJ, Montgomery C, Kelly LA, Williamson A, Jackson DM, et al. Seasonality in physical activity and sedentary behavior in young children. Pediatr Exerc Sci. (2005) 17:31–40. doi: 10.1123/pes.17.1.31
15. Christodoulos AD, Flouris AD, Tokmakidis SP. Obesity and physical fitness of pre-adolescent children during the academic year and the summer period: effects of organized physical activity. J Child Health Care. (2006) 10:199–212. doi: 10.1177/1367493506066481
16. Rowlands AV, Pilgrim EL, Eston RG. Seasonal changes in children's physical activity: an examination of group changes, intra-individual variability and consistency in activity pattern across season. Ann Hum Biol. (2009) 36:363–78. doi: 10.1080/03014460902824220
17. McKee DP, Murtagh EM, Boreham CAG, Nevill AM, Murphy MH. Seasonal and annual variation in young children's physical activity. Med Sci Sport Exerc. (2012) 44:1318–24. doi: 10.1249/MSS.0b013e3182464db5
18. McCue MC, Marlatt KL, Sirard J. Examination of changes in youth diet and physical activity over the summer vacation period. Internet J Allied Health Sci Pract. (2013) 11:8. Available online at: https://nsuworks.nova.edu/ijahsp/vol11/iss1/8/
19. Soini A, Tammelin T, Sääkslahti A, Watt A, Villberg J, Kettunen T, et al. Seasonal and daily variation in physical activity among three-year-old Finnish preschool children. Early Child Dev Care. (2014) 184:589–601. doi: 10.1080/03004430.2013.804070
20. Ridgers ND, Salmon J, Timperio A. Too hot to move? Objectively assessed seasonal changes in Australian children's physical activity. Int J Behav Nutr Phys Act. (2015) 12:77. doi: 10.1186/s12966-015-0245-x
21. Atkin AJ, Sharp SJ, Harrison F, Brage S, Van Sluijs EMF. Seasonal variation in children's physical activity and sedentary time. Med Sci Sport Exerc. (2016) 48:449–56. doi: 10.1249/MSS.0000000000000786
22. Tanaka C, Reilly JJ, Tanaka M, Tanaka S. Seasonal changes in objectively measured sedentary behavior and physical activity in Japanese primary school children. BMC Public Health. (2016) 16:969. doi: 10.1186/s12889-016-3633-5
23. Brazendale K, Beets MW, Weaver RG, Chandler JL, Randel AB, Turner-McGrievy GM, et al. Children's moderate to vigorous physical activity attending summer day camps. Am J Prev Med. (2017) 53:78–84. doi: 10.1016/j.amepre.2017.01.019
24. Brazendale K, Beets MW, Turner-McGrievy GM, Kaczynski AT, Pate RR, Weaver RG. Children's obesogenic behaviors during summer versus school: a within-person comparison. J Sch Health. (2018) 88:886–92. doi: 10.1111/josh.12699
25. Fu Y, Brusseau TA, Hannon JC, Burns RD. Effect of a 12-week summer break on school day physical activity and health-related fitness in low-income children from CSPAP schools. J Environ Public Health. (2017) 2017:1–7. doi: 10.1155/2017/9760817
26. Nagy LC, Faisal M, Horne M, Collings P, Barber S, Mohammed M. Factors associated with accelerometer measured movement behaviours among White British and South Asian children aged 6–8 years during school terms and school holidays. BMJ Open. (2019) 9:e025071. doi: 10.1136/bmjopen-2018-025071
27. Carson V, Spence JC. Seasonal variation in physical activity among children and adolescents: a review. Pediatr Exerc Sci. (2010) 22:81–92. doi: 10.1123/pes.22.1.81
28. Rich C, Griffiths LJ, Dezateux C. Seasonal variation in accelerometer-determined sedentary behaviour and physical activity in children: a review. Int J Behav Nutr Phys Act. (2012) 9:49. doi: 10.1186/1479-5868-9-49
29. Williams DP, Going SB, Lohman TG, Harsha DW, Srinivasan SR, Webber LS, et al. Body fatness and risk for elevated blood pressure, total cholesterol, and serum lipoprotein ratios in children and adolescents. Am J Public Health. (1992) 82:358–63. doi: 10.2105/AJPH.82.3.358
30. Catellier DJ, Hannah PJ, Murray DM, Addy CL, Conway TL, Yang S, et al. Imputation of missing data when measuring physical activity by accelerometry. Med Sci Sport Exerc. (2005) 37:S555–62. doi: 10.1249/01.mss.0000185651.59486.4e
31. Puyau MR, Adolph AL, Vohra FA, Butte NF. Validation and calibration of physical activity monitors in children. Obes Res. (2002) 10:150–7. doi: 10.1038/oby.2002.24
32. Tucker P, Gilliland J. The effect of season and weather on physical activity: a systematic review. Public Health. (2007) 121:909–22. doi: 10.1016/j.puhe.2007.04.009
33. Lewis LK, Maher C, Belanger K, Tremblay M, Chaput J-P, Olds T. At the mercy of the gods: associations between weather, physical activity, and sedentary time in children. Pediatr Exerc Sci. (2016) 28:152–63. doi: 10.1123/pes.2015-0076
34. Klesges RC, Eck LH, Hanson CL, Haddock CK, Klesges LM. Effects of obesity, social interactions, and physical environment on physical activity in preschoolers. Health Psychol. (1990) 9:435–49. doi: 10.1037/0278-6133.9.4.435
35. Baranowski T, Thompson WO, Durant RH, Baranowski J, Puhl J. Observations on physical activity in physical locations: ager gender, ethnicity, and month effects. Res Q Exerc Sport. (1993) 64:127–33. doi: 10.1080/02701367.1993.10608789
36. Nelson MC, Neumark-Stzainer D, Hannan PJ, Sirard JR, Story M. Longitudinal and secular trends in physical activity and sedentary behavior during adolescence. Pediatrics. (2006) 118:e1627–34. doi: 10.1542/peds.2006-0926
37. Boone JE, Gordon-Larsen P, Adair LS, Popkin BM. Screen time and physical activity during adolescence: longitudinal effects on obesity in young adulthood. Int J Behav Nutr Phys Act. (2007) 4:26. doi: 10.1186/1479-5868-4-26
38. Gillis L McDowell M Bar-Or O. Relationship between summer vacation weight gain and lack of success in a pediatric weight control program. Eat Behav. (2005) 6:137–43. doi: 10.1016/j.eatbeh.2004.08.002
39. Aibar A, Chanal J. Physical education: the effect of epoch lengths on children's physical activity in a structured context. PLoS ONE. (2015) 10:e0121238. doi: 10.1371/journal.pone.0121238
40. Herman Hansen B, Børtnes I, Hildebrand M, Holme I, Kolle E, Anderssen SA. Validity of the ActiGraph GT1M during walking and cycling. J Sports Sci. (2014) 32:510–6. doi: 10.1080/02640414.2013.844347
41. Dannacker KL, Sazonova NA, Melanson EL, Sazonov ES, Browning RC. A comparison of energy expenditure estimation of several physical activity monitors. Med Sci Sport Exerc. (2013) 45:2105–12. doi: 10.1249/MSS.0b013e318299d2eb
42. Dunton GF, Do B, Wang SD. Early effects of the COVID-19 pandemic on physical activity and sedentary behavior in children living in the U.S. BMC Public Health. (2020) 20:1351. doi: 10.1186/s12889-020-09429-3
43. Moore SA, Faulkner G, Rhodes RE, Brussoni M, Chulak-Bozzer T, Ferguson LJ, et al. Impact of the COVID-19 virus outbreak on movement and play behaviours of Canadian children and youth: a national survey. Int J Behav Nutr Phys Act. (2020) 17:85. doi: 10.1186/s12966-020-00987-8
44. Dorsch ET, Blazo AJ. Aspen Project Play: COVID-19 Parenting Survey. (2020). Available online at: https://www.aspenprojectplay.org/state-of-play-2020/pandemic-trends. (accessed November 18, 2020).
Keywords: MVPA, physical inactivity, sedentary behavior, vacations, accelerometer
Citation: Volmut T, Pišot R, Planinšec J and Šimunič B (2021) Physical Activity Drops During Summer Holidays for 6- to 9-Year-Old Children. Front. Public Health 8:631141. doi: 10.3389/fpubh.2020.631141
Received: 19 November 2020; Accepted: 21 December 2020;
Published: 18 January 2021.
Edited by:
Patrick De Boever, University of Antwerp, BelgiumReviewed by:
Jugesh Chhatwal, Kalpana Chawla Government Medical College and Hospital, IndiaSimonetta D'Ercole, G. D'Annunzio University of Chieti-Pescara, Italy
Copyright © 2021 Volmut, Pišot, Planinšec and Šimunič. This is an open-access article distributed under the terms of the Creative Commons Attribution License (CC BY). The use, distribution or reproduction in other forums is permitted, provided the original author(s) and the copyright owner(s) are credited and that the original publication in this journal is cited, in accordance with accepted academic practice. No use, distribution or reproduction is permitted which does not comply with these terms.
*Correspondence: Boštjan Šimunič, bostjan.simunic@zrs-kp.si