Article

Evaluating Short-Term Impacts of Forest Management and Microsite Conditions on Understory Vegetation in Temperate Fir-Beech Forests: Floristic, Ecological, and Trait-Based Perspective

1
Department of Forest Ecology, Slovenian Forestry Institute, Večna pot 2, 1000 Ljubljana, Slovenia
2
Higher Vocational College for Forestry and Hunting, Ljubljanska cesta 2, 6230 Postojna, Slovenia
3
Department of Agronomy, Biotechnical Faculty, University of Ljubljana, Jamnikarjeva 101, 1000 Ljubljana, Slovenia
*
Author to whom correspondence should be addressed.
Forests 2019, 10(10), 909; https://doi.org/10.3390/f10100909
Submission received: 4 September 2019 / Revised: 1 October 2019 / Accepted: 14 October 2019 / Published: 16 October 2019
(This article belongs to the Special Issue Role of Gap Factors in Forest Tree Regeneration and Plant Communities)

Abstract

:
Forest understory vegetation is largely influenced by disturbances and given local abiotic conditions. Our research focuses on the early response of understory vegetation to various forest management intensities in Dinaric fir-beech forests in Slovenia: (i) control, (ii) 50% cut of stand growing stock, and (iii) 100% cut of stand growing stock. Apart from identifying overstory removal effects, we were interested in fine-scale variation of understory vegetation and environmental determinants of its species composition. Vegetation was sampled within 27 karst sinkholes, which represent a dominant landform in studied forests. Within each sinkhole, five sampling plots, varying in slope aspect (centre, north, east, south, west), were established (135 in total), where pre-treatment (in 2012) and post-treatment (in 2014) floristic surveys were conducted. The sampled understory species were characterized in terms of Ellenberg’s indicator values (EIVs) and plant functional traits (plant height, seed mass, specific leaf area, leaf dry matter content). Diversity metrics (species richness, total cover, Shannon index) increased in plots where the silvicultural measures were applied. Tree species richness also increased in 100% cutting. A redundancy analysis revealed that species composition was related to environmental variables, which are directly influenced by management interventions (overstory canopy cover, microclimate—maximum daily temperature, soil properties—thickness of organic soil layer) as well as by topographic factors (slope inclination and surface rockiness). EIVs for light were significantly affected by treatment intensity, whereas soil-related EIVs (moisture, reaction, nutrients) depended more on the within-sinkhole position. Canopy gaps, compared with uncut control plots, hosted a higher number of colonizing species with a higher plant height and smaller seeds, while leaf traits did not show a clear response. We found a negative correlation between pre-treatment species (functional) richness and post-treatment shifts in floristic (functional) composition. Plots with higher richness exhibited smaller changes compared with species-poor communities. Incorporating different perspectives, the results of this study offer valuable insights into patterns of understory vegetation response to forest management in fir-beech forests.

1. Introduction

One of the main ideas of sustainable, close-to-nature forest management is to mimic the natural disturbance regimes and forest dynamics as close as possible [1,2,3]. These approaches try to achieve a consensus between conserving biological diversity and fulfilment of management goals focused toward timber production. Balancing ecologically- and nature conservation-oriented obligations derived from European Union Directives (e.g., Natura 2000 sites) on one hand, and increasing frequency of large-scale severe natural and management-related disturbances (e.g., salvage logging) throughout the Europe [4] on the other, is now becoming an important, but sometimes very challenging task [5,6]. Studies investigating the response of different components of forest biota to such environmental changes can provide valuable knowledge, but the results about the impacts of forest management on forest biodiversity are still inconsistent [7]. However, comparisons of unmanaged and managed European forests with varying management types and intensities (e.g., [2,8,9]) have led to a general conclusion that plant species and functional diversity in the understory layer tend to be higher in sustainably managed forests. This is mainly because of the co-existence of species with different ecological requirements and resource acquisition strategies, for example, shade-tolerant forest specialists versus shade-intolerant open-habitat species [10,11,12]. High plant species richness indicates management-related disturbances rather than the conservation status of forests [5].
The most prominent and visible management action in a forest stand is the removal of trees, which immediately changes stand density and structure. Canopy gaps have long been used as a tool to manage forest ecosystems, with the primary objective to promote the regeneration of tree species and maintain the overstory layer diversity [10]. In forests, where large, stand-replacing disturbances are not common owing to prevailing patterns of small-scale natural disturbance regimes and/or less intense silvicultural measures (e.g., single tree selection or group selection), it is important to assess how these forests respond to alternative, more intensive management practices. Traditionally, forest managers and silviculturalists have paid more attention to the woody (tree) regeneration within canopy gaps, while herbaceous understory plants are often neglected [13], although they contribute a major proportion to ground-layer species abundance and floristic diversity in temperate forests [14,15]. In comparison with woody species, they are also more responsive to management-related disturbances [5]. Indeed, this layer can have a significant impact on the establishment and later success of tree species as the development of dense herbaceous vegetation layers can slow, alter, or even stop tree regeneration trajectories following gap creation [16,17].
An extensive list of past studies (e.g., [18,19,20,21]) has provided evidence that factors related to stand structure (e.g., forest canopy) drive the composition and diversity of the understory strata by exerting strong controls on resource quantity and heterogeneity [11,14]. However, at finer spatial scales, environmental factors other than light transmittance, which is directly influenced by silvicultural measures, contribute to the patterns of species distribution and abundance, notably, topography, microclimate, nutrient availability, soil moisture, and soil acidity [22,23]. As emphasized by the authors of [24], site-specific characteristics have a larger role to play in defining understory plant diversity than the management disturbance itself. Specific microsite conditions can interact with changes related directly to forest management or can, in some cases, even offset silvicultural effects. For instance, the slope aspect influences the spatial distribution of vascular plants, through its impact on microclimate [25]. Such interactions can exert considerable control over post-disturbance plant dynamics. Previous studies (e.g., [12,26,27]) demonstrated the phenomenon of gap partitioning (sorting of species along gradients of light availability), where the composition of plant communities is differentiated by the gap position or distance from the forest edge [17]. However, canopy gaps may have substantial spatial heterogeneity on even smaller distances, particularly where terrain configuration is very diverse [22]. Thus, the fine-scale spatial patterning of forest ground-layer plant communities, as a response to resource gradients, can be quite complex [14].
Species composition of the local plant community and the presence of specific plants reflect the key environmental conditions of a (micro)site [28]. Moreover, responses of plant communities to environmental changes induced by disturbances can be captured by plant functional traits [29], which are closely connected to given abiotic conditions, as the trait–environment relationship has been shown to remain strong despite significant compositional changes over time [11,30]. Therefore, to obtain deeper insights about the changes in understory vegetation following management practices, such research questions should not be solely addressed from a floristic perspective, but also from an ecological point of view (e.g., using Ellenberg indicator values), and should be analyzed based on species traits [13,31]. Furthermore, human-induced disturbances affect plant communities for decades, but the extent of temporal change in community composition may depend more on environmental gradients and community attributes [32]. In the context of community resistance and the stability of forest understory, a compositional response to canopy reduction or complete removal may be strongly influenced by pre-disturbance community features, such as species richness and evenness [33,34].
Here, we evaluated the short-term response of understory vegetation in a topographically diverse forest landscape to different cutting treatments, representing a gradient in forest management intensity. Specifically, we addressed the following questions: (1) How do management intensity and microsite conditions (topography, overstory structure, microclimate, soil parameters) affect diversity, abundance, and species composition of the herb and shrub layer? (2) Are ecological (estimated by Ellenberg indicator values) and functional (estimated by plant traits) aspects of understory communities more affected by management intensity or local topographic factors (i.e., slope aspect)? (3) Whether the degree of compositional and functional shift is associated with pre-disturbance community attributes, that is, species and functional richness?

2. Materials and Methods

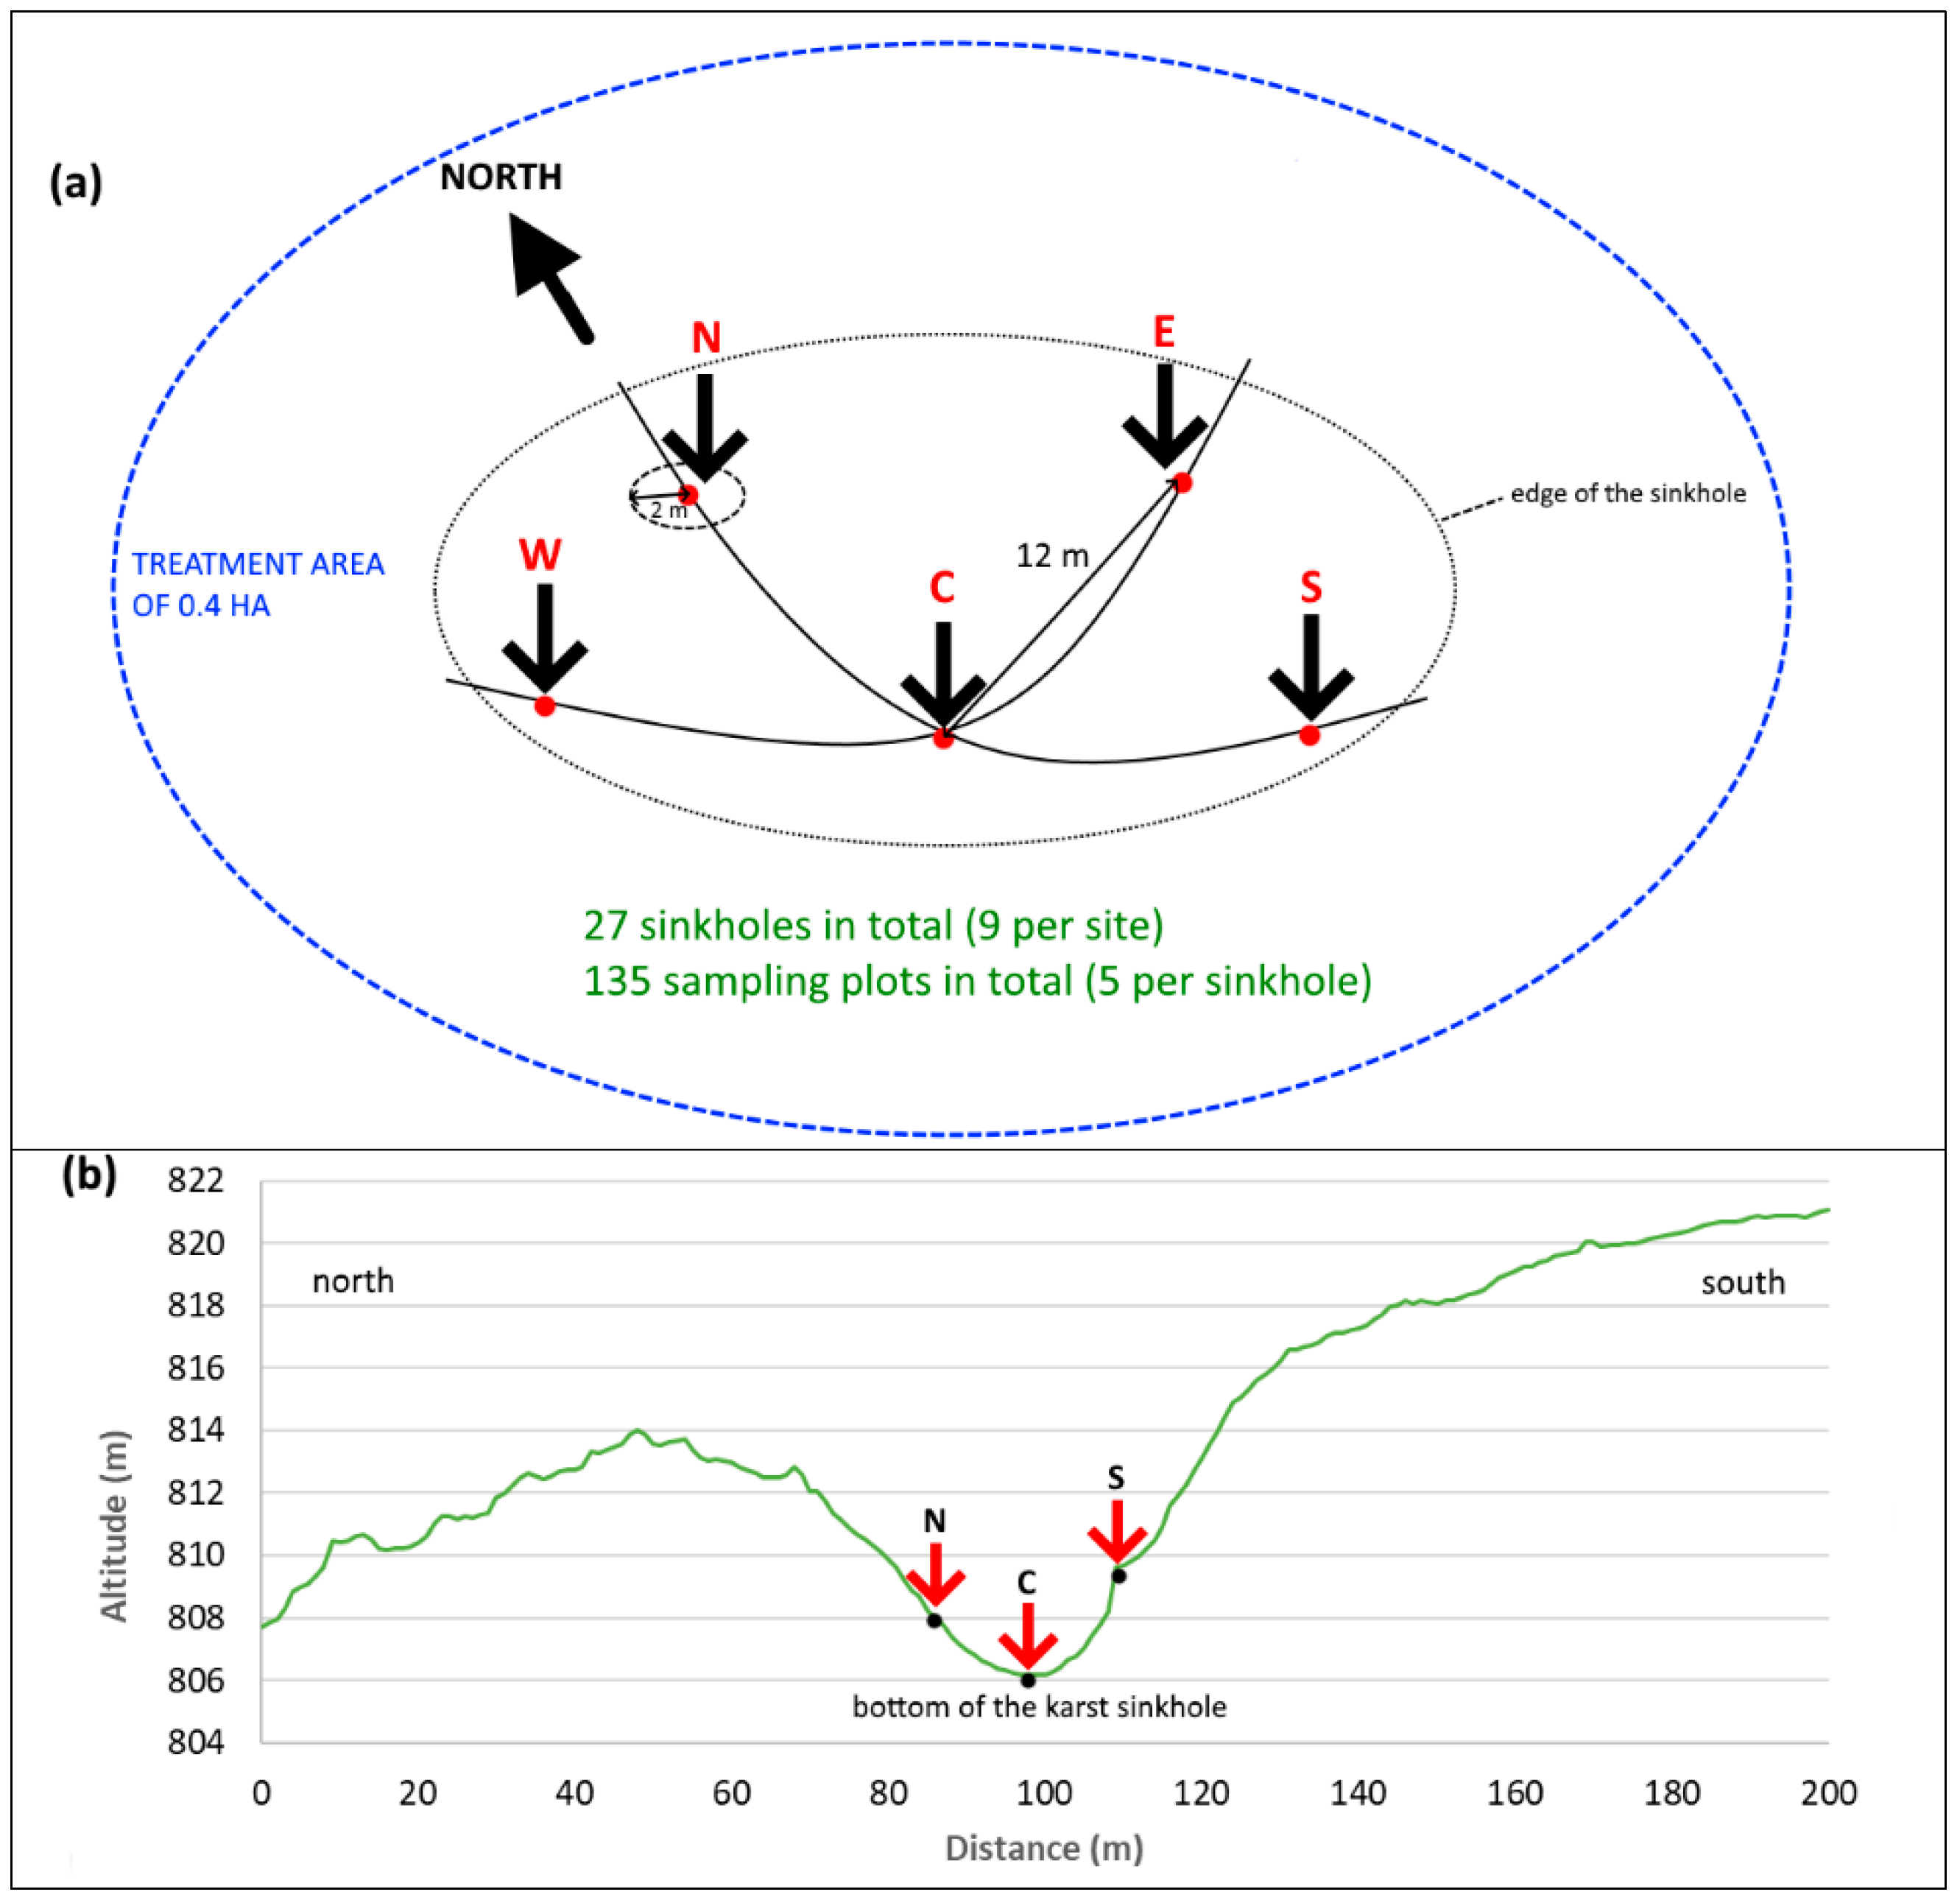
2.1. Study Design and Vegetation Sampling Methodology

Three study locations in Dinaric fir-beech forests, located in the western (Trnovo), southern (Snežnik), and south-eastern (Kočevski Rog) part of Slovenia, were selected. For details about our study area, see the work of [35]. Before experimental treatments were implemented, environmental conditions (geology, altitude, climate) and properties of forest stands (tree and understory species composition, stand structure) were comparable between the three locations. Most of our study forests consisted of vertically heterogeneous stands with Fagus sylvatica L., Abies alba Mill., and Picea abies (L.) Karst. as dominant tree species. Other woody species, recorded in the tree layer as admixing species, were Acer pseudoplatanus L., Fraxinus excelsior L., and Ulmus glabra Huds. In the understory, stands of the Omphalodo-Fagetum association contain European floristic elements and Illyrian species with the main distributional range in the Balkan Peninsula (Dinaric Mountains). The shrub layer was rather scarce, and it mainly consisted of the advanced regeneration of shade-tolerant (beech, fir) saplings, with a lower cover of shrub species (e.g., Lonicera nigra L., Corylus avellana L., Daphne mezereum L.). The herb layer was formed by general and mesic forest species, including geophytes and shade-tolerant summer forbs, many fern species, and some graminoids (sedges, grasses, and rushes). Dominant herbaceous species were Oxalis acetosella L., Galium odoratum L., Omphalodes verna Moench., Galeobdolon flavidum (F. Herm.) Holub, and Athyrium filix-femina (L.) Roth.
At each location, nine karst sinkholes (dolines) with comparable geomorphology were selected. Three different management intensities were implemented in 2012: (1) no management (control), (2) 50% of stand growing stock being cut with homogeneous spatial arrangement of residual trees (hereafter, 50% cut or partial cut), and (3) 100% of stand growing stock removal (hereafter, 100% cut or canopy gap). These treatments were implemented in circular treatment areas of 0.4 ha in size with the centre at the bottom of the sinkhole (Figure 1). Each treatment was replicated three times at each location. Tree cutting was performed between June and August 2012. Detailed information about our experimental design can be found in the works of [36,37].
In 2012, shortly before cutting treatments were implemented, at each sinkhole, we sampled forest vegetation in five circular plots with a radius of 2 m, resulting in 135 sampling plots in total (27 sinkholes × 5 plots within each sinkhole). One sampling plot was positioned in the centre/bottom of the sinkhole, and the other four in the northern, eastern, southern, and western side of the sinkhole (Figure 1a). These were 12 m away from the centre of the sinkhole. At each plot, we recorded all vascular plant species (woody and herbaceous species), and visually estimated their cover percentage according to the modified method of the work of [38] in three vertical vegetation layers: tree, shrub, and herb layer. For details on how layers were distinguished, see the work of [36]. Vegetation surveys in the year 2012 were made during the peak vegetation development, that is, between May 18 and July 10. Two years after the first sampling and implementation of cutting treatments, that is, in the year 2014, we re-sampled the vegetation in all plots following the exact same sampling protocol. Vegetation re-surveys in 2014 were carried out between May 29 and July 29.

2.2. Measurements of Post-Treatment Environmental Conditions

After the cutting, in each plot, we measured environmental variables related to topography (slope aspect in azimuth degrees clockwise from north, slope inclination in %) and estimated the percentage cover of surface rockiness (rocks/stones visible on the surface), woody debris (branches, logs, stumps), bare soil (developed soils not covered with understory vegetation), and the cover of mosses (growing on rocks, woody debris, and/or soil). Additionally, in the central (C), northern (N), and southern plots (S), that is, in 81 sampling plots altogether, measurements of different environmental factors related to overstory structure (canopy cover), microclimate (air temperature and relative humidity), and soil characteristics (thickness of organic soil layer, depth of mineral soil, soil pH) were conducted. These measurements were limited to the C, N, and S plots because we expected to detect more pronounced ecological gradients across the north–centre–south transect compared with the east–west direction. For instance, extreme microclimatic conditions were assumed (and later confirmed by results) to occur in more exposed positions, such as south-facing slopes. In addition, the decision to measure environmental factors only on a subset of all plots also reflected the rationality of planned sampling activities.
The assessment of the percent canopy closure was obtained from LiDAR scanning in 2013, after the implementation of cutting treatments. Canopy cover, as a proxy for light availability, was expressed as the percentage covered by overstory vegetation higher than 5 m. Air temperature (°C) and relative humidity (%) were recorded every 30 minutes for three consecutive growing seasons (May–October of 2012, 2013, and 2014) with sensors mounted 0.5 m above ground level. Sampling of soil parameters was done in 2014. We measured the thickness of the topsoil organic layer (Ol, Of, and Oh horizons) and depth of mineral soil. Soil samples were taken to the laboratory and pH was determined (0.01 M CaCl2).

2.3. Data Processing and Analysis

All analyses described in this section are based on the complete dataset for pre- and post-treatment understory communities (herb and shrub layer)—the tree layer was not included. Species richness (total number of species as a proxy for alpha diversity), the Shannon–Wiener diversity index (H’ = −∑ci ln ci, where ci is the proportional cover of the i-th species in the plot), and total understory cover (%—sum of cover of all species in the herb and shrub layer) were calculated for each plot. Additionally, using a sample-by-species matrix and function ‘vegdist’ in vegan R package [39], we calculated the pairwise Bray–Curtis dissimilarity index [40] and then expressed the mean sinkhole-level compositional variability (as a proxy for beta diversity) among plots positioned within the same sinkhole. We also made a separate analysis for tree species richness (total number of tree species in the plot) and tree species cover (total cover of tree species seedlings and saplings in the herb and shrub layer).
For each recorded plant species, we gathered data on their Ellenberg indicator values (EIVs) [41] and plant functional traits (PFTs). For some species, EIVs were complemented with Pignatti bioindicator values [42]. We used data for four widely-used functional traits: plant vegetative height, seed mass, specific leaf area (SLA), and leaf dry matter content (LDMC), following the leaf–height–seed scheme [43]. Plant height is positively related to the ability of plants to compete for light [43]. Seed mass is a proxy for the dispersal/establishment trade-off; high seed mass means low dispersal capacity, but a better chance to establish in post-disturbance habitats [44]. SLA (mm2/mg) and LDMC (mg/g) serve as an approximation of species position on the leaf economic spectrum. A high LDMC and low SLA indicate a more conservative strategy (e.g., stress tolerant species), including high resistance to harsh environmental conditions and herbivory, whereas the opposite display a more acquisitive strategy with a high photosynthetic or relative growth rate [45]. Plant height, seed mass, and SLA have been explicitly proposed to be involved in studies dealing with plant community responses to disturbance [46]. Data on species traits were obtained from online open source LEDA Traitbase [47].
To characterize the ecological conditions, we calculated mean plot-level Ellenberg indicator values. These were weighted by species abundances. To quantify the functional composition, we calculated the community-weighted trait mean (CWM) values (i.e., plot-level trait values weighted by species abundances; [48]) for each trait, using the ‘functcomp’ function in the FD package for R [49]. Height and seed mass were log-transformed. For height, we excluded the recorded woody species (shrubs and trees), because they were represented by seedlings/saplings in the herb and shrub layer, whereas the height in the database correspond to the adult plants. On the basis of these four traits, we also calculated a plot-level component of functional diversity, that is, functional richness, using the ‘dbFD’ function in FD package. Functional richness represents the range of functional space occupied by a species assemblage [50].
The understory vegetation data from 135 plots were analyzed using non-metric multidimensional scaling (NMDS); the species’ cover data were transformed using natural logarithm [51]. NMDS ordination (function ‘metaMDS’ in the vegan package) was done for the pre-treatment dataset (2012) and for the post-treatment dataset (2014), separately for each study location. To evaluate the differences in understory community composition between management intensities and within-sinkhole positions, we conducted a permutational multivariate analysis of variance (PERMANOVA, [52]; function ‘adonis’ in vegan) with 999 permutations and, at the same time, tested for homogeneity of multivariate dispersion (PERMDISP, [53]; function ‘betadisper’ in vegan).
In the trait-based analysis, principal component analysis (PCA, ‘pca’ function in the labdsv package for R; [54]) was used with CWMs of the four studied traits as supplementary descriptors; these were standardized to zero mean and unit standard deviation beforehand.
To describe the relationships between species composition patterns and the underlying environmental gradients, a transformation-based redundancy analysis (tb-RDA) was used. This was done based on vegetation relevés and measured environmental data from 81 post-treatment plots. We first carried out a detrended correspondence analysis (DCA) (function ‘decorana’ in vegan package) to check for the lengths of the gradients [55]. As the length of the first (longest) DCA axis was larger than 4.0 (indicating heterogeneous vegetation data), the use of the unimodal constrained ordination method (canonical correspondence analysis; [56]) should be preferred. However, as recommended by the authors of [57], the use of the linear constrained method (RDA) is still possible. Therefore, tb-RDA (‘rda’ function in the vegan package) was calculated based on Hellinger pre-transformed species composition data (function ‘decostand’ in the vegan package). To reduce noise in the dataset, species with only two occurrences in the whole dataset were removed from the analysis. The potential environmental explanatory variables were as follows: overstory canopy cover (%), daily maximum temperature—Tmax (°C; averaged across three growing seasons and study locations), daily minimum relative humidity (%; averaged across three growing seasons and locations), slope inclination (%), northness (=cos(aspect)), eastness (=sin(aspect)), surface rockiness (%), woody debris (%), cover of bare soil (%), cover of mosses (%), thickness of organic soil (cm), depth of mineral soil (cm), and soil pH. Before model construction, variables were standardized to zero mean and unit variance. To find out which of the potential predictors had a significant effect on understory species composition, forward selection of explanatory variables was used. In the process of finding the final model, we followed the workflow suggested by the author of [58]. To assess the relative contribution of environmental factors (selected in the final model) to the variance explained in community composition, variance partitioning was performed (function ‘varpart’ in the vegan package).
Linear mixed-effect models were built to explore the effects of silvicultural treatments (three levels), within-sinkhole position (five levels), and year of sampling (two levels) on diversity metrics (species richness, Shannon index, total understory cover, dissimilarity index), plot-level EIVs, and CWMs of PFTs. These models allow nested error structure [59] as the sinkholes were nested within the study location and sampling plots were nested within sinkholes. Thus, study location and sinkhole were used as random factors owing to the hierarchical structure of the data. The interaction term between fixed factors (treatment, position, year) was always tested, but we included this term in the final model only when it proved to be significant. If necessary, response variables were log-transformed prior to the analyses to achieve normality and homogeneity of residuals. The models’ goodness-of-fit values were measured by a likelihood-ratio test-based coefficient of determination (R2LR; [60]).
We used a simple linear regression analysis to examine the relationship between pre-treatment species richness and post-treatment compositional shifts. For each plot, compositional shift was measured as the Euclidean distance (vector length) between the two points, that is, pre-treatment and post-treatment position of sample unit (plot) in the NMDS ordination space. Compositional resistance and stability are inversely related to the Euclidean distance: resistance is maximal when the sample unit maintains its initial position in ordination space, that is, the Euclidean distance equals 0 [34]. For the trait-based analysis, we also calculated the Euclidean distance (from sample scores) between the initial and post-treatment position of each plot in the PCA ordination space. The relationship between pre-treatment functional richness and shifts in PCA ordination space was examined using regression analysis as well.
All statistical analyses were performed using R software [61].

3. Results

In total, 133 different vascular plant species were recorded in 2012. By far, the most diverse species group was forbs (74 species), followed by ferns (19), shrub species (15), graminoids (13), and tree species (12). After the cutting (2014), the total species pool increased to 208 different vascular plant species in the shrub and herb layer: 133 forb species (80% increase), 24 graminoids (85% increase), 20 shrub species (33% increase), 18 fern species (5% decrease), and 13 tree species (8% increase).

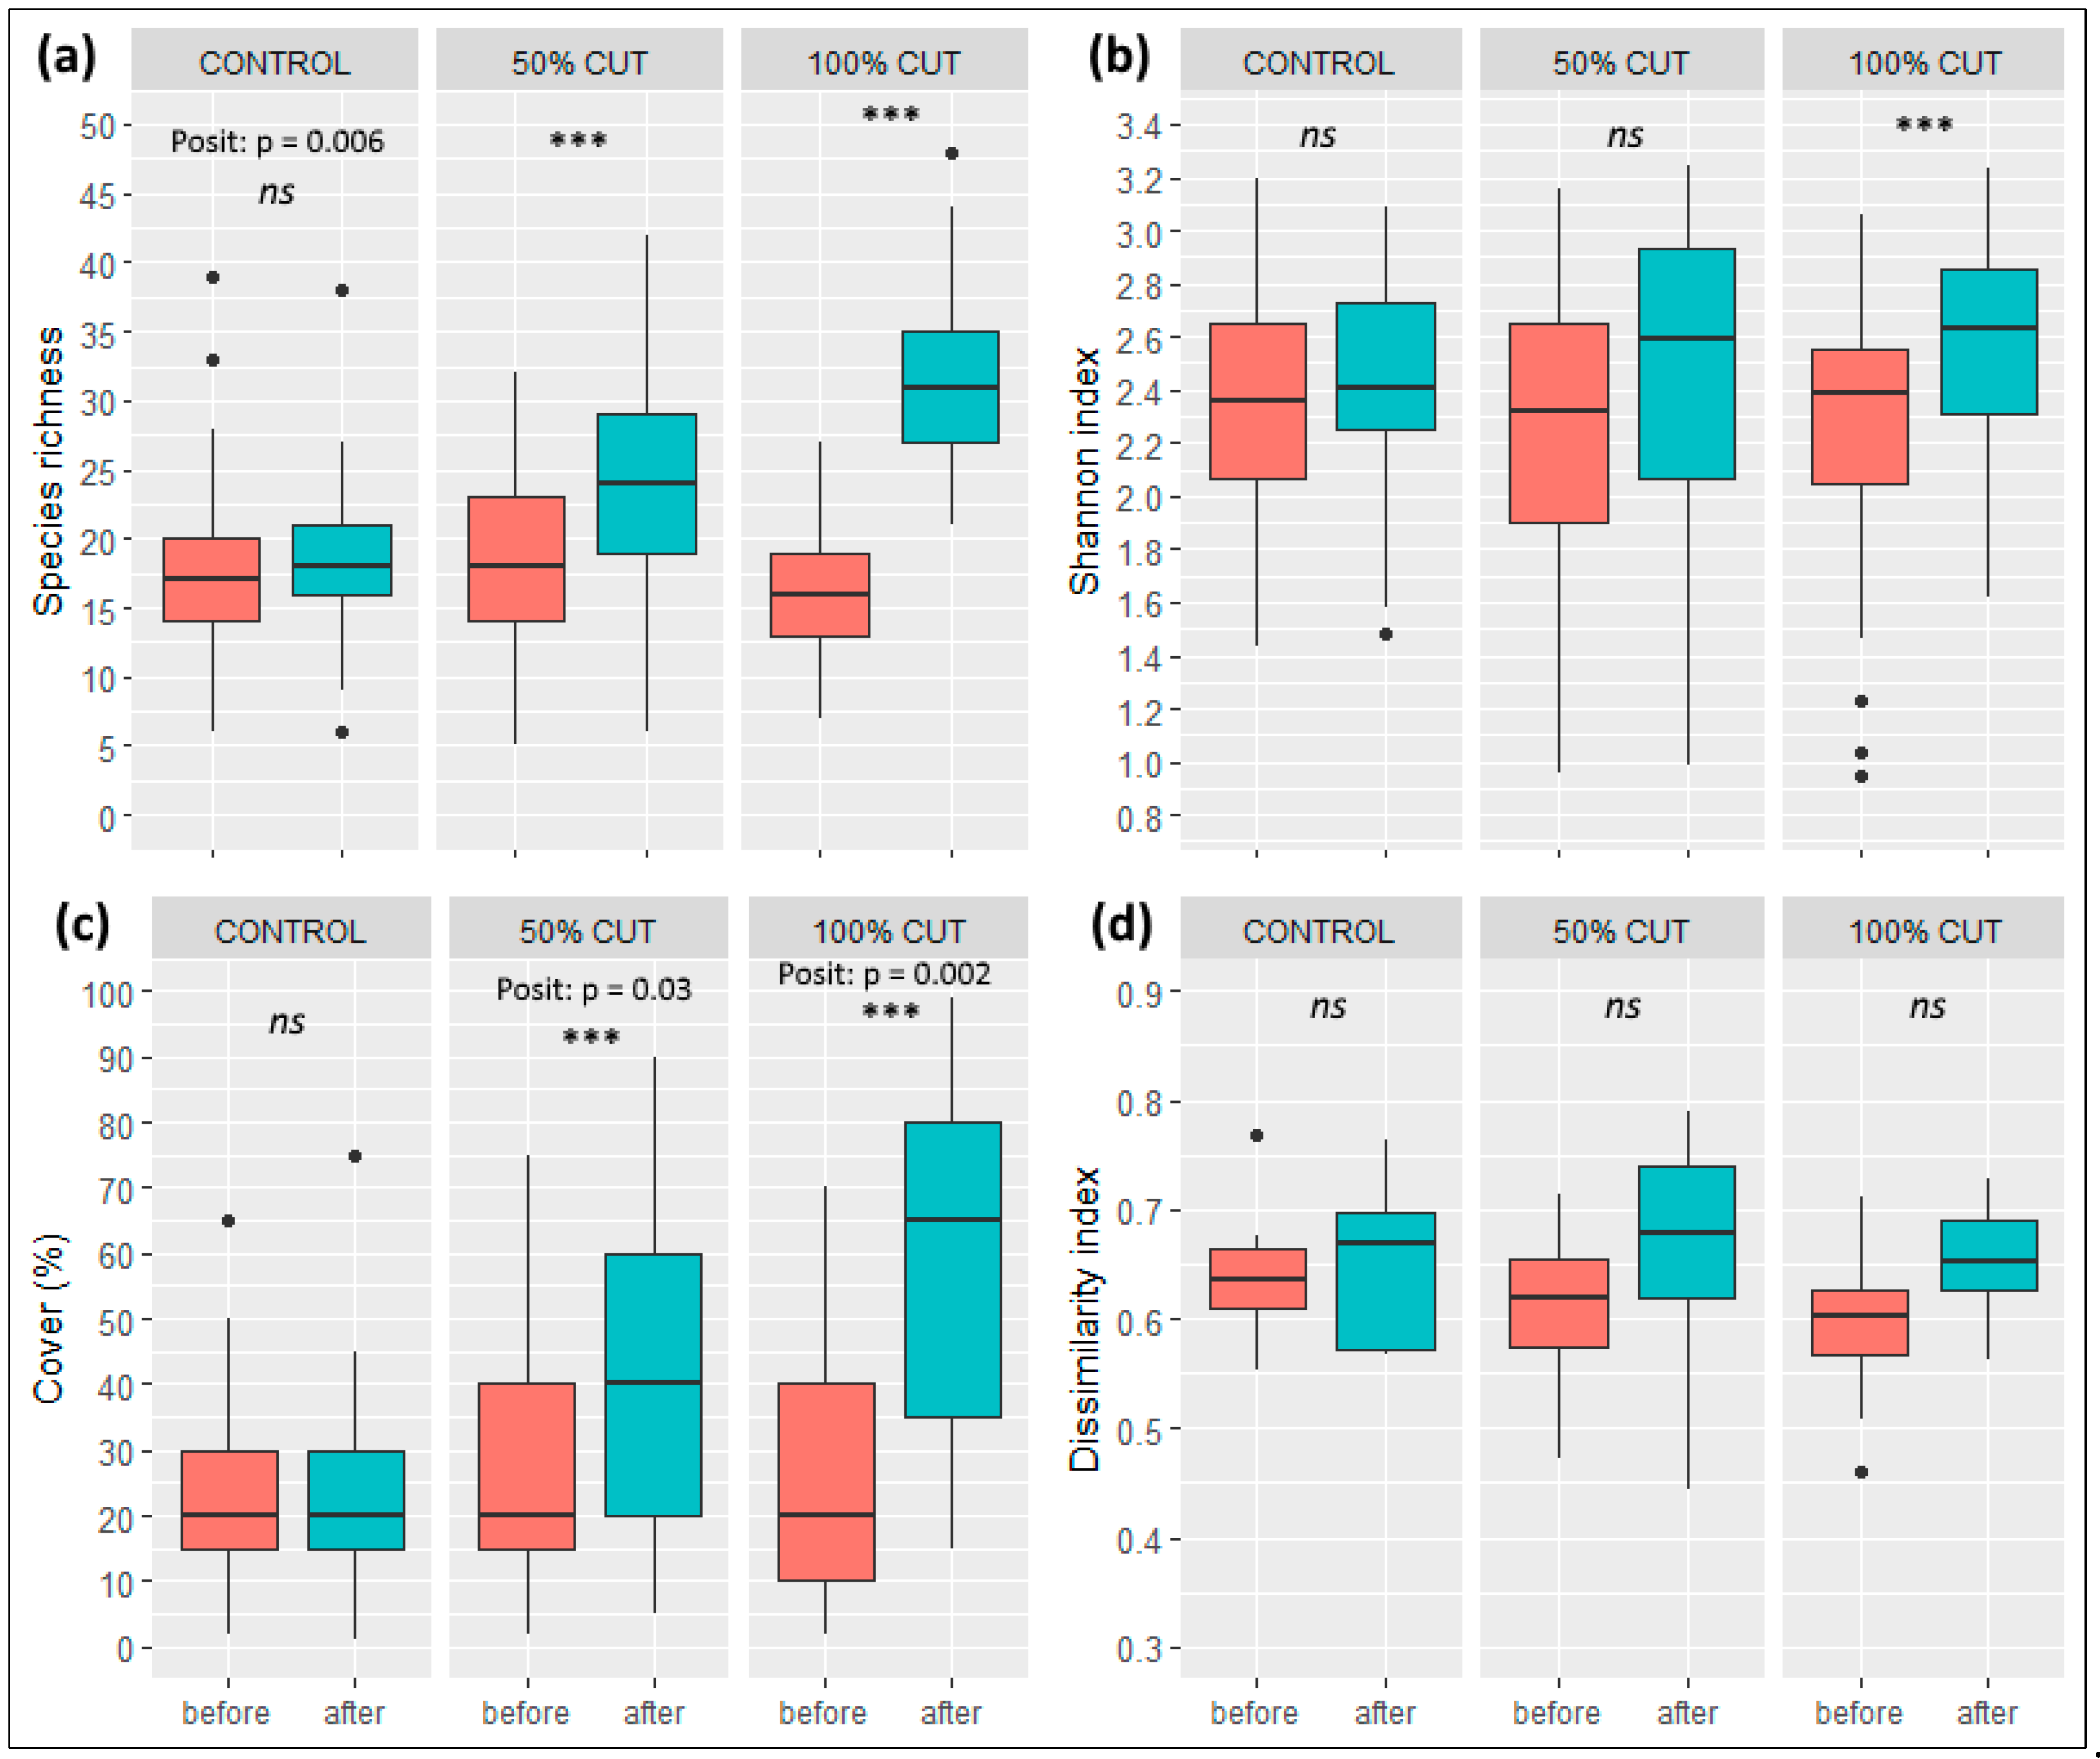
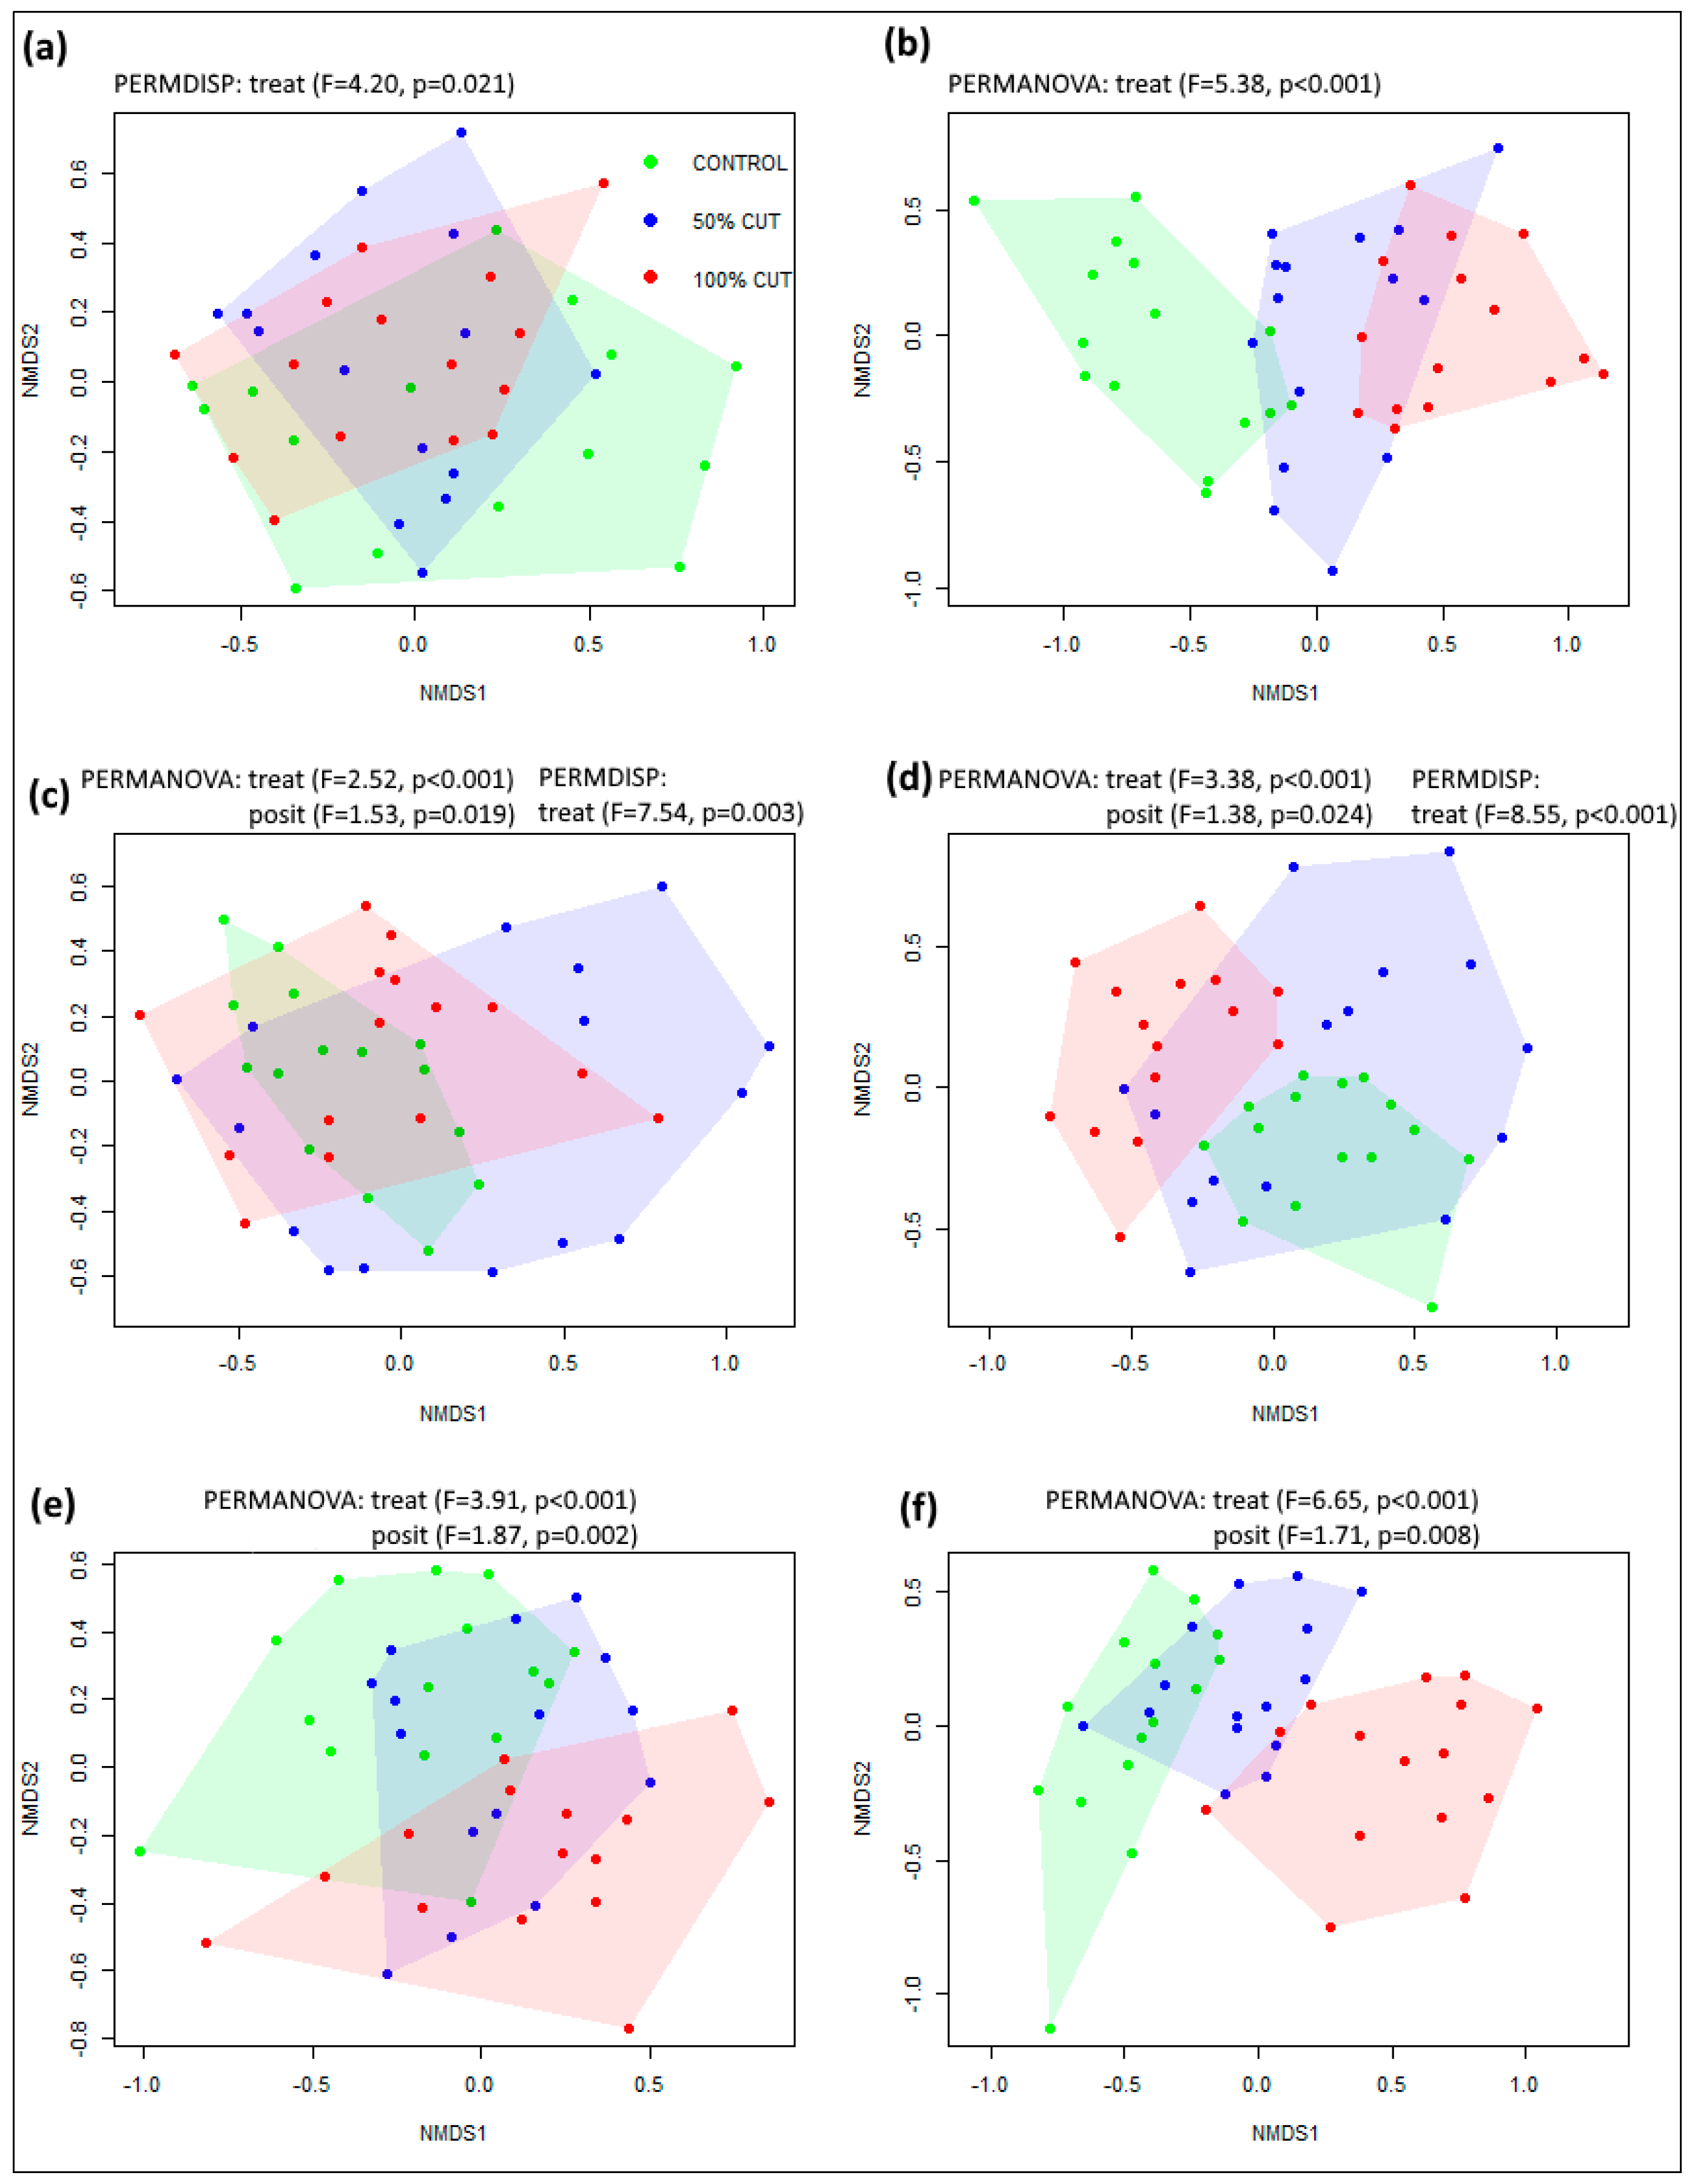
3.1. Changes in Species Diversity and Composition

All species diversity metrics showed an increase after the cutting. Understory species richness was significantly affected by the year of sampling, treatment intensity, and within-sinkhole position (Table 1, Figure 2). Post-treatment richness was higher compared with pre-treatment richness for all treatments, but it significantly increased only in 50% and 100% cutting. The highest species richness was on average observed in the southern plots in canopy gaps (mean ± SD: 34.1 ± 4.9) and the lowest in the western control plots (16.4 ± 5.7). The Shannon diversity index also increased after the treatment in 100% cutting (from 2.27 ± 0.48 to 2.57 ± 0.39), whereas the increase was not significant in the control and partially (50%) cut plots. Similar to species richness, the total cover of the shrub and herb layer was significantly affected by all three fixed factors and some interaction terms (Table 1). Before the treatments, the mean cover was 25.3% (mean for all treatments), after which it increased to 42.5% (overall mean for partial cut) and 60.2% (overall mean for canopy gaps), respectively. The highest cover was observed for the central plots in canopy gaps (73.8% ± 25.2%). The dissimilarity index, as a measure of how different (in terms of species composition) plots were within the same sinkhole, was not significantly affected by management intensity. This index increased (not significantly) after the treatments and also slightly increased in the control stands (Figure 2), indicating that the post-treatment plots within the same sinkhole were more dissimilar compared with the pre-treatment status.
The only significant change in tree species richness was observed for 100% cutting, where the mean tree species richness increased (from 2.9 to 3.5) after the cutting (F = 3.99, p = 0.049) (data not shown). Changes in the cover of tree species in the understory layer were not affected by management intensity, within-sinkhole position, or sampling year (Table 1).
In the post-treatment understory communities, treatment intensity had a strong effect on species composition (Figure 3). At all three study locations, post-treatment control and 100% cut plots displayed an evident distinction in the NMDS ordination space. In most cases, partially cut stands exhibited the highest dispersion of plots around the management category centroid. According to the results from PERMANOVA, we found that for two locations (Snežnik and Kočevski Rog) in 2012, plots belonging to different treatments differed in species composition. The significance of these results could be explained by different degrees of dispersion of plots around the management category centroid, as indicated by PERMDISP outputs (Figure 3c). Overall, NMDS ordination diagrams showed that the overlap of pre-treatment communities was considerable, suggesting rather minor differences in species composition (Figure 3a,c,e). Within-sinkhole position had a significant effect on post-treatment species composition at two sites, but compared with treatment intensity, this effect was much smaller.

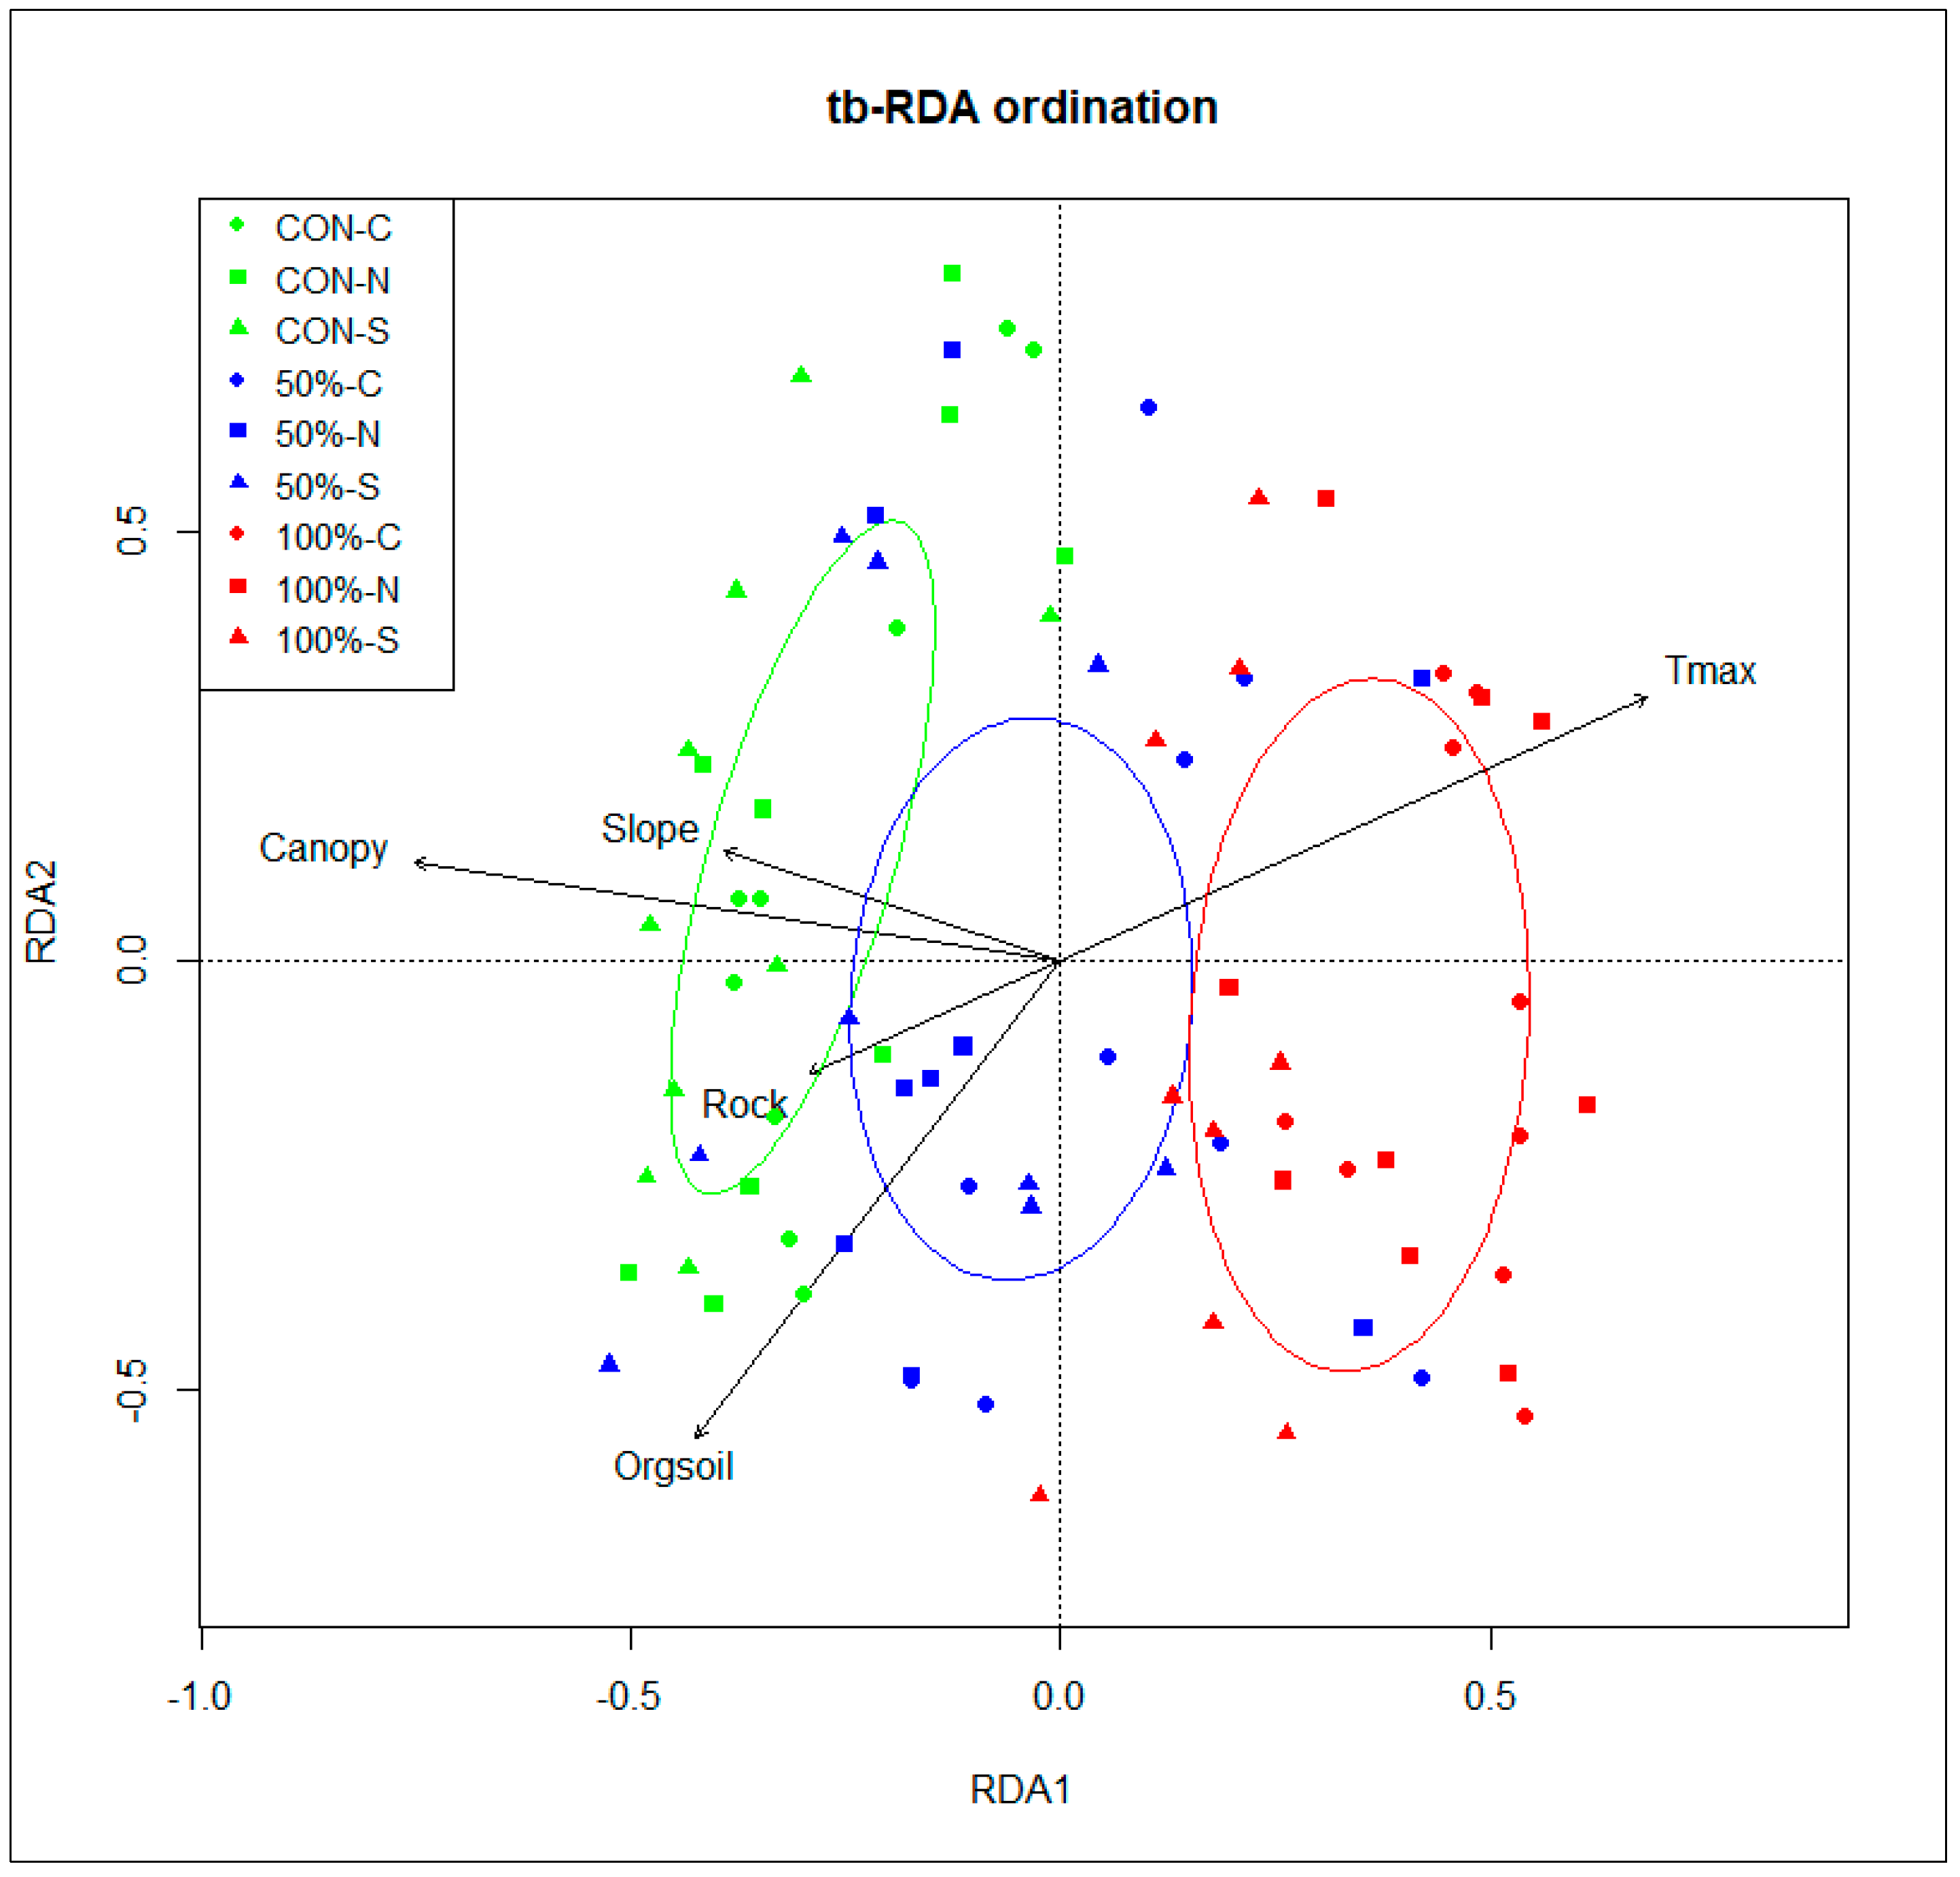
3.2. Linking Environmental Factors and Post-Disturbance Species Composition

The final model of the transformation-based redundancy analysis (tb-RDA) included five measured environmental variables, which had a significant effect on post-disturbance understory composition: canopy cover, maximum daily temperature, thickness of organic soil layer, slope inclination, and surface rockiness (Figure 4). This model explained 20.2% of the variation in species composition. The first RDA axis explained 8.3% and the second axis explained 4.8% of compositional variability in community data. Axis 1 separated plots belonging to different management intensities, whereas, in terms of within-sinkhole position, the distribution of plots was less clear. Nevertheless, one pattern that can be recognized is that within each treatment intensity category, the southern plots tend to be positioned more on the left side of the group centroid (i.e., they have lower axis 1 scores; Figure 4). The southern plots (and southern sides of the sinkholes in general) were generally characterized by steeper, rocky terrain with more shallow soils and a less extreme microclimate (lower temperatures, higher relative humidity) compared with plots in the centre and north. RDA 1 was most strongly correlated with canopy cover (r = −0.93) and Tmax (r = 0.85). The thickness of the organic soil layer was most significantly correlated with RDA 2 (r = −0.69).
Analysis of variance partitioning revealed that environmental predictor with the highest explanatory power was variable related to overstory structure, that is, canopy cover (3.7% explained variation), followed by the microclimatic variable maximum daily temperature (2.6%) and soil parameter thickness of organic soil (1.5%), whereas topographic factors (slope inclination and surface rockiness) together explained 2.9% of the variation in species composition.

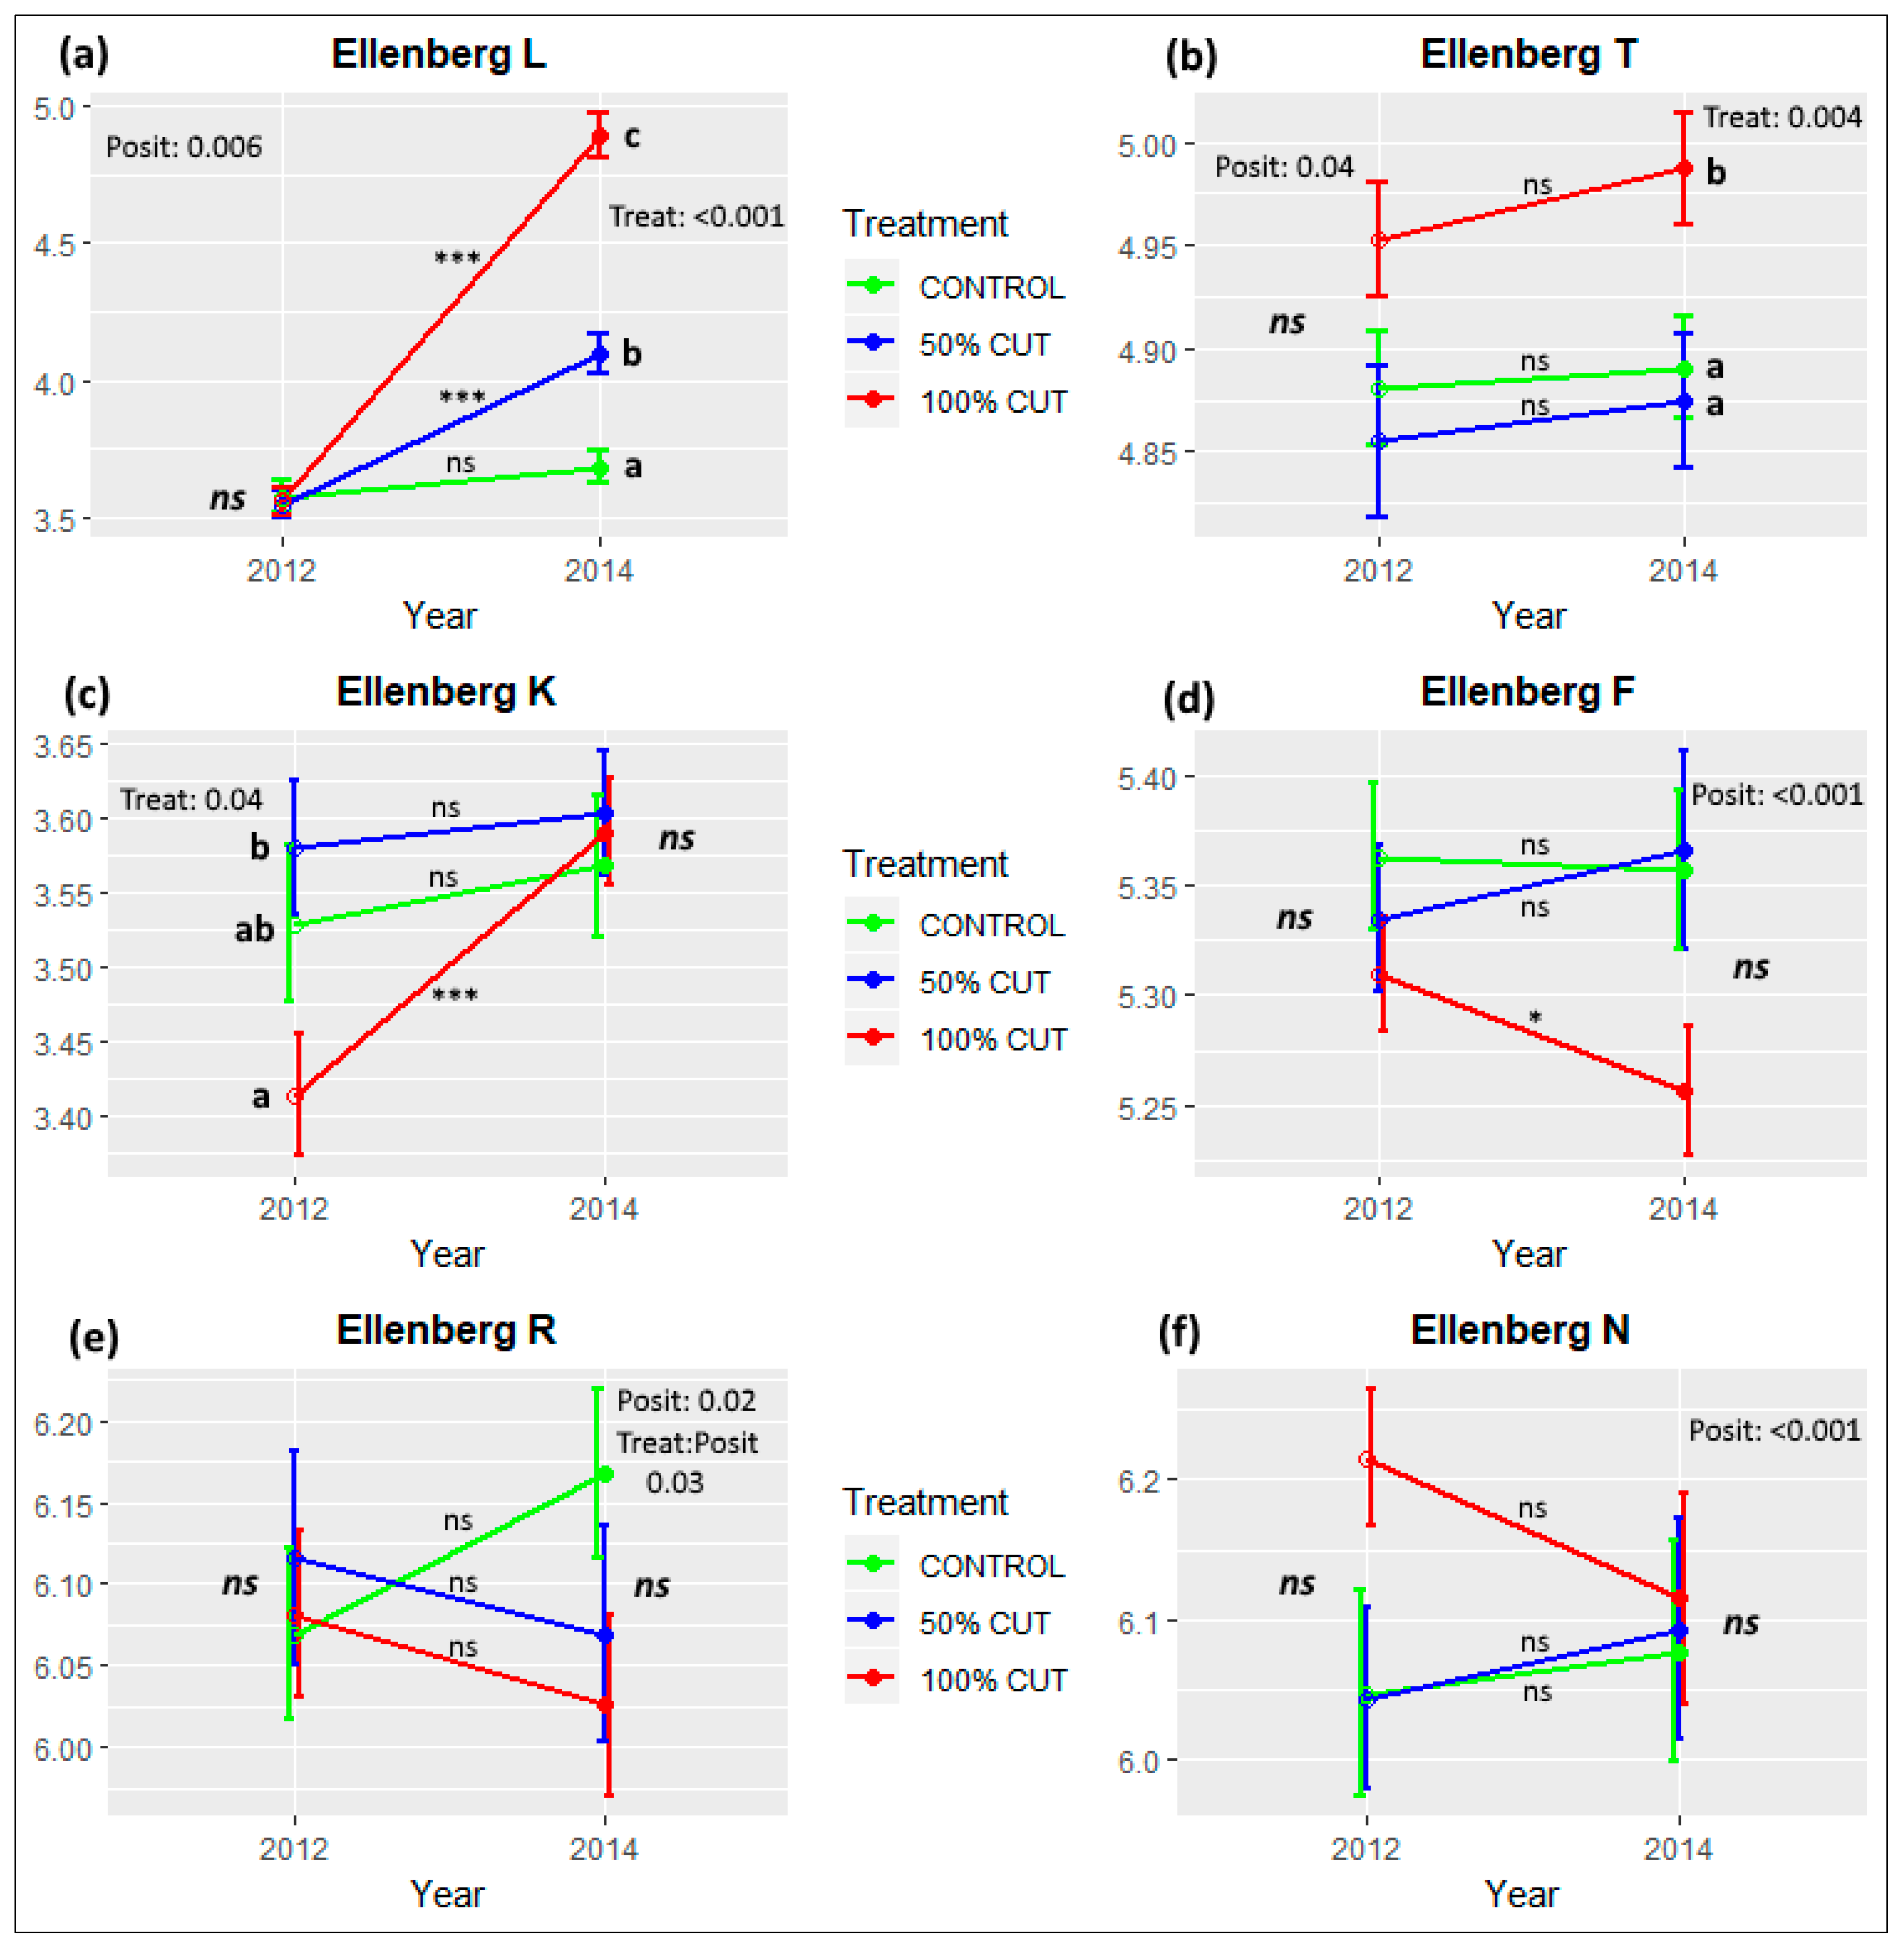
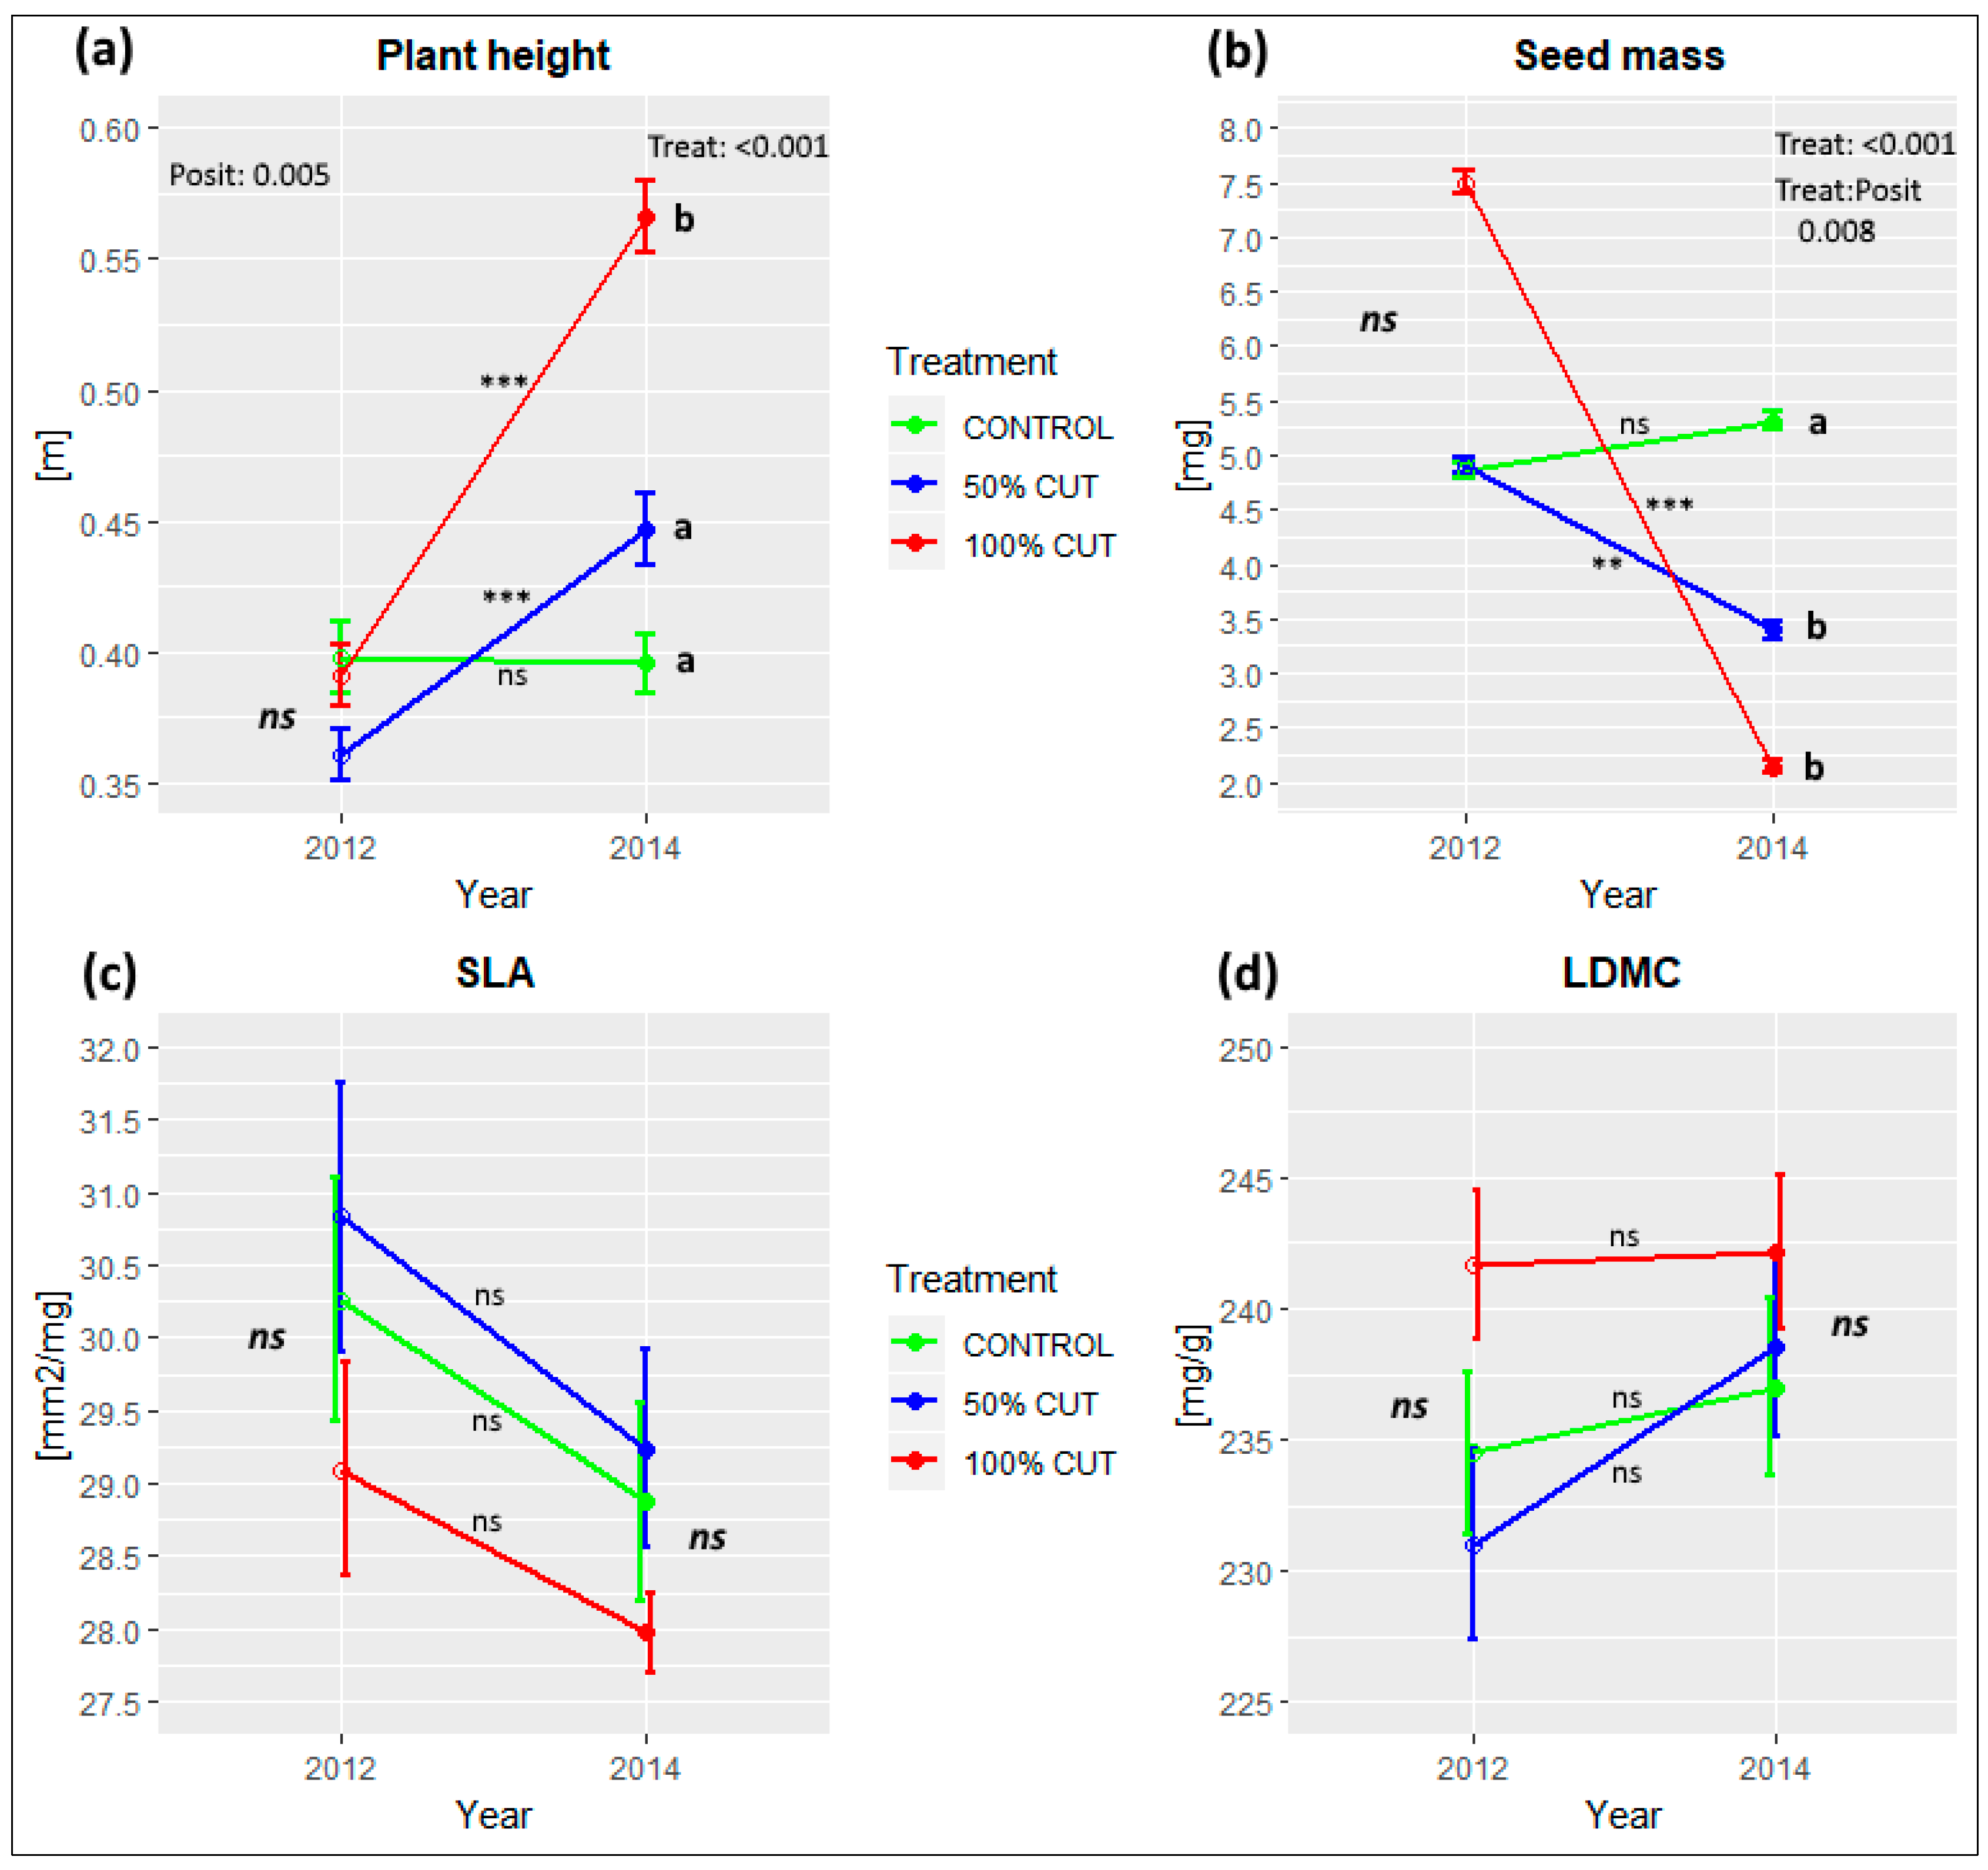
3.3. Effects of Treatment Intensity and Within-Sinkhole Position on EIVs and PFTs

Forest management intensity had a significant effect on plot-level EIVs for light (EIV-L) and temperature (EIV-T), but did not significantly affect other EIVs (Table 1, Figure 5). EIV-L significantly increased in 50% and 100% cutting treatment. Before cutting was implemented, mean EIV-L was ~3.5 and then increased to almost 5 in 100% cutting. In 2012, position had significant effect on EIV-L. EIV-T showed an increasing trend after the cutting, however, no significant changes were detected. Post-treatment plots in 100% cutting differed significantly from the other two treatments. There were some significant differences in EIVs for continentality (EIV-K) among treatments before cutting; however, post-treatment values were very similar. EIV-K significantly increased in 100% cut plots. Changes in EIVs for moisture (EIV-F) were insignificant for control and 50% cutting, but these indicator values significantly decreased in 100% cutting treatment (Figure 5). Regarding the effects of management intensity, no significant effects were detected for EIVs for reaction (EIV-R) and nutrients (EIV-N). Overall, the within-sinkhole position had a significant effect on post-treatment values for EIV-F, EIV-R, and EIV-N (Figure 5).
In the control and 50% cut plots, post-treatment EIV-F values did not differ significantly among positions. In 100% cutting, however, the northern plots had significantly (p = 0.048) lower EIV-F values (mean: 5.18) compared with the southern plots (mean: 5.36). For post-treatment EIV-R values, only 50% cut plots differed: the eastern (mean: 6.28) and northern (mean: 6.24) plots had significantly higher EIV-R than the central plots (mean: 5.74). In the case of post-treatment EIV-N values, 100% cutting intensity showed that the western (mean: 6.43) and southern (mean: 6.38) plots had significantly higher EIV-N than the northern (mean: 5.81) and central (mean: 5.81) plots.
In terms of functional traits, the most significant changes in CWMs were observed for plant height and seed mass (Figure 6). Understory herbaceous plant communities after the cutting were on average taller compared with pre-treatment status; this increase was particularly evident in canopy gaps. Within-sinkhole position had a significant effect on CWM for height in 2012. The 100% cutting treatment differed significantly from the 50% cutting and control. After the cutting, species with lower seed mass were more abundant compared with the pre-disturbance status; therefore, CWM for seed mass significantly decreased in both partially and fully (100%) cut plots. CWMs for this trait were not significantly different between 50% and 100% cutting after the cutting. By contrast, leaf traits did not show significant changes. CWMs for SLA tended to decrease after the cutting, and this decreasing trend was also observed for control plots (Figure 6). However, these changes were not statistically significant (marginally significant for all treatments, p < 0.1). Leaf dry matter content (LDMC) showed an even less significant response. Generally, post-treatment plots tended to have higher CWMs for LDMC compared with the pre-treatment status, but these changes were not significant.

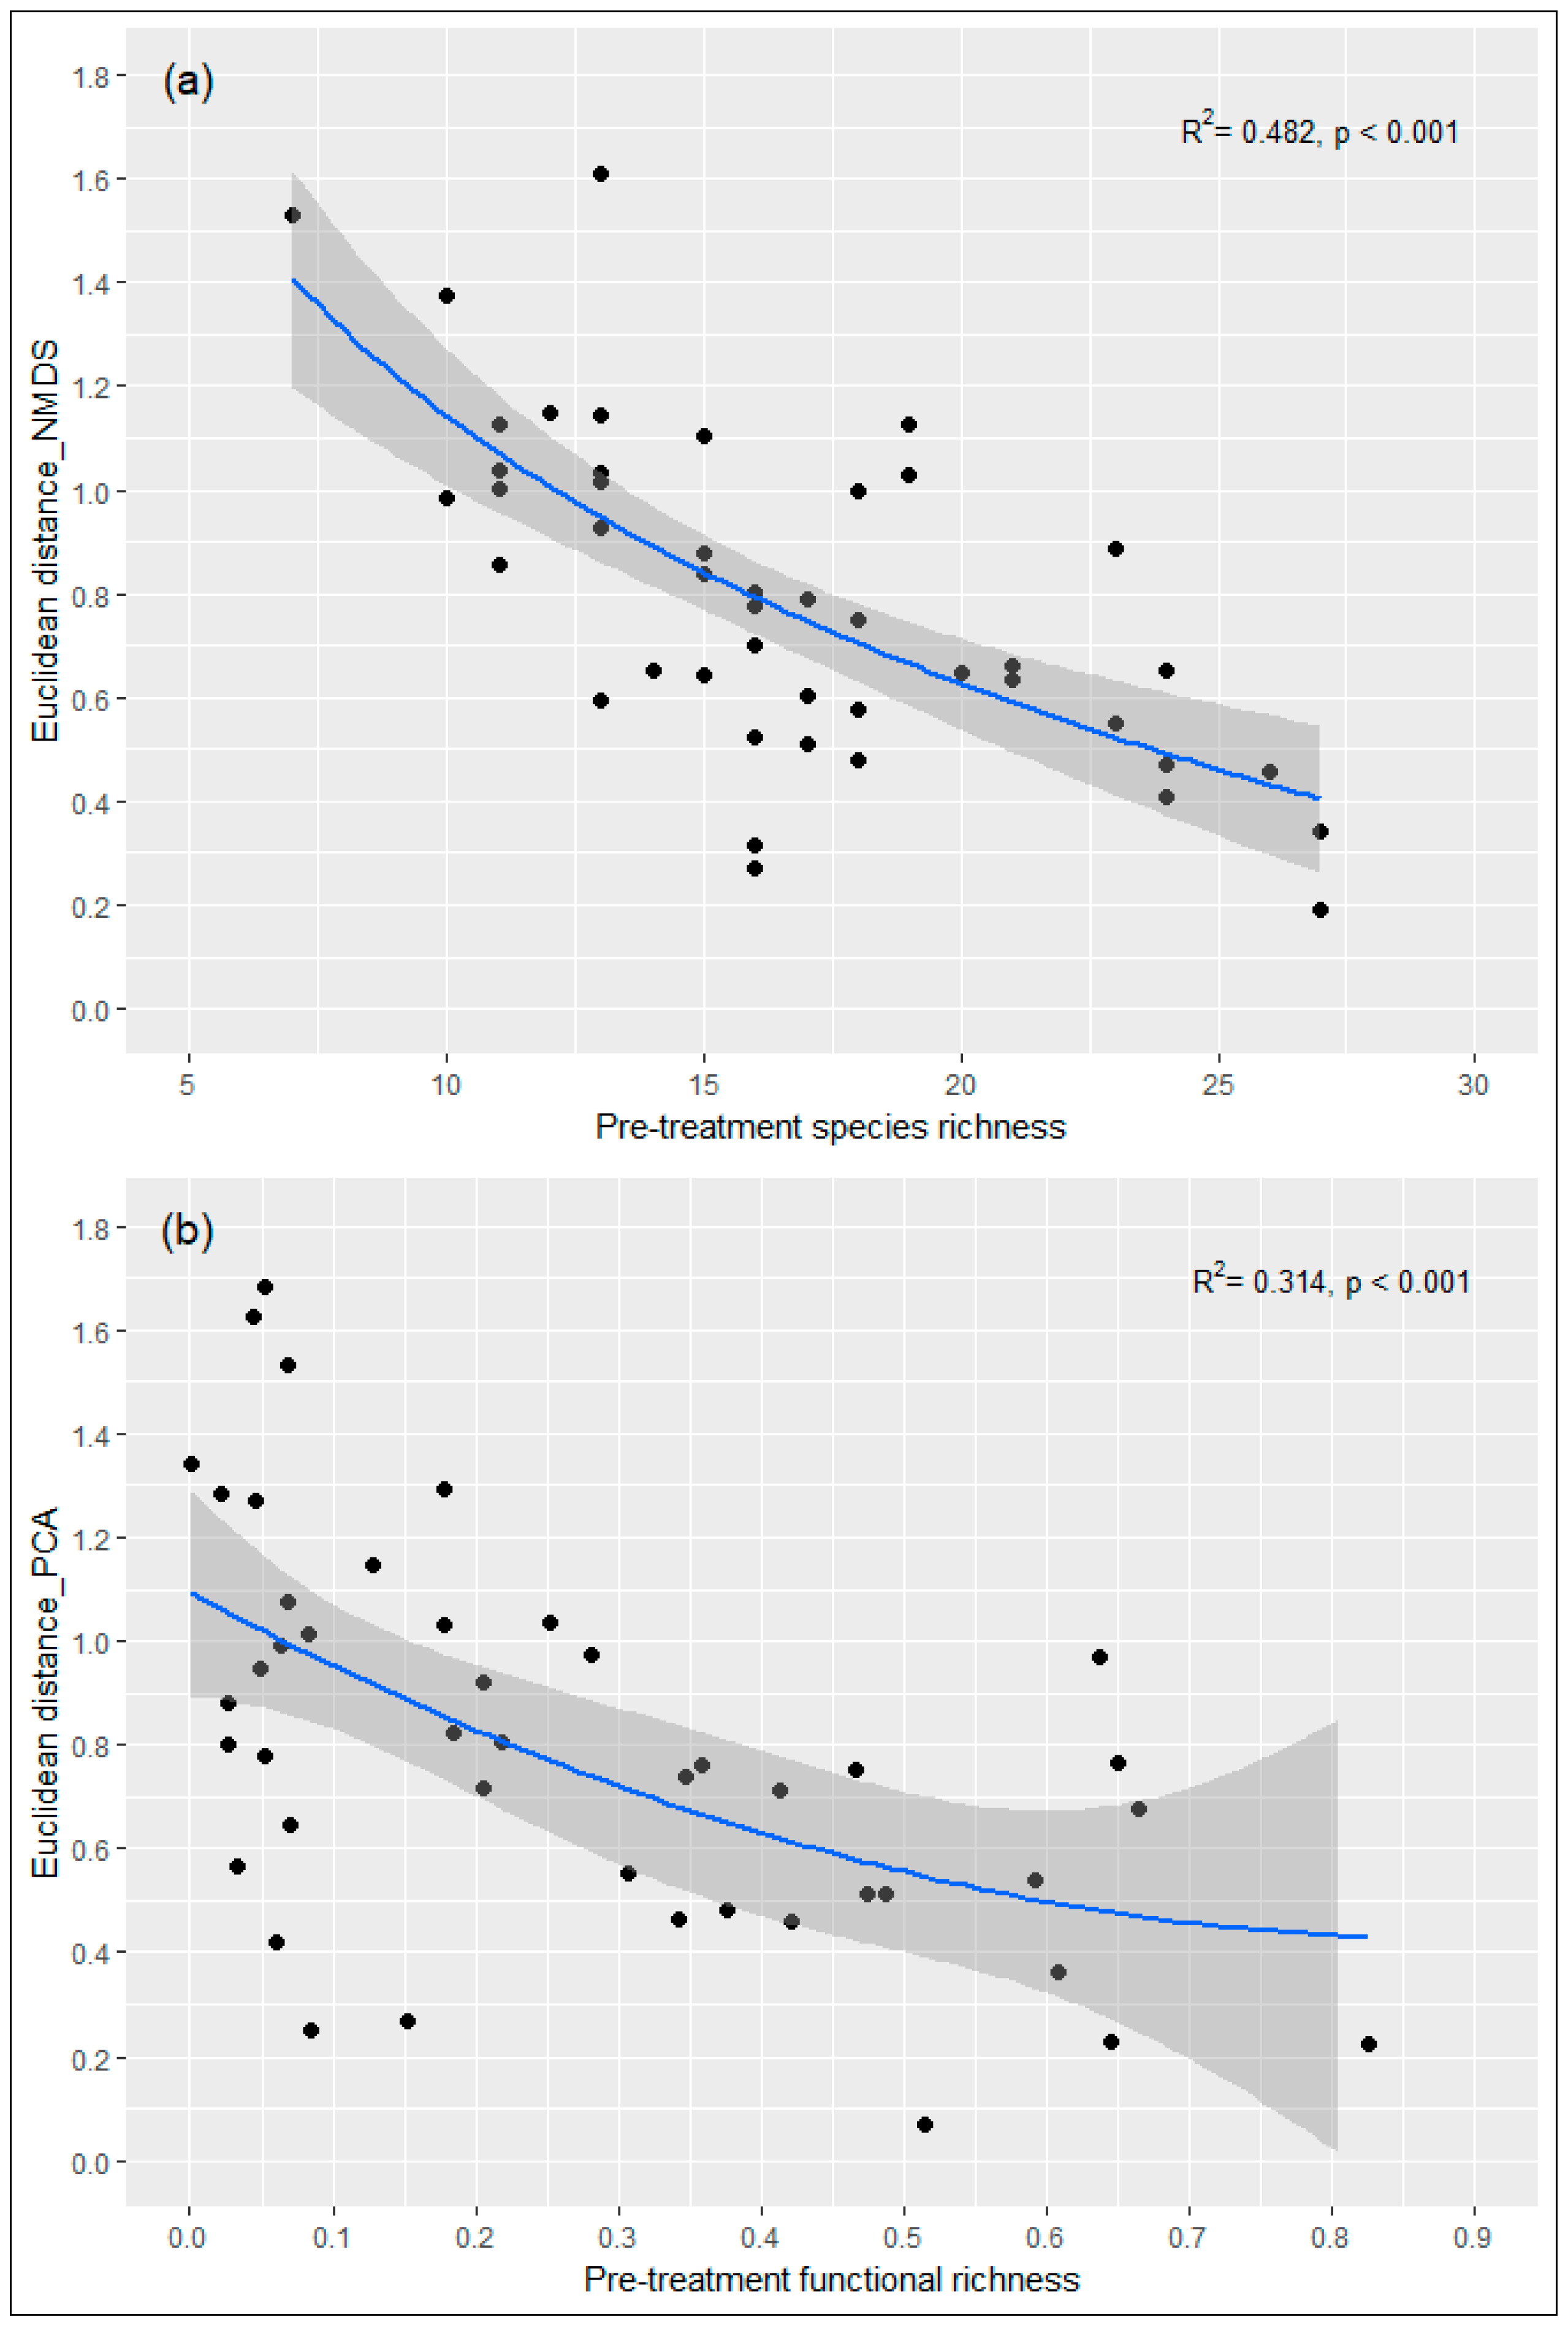
3.4. Influence of Pre-Treatment Richness on Post-Treatment Shifts

The regression analysis revealed that compositional shifts in canopy gaps (measured as Euclidean distance in NMDS ordination space) between pre- and post-cutting communities were negatively related to pre-treatment species richness (R2 = 0.482, p < 0.001; Figure 7a). Plots with higher pre-treatment (year 2012) species richness exhibited smaller compositional changes, and vice-versa. Similarly, shifts in ordination space, using four functional traits as principle components in PCA ordination, were significantly influenced by pre-treatment functional richness (R2 = 0.314, p < 0.001; Figure 7b). Plots with lower pre-treatment functional richness experienced larger changes (with regard to their functional composition) compared with plots with higher pre-treatment functional richness.

4. Discussion

Our results demonstrated the importance of forest management intensity on understory vegetation. In addition to the expected prevalence of tree cutting effects, fine-scale variation in understory diversity, abundance, and composition can be attributed to environmental factors that operate independently of exogenous factors (management disturbance), that is, local topographic conditions defined by aspect and slope. Karst sinkholes are the dominant landform of the diverse terrain in the Dinaric Mountains and largely influence the understory vegetation and its dynamics in space and time. Significant differences in vegetation diversity and composition occur inside and outside the sinkholes, indicating that their presence has important ecological impacts [62].

4.1. Floristic Perspective

Forest management determines ecological differences between managed and unmanaged forests that strongly affect plant species diversity and composition [31]. An increase of ground-layer diversity metrics (species richness, cover) along the cutting intensity gradient has been documented in many studies (e.g., [3,63]), and this is usually the result of newly colonized species joining the community and the initial persistence of resident species [64]. A slight increase in tree species richness in canopy gaps suggest that silvicultural objectives were met; canopy gaps created (micro)sites for the establishment of pioneer tree species that were not present in stands under the closed canopy. The authors of [12] also highlighted that management is the main driver of species diversity in Western Pyrenean silver fir-beech forests.
In our study, microsite conditions, directly influenced by tree cutting (canopy cover and microclimate, as well as soil characteristics), were the most significant determinants of understory species composition, whereas topographic factors proved to be somehow less important. This is in line with the study of [65], who demonstrated that management-related variables explained more variation in the vegetation of Danish beech forests than any of the other variables put together. Nevertheless, factors such as slope aspect may substantially modify the plant community response to forest management, as shown by the work of [25]. The results obtained in our research suggest that topographic factors, namely slope inclination and cover of rocks on the surface, had some influence on species composition. The authors of [12] found that more steep slopes usually have lower soil moisture and nutrient levels, leading to altered species composition and lower species richness.
Within-sinkhole position had rather small effect on patterns of understory vegetation in the studied Dinaric fir-beech forests. This could be attributed to the fact that our within-sinkhole plots were positioned relatively close to each other (the largest distance was ~24 m between oppositely positioned plots, that is, N vs. S and E vs. W). Another explanation might be that we studied a short-term response (two years) when significant differences at fine scales were not detected, but are likely to become more noticeable in later stages of post-disturbance succession. Moreover, the results could also indicate the absence of strong ecological gradients at the studied spatial scale. However, note that pre-treatment species richness showed a relatively broad range (Figure 2a and Figure 7a), and the sinkhole-level dissimilarity index (Figure 2d) was on average above 0.6, indicating that even undisturbed stands in the Dinaric fir-beech forests are relatively variable in spatial patterns of species diversity and composition. For beech forests in Germany, the authors of [23] found that topography may cause microclimate and physical soil properties (texture, profile depth) to vary considerably at the local scale, thus leading to gradients in soil moisture and air humidity inside the closed forests. Furthermore, in our study, differences in species composition between plots within the same sinkhole increased after the cutting (not significantly) (Figure 2d), indicating that plots were more different from each other in terms of species composition owing to the increased spatial heterogeneity of available light, soil moisture, and nutrients. This might support the idea of the work of [15], who mentioned that resource heterogeneity is an important driver of understory diversity and composition in disturbed forests. In temperate latitudes, canopy openings, created by disturbances, usually have a heterogeneous light environment [13].
The total amount of species compositional variation explained by the measured environmental variables was relatively low. The importance of microclimatic (air humidity) and soil conditions (moisture and chemistry) as determinants of the herb layer composition in European beech forests has been shown by the authors of [23]. Other studies (e.g., [66]) showed a strong dependence of beech forest understory on soil properties also at large-scale spatial gradients. Other factors (e.g., soil moisture, soil chemistry), not measured in our sampling plots, may have been responsible for affecting the understory composition. Additionally, relevant biotic factors (e.g., competition, dispersal ability, herbivory) were not addressed in our study, but are important for interpreting more patchy distribution of certain woody and herbaceous species [23]. For example, the occurrence and abundance of woody plant species in forest stands and canopy gaps has been shown to strongly depend on mycorrhiza, which is also directly influenced by management interventions (mainly through soil compaction and soil disturbance). The degree of symbiosis between plants and fungi in the soil is expected to be reduced after tree cutting, particularly in the case of ectomycorrhizal fungi [67].

4.2. Ecological and Trait-Based Perspective

Concerning changes and differences in Ellenberg indicator values (Figure 5), before the cutting, the understory communities were characterized by relatively shade tolerant species with moderate indicator scores for soil moisture (mesic conditions), nutrient availability, and soil pH (mainly base-rich soils on limestone and dolomite bedrock). Changes in EIVs after the cutting treatments were most significant for light; plot-level EIV-L increased in both the 50% and 100% cutting. This is because of the increased richness and cover of early successional light-demanding species in management-created canopy gaps, a general pattern occurring in post-management conditions [68]. Mean EIV-F significantly decreased in canopy gaps (Figure 5d), indicating that some plant species that were more adapted to drier soil conditions colonized the gaps. However, according to the studies of [64] and [69], the amount of available soil moisture in gaps normally increase owing to the lower overstory interception of precipitation and reduced water uptake of remaining vegetation, that is, mature trees—as the most demanding consumers—were cut down. It is also important to note that management had a significant effect on EIV-L and EIV-T, whereas EIVs indicating soil conditions (EIV-F, EIV-R, EIV-N) were more influenced by within-sinkhole position. This might suggest that important soil properties (moisture, nutrients, chemical characteristics) most likely exhibited substantial variability at short distances in our studied forest ecosystems.
With respect to functional traits, CWMs for plant height increased significantly in the disturbed plots, suggesting that taller herbaceous species occupied the newly created canopy gaps, which is in corroboration of the study of [64]. The influx of tall ruderal herbs and grasses in the canopy gaps has been observed before (e.g., [13]). CWMs for seed mass decreased, indicating that plant species with lighter seeds were more abundant in disturbed plots compared with controls. Larger seeds have been associated with more shaded habitats [70]. Opposite to these two traits, leaf traits (SLA and LDMC) did not show significant changes. The observed patterns of a decreasing trend of CWMs for SLA after cutting disturbance (Figure 6c) are most likely a consequence of negative correlation between light levels (EIV-L) and SLA (species-level: Pearson’s r = −0.28, p < 0.001; plot-level: r = −0.35, p < 0.001). This is in agreement with the authors of [70], who pointed out that species with large SLA are often associated with low light conditions, whereas plants growing under high light exposure generally have thicker leaves with a lower SLA [45]. However, ecological theory and some previous studies (e.g., [71]) suggested that, at the community level, SLA is positively correlated to the intensity or frequency of disturbances, that is, fast-growing pioneer species have higher SLA. In our case, given that the decreasing trend of SLA in the second sampling year also appeared in control plots, no firm conclusions can be made. The authors of [46] also noted complex and weak response of SLA to disturbance severity across a temperate flora. We argue that using leaf traits might not be particularly useful or relevant when exploring the short-term understory response to forest management, as their relationship with disturbance seems to be more variable; other traits, for example, those related to species dispersal and regeneration, should be used instead.

4.3. Initial Community Diversity as a Significant Determinant of Post-Disturbance Response

We found a positive relationship between understory compositional (functional) resistance following tree cutting and pre-treatment species and functional richness. This could be a result of fewer species being lost after the disturbance and/or fewer colonizing species following disturbance in species-rich than in species-poor local communities. Our additional analysis (Supplementary Materials) revealed that species-poor communities were more prone to the colonization of new species that joined the community after the disturbance. The species extirpation rate did not differ significantly between species-poor and species-rich communities (Wilcoxon signed-rank test: W = 275.5, p = 0.568). Communities with higher pre-treatment richness tended to lose fewer resident species, but this relationship was not significant. Overall, changes in species composition (quantified by species turnover; see Supplementary Figure S1) were more driven by colonization than by the process of species loss. These results are different from those of the authors of [34], who found that the boreal understory communities with high species richness improved compositional stability following overstory cutting through less species loss than the communities with low species richness, whereas the number of colonizing species was similar in both species-rich and species-poor communities. In the case of our study, species-rich communities were more densely populated with less empty space, that is, had higher total understory cover (Pearson’s correlation coefficient between species richness and total cover: r = 0.63, p < 0.001), thereby preventing potential colonizing species from entering the community after the disturbance. This can have some implications in a broader sense; for example, mixed forest stands with higher tree species richness usually show greater capacity to resist environmental changes and are able to return to pre-disturbance conditions much faster than monospecific stands [72].

4.4. Potential Silvicultural Implications

Forest managers are trying to optimize silvicultural systems that are feasibly resistant to the colonization of non-forest species (with a potential to outcompete tree species), yet still provide a suitable habitat for pioneer and more light-demanding mid-successional species that require moderate to severe disturbances [73]. Some practical silvicultural implications can be derived from our results. Studies dealing with the eco-physiological response of key tree species in Dinaric fir-beech forests (European beech, Silver fir, Norway spruce) have shown their divergent response to increased light levels in canopy openings [74,75]. Beech saplings reacted with accelerated growth, while Silver fir growth was reduced in open habitat conditions without overstory shelter. The more sensitive nature of Silver fir can be also recognized by data from our plots; the cover of fir in the understory was significantly lower in canopy gaps compared with the control and 50% cutting (Kruskal–Wallis test: df = 2, Chi-squared = 15.71, p < 0.001), whereas management intensity did not have a significant effect on the abundance of other tree species (beech, spruce, Sycamore maple). This suggests that Silver fir (a shade-tolerant tree species that primarily regenerates better in shadow, under the slightly thinned canopy cover) may not be able to survive in such harsh environmental conditions. However, owing to specific karst topography (bowl-shaped sinkholes), certain microsites in canopy gaps might be favourable for fir establishment. For instance, the southern (north-facing) plots had less extreme microclimatic conditions compared with the northern and central plots, which were more exposed to direct irradiance. Such differences in environment, induced by slope aspect and other additional factors (e.g., surface rockiness, deadwood), are important to consider when planning tree species artificial regeneration, for example, planting of tree saplings to restore damaged forest areas.
The regeneration of vegetation in canopy gaps also depends on the quantity and quality of advance regeneration, that is, pre-established tree saplings and seedlings. Advance regeneration in undisturbed Dinaric fir-beech stands is highly variable in space and time, mostly reflecting favourable soil conditions. In microsites where dense beech regeneration had been initially present and rapidly took advantage of the overstory removal, the emergence and survival of other (less competitive) tree seedlings and saplings might be compromised.

5. Conclusions

This study confirms that forest management intensity is the main determinant of understory diversity, abundance, and composition in managed forests. Differences between cutting treatments are not only expressed on the taxonomic level, but can be detected in terms of ecological conditions and functional composition. Canopy gaps within the intact forest matrix play a major role in maintaining the species pool for a longer period along the successional gradient, by allowing some early-successional species to persist longer and coexist with late-successional species [10]. Although partial cutting and canopy gaps promoted the establishment of many light-demanding, non-forest plant species, it is always important to ask how typical forest specialists (including tree species) responded to intensive cutting treatments. In our previous study [36], we have shown that these understory species, presumably more sensitive to disturbance, tolerate a wider range of light conditions and are, shortly after cutting, able to persist in canopy gaps.
The results provide evidence that assemblage patterns of understory vascular plants in Dinaric fir-beech forests are driven by variables directly related to management as well as given abiotic factors. At the microsite scale, factors explaining species composition were related to overstory structure (degree of canopy closure), microclimate (maximum daily temperature), soil features (thickness of organic layer), and local topography (slope and surface rockiness).
We observed some immediate changes that could be modified in the long term. Future work will thus be dedicated to the investigation of the recovery of the plant communities in canopy gaps over time and to estimate whether the understory composition converges toward the pre-treatment status. It is expected that 100% cutting intensity will likely have a long-lasting effect on the compositional trajectories of understory vegetation in Dinaric fir-beech forests. Special attention will be given to the tree regeneration dynamics. Additionally, in situ measurements of detailed soil parameters (e.g., moisture, nutrients, litter properties) would be beneficial to further investigate the variability of understory vegetation in relation to (micro)site conditions.
Plots with higher richness exhibited smaller changes compared with species-poor communities, which was mainly owing to lower post-disturbance colonization rate in species-rich understory communities. This suggests that understory microsites with higher species richness and cover are expected to be more resistant and resilient to disturbances. Such information might be useful for the management of studied forests and beyond. Local forest understory communities exhibiting sparse cover and low species diversity should be carefully subjected to canopy openings, as they are likely susceptible to rapid invasion of non-forest species and gap specialists (e.g., aggressive grasses, Rubus species), especially in more exposed microsites, such as steep south-facing slopes.

Supplementary Materials

The following are available online at https://www.mdpi.com/1999-4907/10/10/909/s1. Supplementary Figure S1: Linear regressions between pre-treatment species richness and (a) colonization rate, (b) extirpation rate, and (c) species turnover, separately for species-rich and species-poor understory communities (plots).

Author Contributions

Conceptualization, L.K. and J.K.; Data curation, L.K. and J.K.; Formal analysis, J.K. and L.K.; Investigation, L.K., A.M., and K.E.; Methodology, L.K., A.M., and K.E.; Project administration, L.K.; Supervision, L.K.; Writing—original draft preparation, J.K.; Writing—review and editing, L.K., A.M., and K.E.

Funding

This research was funded by European LIFE ManFor C.BD Project, grant number LIFE09 ENV/IT/000078, and by the Slovenian Research Agency core funding for the Programme Groups, grant numbers P4-0107 and P4-0085. Janez Kermavnar was funded by the Slovenian Research Agency for his Young Researcher Programme (Contract no. 1000-18-0404).

Acknowledgments

We would like to express our gratitude to many experts from the Slovenian Forest Service for their help with the field preparation during this experimental study. We thank our colleagues from the Slovenian Forestry Institute: Mitja Ferlan and Iztok Sinjur for providing microclimate data, Andrej Kobler for his contribution of LiDAR data, and many thanks to Daniel Žlindra who provided results from soil samples analyses. We are grateful to two anonymous referees and editors for their valuable comments.

Conflicts of Interest

The authors declare no conflict of interest. The funders had no role in the design of the study; in the collection, analyses, or interpretation of data; in the writing of the manuscript; or in the decision to publish the results.

References

  1. Lindenmayer, D.B.; Margules, C.R.; Botkin, D.B. Indicators of Biodiversity for Ecologically Sustainable Forest Management. Conserv. Biol. 2000, 14, 941–950. [Google Scholar] [CrossRef]
  2. Brunet, J.; Fritz, Ö.; Richnau, G. Biodiversity in European beech forests—A review with recommendations for sustainable forest management. Ecol. Bull. 2010, 53, 77–94. [Google Scholar]
  3. Lombardi, F.; Di Lella, S.; Altieri, V.; Di Benedetto, S.; Giancola, C.; Lasserre, B.; Kutnar, L.; Tognetti, R.; Marchetti, M. Early responses of biodiversity indicators to various thinning treatments in mountain beech forests. iForest 2018, 11, 609–618. [Google Scholar] [CrossRef]
  4. Seidl, R.; Thom, D.; Kautz, M.; Martin-Benito, D.; Peltoniemi, M.; Vacchiano, G.; Wild, J.; Ascoli, D.; Petr, M.; Honkaniemi, J.; et al. Forest disturbances under climate change. Nat. Clim. Chang. 2017, 7, 395–402. [Google Scholar] [CrossRef] [Green Version]
  5. Boch, S.; Prati, D.; Müller, J.; Socher, S.; Baumbach, H.; Buscot, F.; Gockel, S.; Hemp, A.; Hessenmöller, D.; Kalko, E.K.V.; et al. High plant species richness indicates management-related disturbances rather than the conservation status of forests. Basic Appl. Ecol. 2013, 14, 496–505. [Google Scholar] [CrossRef]
  6. Fedrowitz, K.; Koricheva, J.; Baker, S.C.; Lindenmayer, D.B.; Palik, B.; Rosenvald, R.; Beese, W.; Franklin, J.F.; Kouki, J.; Macdonald, E.; et al. Can retention forestry help conserve biodiversity? A meta-analysis. J. Appl. Ecol. 2014, 51, 1669–1679. [Google Scholar] [CrossRef]
  7. Dieler, J.; Uhl, E.; Biber, P.; Müller, J.; Rötzer, T.; Pretzsch, H. Effect of forest stand management on species composition, structural diversity, and productivity in the temperate zone of Europe. Eur. J. Forest Res. 2017, 136, 739–766. [Google Scholar] [CrossRef]
  8. Schmidt, W. Herb layer species as indicators of biodiversity of managed and unmanaged beech forests. For. Snow Landsc. Res. 2005, 79, 111–125. [Google Scholar]
  9. Paillet, Y.; Bergés, L.; Hjältén, J.; Ódor, P.; Avon, C.; Bernhardt-Römermann, M.; Bijlsma, R.-J.; De Bruyn, L.; Fuhr, M.; Grandin, U.; et al. Biodiversity Differences between Managed and Unmanaged Forests: Meta-Analysis of Species Richness in Europe. Conserv. Biol. 2010, 24, 101–112. [Google Scholar] [CrossRef]
  10. De Grandpré, L.; Boucher, D.; Bergeron, Y.; Gagnon, D. Effects of small canopy gaps on boreal mixedwood understory vegetation dynamics. Community Ecol. 2011, 12, 67–77. [Google Scholar] [CrossRef]
  11. Sabatini, F.M.; Burton, J.I.; Scheller, R.M.; Amatangelo, K.L.; Mladenoff, D.J. Functional diversity of ground-layer plant communities in old-growth and managed northern hardwood forests. Appl. Veg. Sci. 2014, 17, 398–407. [Google Scholar] [CrossRef]
  12. Horvat, V.; Biurrun, I.; García-Mijangos, I. Herb layer in silver fir-beech forests in the western Pyrenees: Does management affect species diversity? For. Ecol. Manag. 2017, 385, 87–96. [Google Scholar] [CrossRef]
  13. Aikens, M.; Ellum, D.; McKenna, J.J.; Kelty, M.J.; Ashton, M.S. The effects of disturbance intensity on temporal and spatial patterns of herb colonization in a southern New England mixed-oak forest. For. Ecol. Manag. 2007, 252, 144–158. [Google Scholar] [CrossRef]
  14. Burton, J.I.; Mladenoff, D.J.; Clayton, M.K.; Forrester, J.A. The roles of environmental filtering and colonization in the fine-scale spatial patterning of ground-layer plant communities in the north temperate deciduous forests. J. Ecol. 2011, 99, 764–776. [Google Scholar] [CrossRef]
  15. Bartels, S.F.; Chen, H.Y.H. Is understory plant species diversity driven by resource quantity or resource heterogeneity. Ecology 2010, 91, 1931–1938. [Google Scholar] [CrossRef]
  16. Royo, A.A.; Carson, W.P. On the formation of dense understory layers in forests worldwide: Consequences and implications for forest dynamics, biodiversity, and succession. Can. J. For. Res. 2006, 36, 1345–1362. [Google Scholar] [CrossRef]
  17. Kern, C.C.; Burton, J.I.; Raymond, P.; D’Amato, A.W.; Keeton, W.S.; Royo, A.A.; Walters, M.B.; Webster, C.R.; Willis, J.L. Challenges facing gap-based silviculture and possible solutions for mesic northern forests in North America. Forestry 2016, 90, 4–17. [Google Scholar] [CrossRef]
  18. Brosofske, K.D.; Chen, J.; Crow, T.R. Understory vegetation and site factors: Implications for a managed Wisconsin landscape. For. Ecol. Manag. 2001, 146, 75–87. [Google Scholar] [CrossRef]
  19. Durak, T. Changes in diversity of the mountain beech forest herb layer as a function of the forest management method. For. Ecol. Manag. 2012, 276, 154–164. [Google Scholar] [CrossRef]
  20. Márialigeti, S.; Tinya, F.; Bidló, A.; Ódor, P. Environmental drivers of the composition and diversity of the herb layer in mixed temperate forests in Hungary. Plant Ecol. 2016, 217, 549–563. [Google Scholar] [CrossRef] [Green Version]
  21. Ujházy, K.; Hederová, L.; Máliš, F.; Ujházyova, M.; Bosela, M.; Čiliak, M. Overstorey dynamics controls plant diversity in age-class temperate forests. For. Ecol. Manag. 2017, 391, 96–105. [Google Scholar] [CrossRef]
  22. Beatty, S.W. Influence of microtopography and canopy species on spatial patterns of forest understory plants. Ecology 1984, 65, 1406–1419. [Google Scholar] [CrossRef]
  23. Leuschner, C.; Lendzion, J. Air humidity, soil moisture and soil chemistry as determinants of the herb layer composition in European beech forests. J. Veg. Sci. 2009, 20, 288–298. [Google Scholar] [CrossRef]
  24. Duguid, M.C.; Ashton, M.S. A meta-analysis of the effect of forest management for timber on understory plant species diversity in temperate forests. For. Ecol. Manag. 2013, 303, 81–90. [Google Scholar] [CrossRef]
  25. Åström, M.; Dynesius, M.; Hylander, K.; Nilsson, C. Slope aspect modifies community responses to clear-cutting in boreal forests. Ecology 2007, 88, 749–758. [Google Scholar] [CrossRef]
  26. Diaci, J.; Adamic, T.; Rozman, A. Gap recruitment and partitioning in an old-growth beech forest of the Dinaric Mountains: Influences of light regime, herb competition and browsing. For. Ecol. Manag. 2012, 285, 20–28. [Google Scholar] [CrossRef]
  27. Vilhar, U.; Roženbergar, D.; Simončič, P.; Diaci, J. Variation in irradiance, soil features and regeneration patterns in experimental forest canopy gaps. Ann. For. Sci. 2015, 72, 253–266. [Google Scholar] [CrossRef]
  28. Diekmann, M. Species indicator values as an important tool in applied plant ecology—A review. Basic Appl. Ecol. 2003, 4, 493–506. [Google Scholar] [CrossRef]
  29. Dwyer, J.M.; Hobbs, R.J.; Mayfield, M.M. Specific leaf area responses to environmental gradients through space and time. Ecology 2014, 95, 399–410. [Google Scholar] [CrossRef]
  30. Amatangelo, K.L.; Johnson, S.E.; Rogers, D.A.; Waller, D.M. Trait-environment relationship remain strong despite 50 years of trait compositional change in temperate forests. Ecology 2014, 95, 1780–1791. [Google Scholar] [CrossRef]
  31. Burrascano, S.; Rosati, L.; Blasi, C. Plant species diversity in Mediterranean old-growth forests: A case study from central Italy. Plant Biosyst. 2009, 143, 190–200. [Google Scholar] [CrossRef]
  32. Bunn, W.A.; Jenkins, M.A.; Brown, C.B.; Sanders, N.J. Change within and among forest communities: The influence of historic disturbance, environmental gradients, and community attributes. Ecography 2010, 33, 425–434. [Google Scholar] [CrossRef]
  33. Belote, R.T.; Jones, R.H.; Wieboldt, T.F. Compositional stability and diversity of vascular plant communities following logging disturbance in Appalachian forests. Ecol. Appl. 2012, 22, 502–516. [Google Scholar] [CrossRef] [PubMed] [Green Version]
  34. MacDonald, R.L.; Chen, H.Y.H.; Bartels, S.F.; Palik, B.J.; Prepas, E.E. Compositional stability of boreal understorey vegetation after overstorey harvesting across a riparian ecotone. J. Veg. Sci. 2015, 26, 733–741. [Google Scholar] [CrossRef]
  35. Kutnar, L.; Eler, K.; Marinšek, A. Effects of different silvicultural measures on plant diversity—The case of the Illyrian Fagus sylvatica habitat type (Natura 2000). iForest 2015, 9, 318–324. [Google Scholar] [CrossRef]
  36. Kermavnar, J.; Eler, K.; Marinšek, A.; Kutnar, L. Initial understory vegetation responses following different forest management intensities in Illyrian beech forests. Appl. Veg. Sci. 2019, 22, 48–60. [Google Scholar] [CrossRef]
  37. Eler, K.; Kermavnar, J.; Marinšek, A.; Kutnar, L. Short-term changes in plant functional traits and understory functional diversity after logging of different intensities: A temperate fir-beech forest experiment. Ann. For. Res. 2018, 61, 223–241. [Google Scholar] [CrossRef]
  38. Londo, G. The decimal scale for relevés of permanent quadrats. Vegetatio 1976, 33, 61–64. [Google Scholar] [CrossRef]
  39. Oksanen, J.; Blanchet, F.G.; Friendly, M.; Kindt, R.; Legendre, P.; McGlinn, D.; Minchin, P.R.; O’Hara, R.B.; Simpson, G.L.; Solymos, P.; et al. Package ‘vegan’—Community Ecology Package. 2019. Available online: https://cran.r-project.org/web/packages/vegan/vegan.pdf (accessed on 5 May 2019).
  40. Bray, J.R.; Curtis, J.T. An ordination of the upland forest communities of southern Wisconsin. Ecol. Monogr. 1957, 27, 325–349. [Google Scholar] [CrossRef]
  41. Ellenberg, H.; Weber, H.E.; Düll, R.; Wirth, V.; Werner, W.; Paulißen, D. Zeigerwerte von Pflanzen in Mitteleuropa. 2. verbesserte und erweiterte Auflage. Scripta Geobotanica 1992, 18, 1–258. [Google Scholar]
  42. Pignatti, S.; Menegoni, P.; Pietrosanti, S. Valori di bioindicazione delle piante vascolari della Flora d’Italia. Bioindicator values of vascular plants of the Flora of Italy. Braun-Blanquetia 2005, 39, 3–95. [Google Scholar]
  43. Westoby, M. A leaf-height-seed (LHS) plant ecology strategy scheme. Plant Soil 1998, 199, 213–227. [Google Scholar] [CrossRef]
  44. Thomson, F.J.; Moles, A.T.; Auld, T.D.; Kingsford, R.T. Seed dispersal distance is more strongly correlated with plant height than with seed mass. J. Ecol. 2011, 99, 1299–1307. [Google Scholar] [CrossRef]
  45. Cornelissen, J.H.C.; Lavorel, S.; Garnier, E.; Diaz, S.; Buchmann, N.; Gurvich, D.E.; Reich, P.B.; ter Steege, H.; Morgan, H.D.; van der Heijden, M.G.A.; et al. A handbook of protocols for standardised and easy measurement of plant functional traits worldwide. Aust. J. Bot. 2003, 51, 335–380. [Google Scholar] [CrossRef] [Green Version]
  46. Herben, T.; Klimešová, J.; Chytrý, M. Effects of disturbance frequency and severity on plant traits: An assessment across a temperate flora. Funct. Ecol. 2018, 32, 799–808. [Google Scholar] [CrossRef]
  47. Kleyer, M.; Bekker, R.M.; Knevel, I.C.; Bakker, J.P.; Thompson, K.; Sonnenschein, M.; Poschlod, P.; van Groenendael, J.M.; Klimeš, L.; Klimešová, J.; et al. The LEDA traitbase: A database of life-history traits of the Northwest European flora. J. Ecol. 2008, 96, 1266–1274. [Google Scholar] [CrossRef]
  48. Lavorel, S.; Grigulis, K.; McIntyre, S.; Williams, N.S.G.; Garden, D.; Dorrough, J.; Berman, S.; Quétier, F.; Thébault, A.; Bonis, A. Assessing functional diversity in the field—Methodology matters! Funct. Ecol. 2008, 22, 134–147. [Google Scholar] [CrossRef]
  49. Laliberté, E.; Legendre, P. A distance-based framework for measuring functional diversity from multiple traits. Ecology 2010, 91, 299–305. [Google Scholar] [CrossRef]
  50. Villéger, S.; Mason, N.W.H.; Mouillot, D. New multidimensional functional diversity indices for a multifaceted framework in functional ecology. Ecology 2008, 89, 2290–2301. [Google Scholar] [CrossRef]
  51. Borcard, D.; Gillet, F.; Legendre, P. Numerical Ecology with R; Springer: New York, NY, USA, 2011; pp. 145–151. [Google Scholar]
  52. Andreson, M.J. A new method for non-parametric multivariate analysis of variance. Austral. Ecol. 2001, 26, 32–46. [Google Scholar]
  53. Anderson, M.J.; Ellingsen, K.E.; McArdle, B.H. Multivariate dispersion as a measure of beta diversity. Ecol. Lett. 2006, 9, 683–693. [Google Scholar] [CrossRef] [PubMed]
  54. Roberts, D.W. Package ‘labdsv’—Ordination and Multivariate Analysis for Ecology. 2019. Available online: https://cran.r-project.org/web/packages/labdsv/labdsv.pdf (accessed on 21 June 2019).
  55. Šmilauer, P.; Lepš, J. Multivariate Analysis of Ecological Data Using Canoco 5; Cambridge University Press: Cambridge, UK, 2014; p. 373. [Google Scholar]
  56. Ter Braak, C.J.F. The analysis of vegetation-environment relationships by Canonical Correspondence Analysis. Vegetatio 1987, 69, 67–77. [Google Scholar] [CrossRef]
  57. Legendre, P.; Gallagher, E.D. Ecologically meaningful transformations for ordination of species data. Oecologia 2001, 129, 271–280. [Google Scholar] [CrossRef] [PubMed]
  58. Oksanen, J. Constrained Ordination: Tutorial with R and vegan. 2012. Available online: http://cc.oulu.fi/~jarioksa/opetus/metodi/sessio2.pdf (accessed on 6 August 2019).
  59. Zuur, A.F.; Ieno, E.N.; Walker, N.J.; Saveliev, A.A.; Smith, G.M. Mixed Effect Models and Extensions in Ecology with R; Springer: New York, NY, USA, 2009; 574p. [Google Scholar]
  60. Bartoń, K. “MuMIn”: Multi-Model Inference, R Package Version 1.43.6. 2019. Available online: https://cran.r-project.org/web/packages/MuMIn/MuMIn.pdf (accessed on 17 July 2019).
  61. R Core Team. R: A Language and Environment for Statistical Computing; R Foundation for Statistical Computing: Vienna, Austria, 2018; Available online: https://www.R-project.org/ (accessed on 21 April 2019).
  62. Kobal, M.; Bertoncelj, I.; Pirotti, F.; Dakskobler, I.; Kutnar, L. Using Lidar Data to Analyse Sinkhole Characteristics Relevant for Understory Vegetation under Forest Cover-Case Study of a High Karst Area in the Dinaric Mountains. PLoS ONE 2015, 10, e0122070. [Google Scholar] [CrossRef] [PubMed]
  63. Von Oheimb, G.; Härdtle, W. Selection harvest in temperate deciduous forests: Impact on herb layer richness and composition. Biodivers. Conserv. 2009, 18, 271–287. [Google Scholar] [CrossRef]
  64. Tinya, F.; Kovács, B.; Prättälä, A.; Farkas, P.; Aszalós, R.; Ódor, P. Initial understory response to experimental silvicultural treatments in a temperate oak-dominated forest. Eur. J. For. Res. 2019, 138, 65–77. [Google Scholar] [CrossRef]
  65. Aude, E.; Lawesson, J.E. Vegetation in Danish beech forests: The importance of soil, microclimate and management factors, evaluated by variation partitioning. Plant Ecol. 1998, 134, 53–65. [Google Scholar] [CrossRef]
  66. Weigel, R.; Gilles, J.; Klisz, M.; Manthey, M.; Kreyling, J. Forest understory vegetation is more related to soil than to climate towards the cold distribution margin of European beech. J. Veg. Sci. 2019, 30, 746–755. [Google Scholar] [CrossRef]
  67. De Groot, M.; Eler, K.; Flajšman, K.; Grebenc, T.; Marinšek, A.; Kutnar, L. Differential short-term response of functional groups to a change in forest management in a temperate forest. For. Ecol. Manag. 2016, 376, 256–264. [Google Scholar] [CrossRef]
  68. Michalová, Z.; Morrissey, R.C.; Wohlgemuth, T.; Bače, R.; Fleischer, P.; Svoboda, M. Salvage-Logging after Windstorm Leads to Structural and Functional Homogenization of Understory Layer and Delayed Spruce Tree Recovery in Tatra Mts., Slovakia. Forests 2017, 8, 88. [Google Scholar] [CrossRef]
  69. Gálhidy, L.; Mihók, B.; Hagyó, A.; Rajkai, K.; Standovár, T. Effects of gap size and associated changes in light and soil moisture on the understorey vegetation of a Hungarian beech forest. Plant Ecol. 2006, 183, 133–145. [Google Scholar] [CrossRef]
  70. Shipley, B.; Belluau, M.; Kühn, I.; Soudzilovskaia, N.A.; Bahn, M.; Penuelas, J.; Kattge, J.; Sack, L.; Cavender-Bares, J.; Ozinga, W.A.; et al. Predicting habitat affinities of plant species using commonly measured functional traits. J. Veg. Sci. 2017, 28, 1082–1095. [Google Scholar] [CrossRef]
  71. Reich, P.B.; Wright, I.J.; Cavender-Bares, J.; Craine, J.M.; Oleksyn, J.; Westoby, M.; Walters, M.B. The evolution of plant functional variation: Traits, spectra, and strategies. Int. J. Plant Sci. 2003, 164, 143–164. [Google Scholar] [CrossRef]
  72. Ampoorter, E.; Selvi, F.; Auge, H.; Baeten, L.; Berger, S.; Carrari, E.; Coppi, A.; Fotelli, M.; Radoglou, K.; Setiawan, N.N.; et al. Driving mechanisms of overstorey-understorey diversity relationships in European forests. Perspect. Plant Ecol. 2016, 19, 21–29. [Google Scholar]
  73. Haeussler, S.; Bedford, L.; Leduc, A.; Bergeron, Y.; Kranabetter, J.M. Silvicultural disturbance severity and plant communities of the southern Canadian boreal forest. Silva Fennica 2002, 36, 307–327. [Google Scholar] [CrossRef]
  74. Čater, M.; Diaci, J. Divergent response of European beech, silver fir and Norway spruce advance regeneration to increased light levels following natural disturbance. For. Ecol. Manag. 2017, 399, 206–212. [Google Scholar] [CrossRef]
  75. Čater, M.; Diaci, J.; Roženbergar, D. Gap size and position influence variable response of Fagus sylvatica L. and Abies alba Mill. For. Ecol. Manag. 2014, 325, 128–135. [Google Scholar] [CrossRef]
Figure 1. (a) Simplified illustration of a karst sinkhole with five sampling plots (C—centre, N—north, E—east, S—south, W—west). (b) Vertical profile (the green line represents the terrain’s surface) from north to south for one of our study sinkholes. Data were derived from LiDAR.
Forests 10 00909 g001
Figure 2. Changes in four diversity metrics: (a) species richness, (b) Shannon index, (c) total cover of shrub and herb layer, and (d) Bray–Curtis dissimilarity index. Pre-treatment (red) and post-treatment (green) boxplots are shown separately for each management intensity (control, 50% cut, 100% cut). Results from linear mixed-effect models are reported. Posit—effect of within-sinkhole position, ns—not significant. * p < 0.05, ** p < 0.01, *** p < 0.001.
Forests 10 00909 g002
Figure 3. Non-metric multidimensional scaling (NMDS) ordination diagrams of the pre-treatment understory communities (panels (a,c,e)) and post-treatment understory communities (panels (b,d,f)), separately for each study location: Trnovo (a,b), Snežnik (c,d), and Kočevski Rog (e,f). Convex hulls enclose different management intensities (control, 50% cut, 100% cut). Significant results from PERMANOVA and PERMDISP analysis are reported (treat = treatment, posit = within-sinkhole position).
Forests 10 00909 g003
Figure 4. Transformation-based redundancy analysis (tb-RDA) of 81 post-treatment plots. Significant environmental variables of the final RDA model are shown with arrows (Canopy—canopy cover, Tmax—maximum daily temperature, Orgsoil—thickness of organic soil layer, Slope—slope inclination, Rock—percentage cover of rocks on the surface); the length of the arrow indicates the size effect. Symbols in green are for control plots (CON), blue for 50% cut, and red for 100% cut. The shape of the symbol denotes the within-sinkhole position (circle—centre, square—north, triangle—south). Confidence (95%) ellipses for the mean (i.e., group centroid of the management intensity category) are plotted.
Forests 10 00909 g004
Figure 5. Plot-level Ellenberg indicator values (EIVs) for different cutting treatments (control, 50% cut, 100% cut) in 2012 (before cutting) and in 2014 (after cutting). (a) L = light, (b) T = temperature, (c) K = continentality, (d) F = moisture, (e) R = reaction, and (f) N = nutrients. Error bars represent standard error. Inside each of the six panels, the significant effects of fixed factors (Treat = treatment, Posit = within-sinkhole position) are reported (i.e., p values from mixed-effect models): on the left side for the year 2012 and on the right side for the year 2014. Letters in bold denote significant differences between pre- and post-treatment intensities and “ns” stands for non-significant differences between treatments. Changes from pre- to post-disturbance values are indicated by “ns” or asterisks (* p < 0.05, ** p < 0.01, *** p < 0.001) in the middle of each panel, close to the line that connects the two error bars.
Forests 10 00909 g005
Figure 6. Community-weighted means (CWMs) for four functional traits: (a) plant height, (b) seed mass, (c) specific leaf area (SLA), and (d) leaf dry matter content (LDMC). Error bars (mean ± SE) are shown for different cutting treatments (control, 50% cut, 100% cut) in 2012 (before cutting) and in 2014 (after cutting). Inside each panel, the significant effects of fixed factors are reported (p-values from mixed-effect models): on the left side for the year 2012 and on the right side for the year 2014. Letters in bold denote significant differences between treatment intensities and “ns” stands for non-significant differences between treatments. Changes from pre- to post-disturbance values are indicated by “ns” (non-significant) or asterisks (* p < 0.05, ** p < 0.01, *** p < 0.001) in the middle of each panel, close to the lines connecting error bars.
Forests 10 00909 g006
Figure 7. Relationship between (a) pre-treatment species richness and changes in species composition from pre- to post-disturbance communities; (b) pre-treatment functional richness and shifts in functional composition, based on four traits (height, seed mass, SLA, LDMC). Changes in floristic and functional composition were quantified by vector length in NMDS (a) and principal component analysis (PCA) (b) ordination space, respectively. For this analysis, data from 45 plots in canopy gaps (100% cut) were used, as they showed the most prominent changes after the cutting. Significant logarithmic (a) and second-order polynomial (b) regression lines (in blue) with corresponding 95% confidence envelopes are given.
Forests 10 00909 g007
Table 1. Results from linear mixed-effect models for diversity metrics, plot-level Ellenberg indicator values (EIVs), and community-weighted trait means (CWMs) of plant functional traits. “-” indicates that factor or interaction term was not included in the final model. Interaction between position and year is not shown as it was not significant in any of the models. SLA—specific leaf area, LDMC—leaf dry matter content.
Dependent VariableModelTreatmentPositionYearTreat: PositTreat: Year
Chi2pR2LRFpFpFpFpFp
Species diversity metrics
Species richness184.96***0.565.08*2.99*142.59***--46.18***
Shannon index14.62***0.16----14.95***----
Total cover145.88***0.498.07**6.27***64.97***2.17*28.82***
Dissimilarity index4.43*0.08--//4.46*//--
Tree sp. richness4.76*0.08----4.78*----
Tree sp. covernsnsns----------
Ellenberg indicator values (EIVs)
Light (EIV-L)242.43***0.6221.52***3.20*203.75***--59.69***
Temperature (EIV-T)79.78***0.416.28**4.46**--2.79**--
Continentality (EIV-K)6.16*0.15----6.19*----
Moisture (EIV-F)20.57***0.54--5.27***------
Reaction (EIV-R)46.34***0.49--4.91***--2.85**--
Nutrients (EIV-N)46.70***0.46--7.62***------
Plant functional traits (CWMs)
Plant height103.72***0.445.85**5.33***53.02***--18.00***
Seed mass155.15***0.53----74.89***2.91**22.87***
SLA20.28**0.41--2.51*10.65**----
LDMCnsnsns----------
* p < 0.05, ** p < 0.01, *** p < 0.001; ns—not significant (p > 0.05).

